Illinois state executive official elections, 2014
2015 →
← 2013
|
| 2014 State Executive Official Elections |
| Alabama • Alaska • Arizona • Arkansas • California • Colorado • Connecticut • Delaware • Florida • Georgia • Hawaii • Idaho • Illinois • Indiana • Iowa • Kansas • Louisiana • Maine • Maryland • Massachusetts • Michigan • Minnesota • Missouri • Montana • Nebraska • Nevada • New Hampshire • New Mexico • New York • North Dakota • Ohio • Oklahoma • Oregon • Pennsylvania • Rhode Island • South Carolina • South Dakota • Tennessee • Texas • Utah • Vermont • Wisconsin • Wyoming |
| Partisan breakdown Candidates by office Voter turnout Key deadlines State executive organization Ballotpedia reports Recent news See also |
| News • Calendar |
Six state executive positions were up for election in 2014 in the state of Illinois. The primary election took place March 18. The general election took place on November 4, 2014.
A primary election is an election in which registered voters select a candidate that they believe should be a political party's candidate for elected office to run in the general election. They are also used to choose convention delegates and party leaders. Primaries are state-level and local-level elections that take place prior to a general election. Illinois uses an open primary system. Voters do not have to register with a party, but they do have to choose, publicly, which party's ballot they will vote on at the primary election.[1][2][3][4]
For information about which offices are nominated via primary election, see this article.
The following offices were elected in 2014 in Illinois:
- Governor of Illinois
- Lieutenant Governor of Illinois
- Attorney General of Illinois
- Illinois Secretary of State
- Illinois Treasurer
- Illinois Comptroller
In addition to candidate lists and election results, this page includes information about important dates, how the state's executive branch is organized, as well as links to articles about recent news in races across the state.
Partisan breakdown
Heading into the November 4 election, the Democratic Party held four of the six state executive seats in Illinois.
| Illinois State Executives -- Partisan Breakdown | |||
|---|---|---|---|
| Party | As of November 4, 2014 | After the 2014 Election | |
| Democratic Party | 4 | 3 | |
| Republican Party | 2 | 3 | |
| Total | 6 | 6 | |
Candidates by office
| Office | Incumbent | Assumed Office | Incumbent running? | General Election Candidates | 2015 Winner | Partisan Switch? |
| Governor | Pat Quinn  |
2009 | Yes[5] | Yes | ||
| Lieutenant Governor | Sheila Simon  |
2011 | No (ran for comptroller)[6] | Yes | ||
| Secretary of State | Jesse White  |
1999 | Yes[7] | No | ||
| Attorney General | Lisa Madigan  |
2003 | Yes[8] | No | ||
| Treasurer | Dan Rutherford  |
2011 | No (ran for governor)[9] | Yes | ||
| Comptroller | Judy Baar Topinka  |
2011 | Yes[10] | No |
Primary election results
Governor
- Democratic primary
| Governor and Lt. Governor of Illinois, Democratic Primary, 2014 | ||||
|---|---|---|---|---|
| Candidate | Vote % | Votes | ||
| 71.9% | 321,818 | |||
| Tio Hardiman & Brunell Donald | 28.1% | 125,500 | ||
| Total Votes | 447,318 | |||
| Election results via Illinois State Board of Elections. | ||||
- Republican primary
| Governor and Lt. Governor of Illinois, Republican Primary, 2014 | ||||
|---|---|---|---|---|
| Candidate | Vote % | Votes | ||
| 40.1% | 328,934 | |||
| Kirk Dillard & Jil Tracy | 37.2% | 305,120 | ||
| Bill Brady & Maria Rodriguez | 15.1% | 123,708 | ||
| Dan Rutherford & Steve Kim | 7.6% | 61,948 | ||
| Total Votes | 819,710 | |||
| Election results via Illinois State Board of Elections. | ||||
Attorney General
- Democratic primary - Uncontested
- Republican primary - Uncontested
Secretary of State
- Democratic primary - Uncontested
- Republican primary - Uncontested
Treasurer
- Republican primary
| Illinois Treasurer, Republican Primary, 2014 | ||||
|---|---|---|---|---|
| Candidate | Vote % | Votes | ||
| 57.4% | 397,691 | |||
| Bob Grogan | 42.6% | 295,682 | ||
| Total Votes | 693,373 | |||
| Election results via Illinois State Board of Elections. | ||||
- Democratic primary - Uncontested
Comptroller
- Democratic primary - Uncontested
- Republican primary - Uncontested
General election results
The general election took place on November 4, 2014.
Governor/Lieutenant Governor
| Governor and Lieutenant Governor of Illinois, 2014 | ||||
|---|---|---|---|---|
| Party | Candidate | Vote % | Votes | |
| Republican | 50.3% | 1,823,627 | ||
| Democratic | Pat Quinn/Paul Vallas Incumbent | 46.3% | 1,681,343 | |
| Libertarian | Chad Grimm/Alex Cummings | 3.4% | 121,534 | |
| Nonpartisan | Write-in votes | 0% | 1,186 | |
| Total Votes | 3,627,690 | |||
| Election results via Illinois State Board of Elections | ||||
Attorney General
| Attorney General of Illinois, 2014 | ||||
|---|---|---|---|---|
| Party | Candidate | Vote % | Votes | |
| Democratic | 59.5% | 2,142,558 | ||
| Republican | Paul Schimpf | 37.8% | 1,360,763 | |
| Libertarian | Ben Koyl | 2.8% | 99,903 | |
| Total Votes | 3,603,224 | |||
| Election results via Illinois State Board of Elections | ||||
Secretary of State
| Secretary of State of Illinois, 2014 | ||||
|---|---|---|---|---|
| Party | Candidate | Vote % | Votes | |
| Democratic | 65.7% | 2,374,849 | ||
| Republican | Mike Webster | 31.4% | 1,134,452 | |
| Libertarian | Chris Michel | 2.9% | 104,498 | |
| Nonpartisan | Write-in votes | 0% | 809 | |
| Total Votes | 3,614,608 | |||
| Election results via Illinois State Board of Elections | ||||
Treasurer
| Illinois Treasurer, 2014 | ||||
|---|---|---|---|---|
| Party | Candidate | Vote % | Votes | |
| Democratic | 48.1% | 1,694,884 | ||
| Republican | Tom Cross | 47.8% | 1,685,659 | |
| Libertarian | Matt Skopek | 4.2% | 146,654 | |
| Total Votes | 3,527,197 | |||
| Election results via Illinois State Board of Elections | ||||
Comptroller
| Illinois Controller, 2014 | ||||
|---|---|---|---|---|
| Party | Candidate | Vote % | Votes | |
| Republican | 49.6% | 1,775,983 | ||
| Democratic | Sheila Simon | 45.7% | 1,636,593 | |
| Libertarian | Julie Fox | 4.8% | 170,534 | |
| Nonpartisan | Write-in votes | 0% | 176 | |
| Total Votes | 3,583,286 | |||
| Election results via Illinois State Board of Elections | ||||
Voter turnout
Political scientist Michael McDonald's United States Elections Project studied voter turnout in the 2014 election by looking at the percentage of eligible voters who headed to the polls. McDonald used voting-eligible population (VEP), or the number of eligible voters independent of their current registration status, to calculate turnout rates in each state on November 4. He also incorporated ballots cast for the highest office in each state into his calculation. He estimated that 81,687,059 ballots were cast in the 50 states plus the District of Columbia, representing 35.9 percent of the VEP.[11] By comparison, 61.6 percent of VEP voted in the 2008 presidential election and 58.2 percent of VEP voted in the 2012 presidential election.[12]
Quick facts
- According to PBS Newshour, voter turnout in the 2014 midterms was the lowest since the 1942 midterms, which took place during the nation's involvement in World War II.[13]
- Forty-three states and the District of Columbia failed to surpass 50 percent turnout in McDonald's analysis.
- The three states with the lowest turnout according to McDonald's analysis were Texas (28.3 percent), Tennessee (28.6 percent), and Indiana (28.8 percent).
- Maine (58.5 percent), Wisconsin (56.5 percent), and Colorado (54.5 percent) were the three states with the highest turnout.
- There were only 12 states that increased voter turnout in 2014 compared to the 2010 midterm elections.[14]
| Voter turnout rates, 2014 | |||||
|---|---|---|---|---|---|
| State | Total votes counted | % voter eligible population | Top statewide office up for election | Size of lead (Raw votes) | Size of lead (%) |
| Alabama | 1,191,274 | 33.2 | Governor | 320,319 | 27.2 |
| Alaska | 285,431 | 54.4 | Governor | 4,004 | 1.6 |
| Arizona | 1,537,671 | 34.1 | Governor | 143,951 | 12.5 |
| Arkansas | 852,642 | 40.1 | Governor | 118,664 | 14.0 |
| California | 7,513,972 | 30.8 | Governor | 1,065,748 | 17.8 |
| Colorado | 2,080,071 | 54.5 | Governor | 50,395 | 2.4 |
| Connecticut | 1,096,509 | 42.5 | Governor | 26,603 | 2.5 |
| Delaware | 234,038 | 34.4 | Attorney General | 31,155 | 13.6 |
| District of Columbia | 177,176 | 35.8 | Mayor | 27,934 | 19.0 |
| Florida | 6,026,802 | 43.3 | Governor | 66,127 | 1.1 |
| Georgia | 2,596,947 | 38.5 | Governor | 202,685 | 8.0 |
| Hawaii | 369,554 | 36.5 | Governor | 45,323 | 12.4 |
| Idaho | 445,307 | 39.6 | Governor | 65,852 | 14.9 |
| Illinois | 3,680,417 | 40.9 | Governor | 171,900 | 4.9 |
| Indiana | 1,387,622 | 28.8 | Secretary of State | 234,978 | 17.8 |
| Iowa | 1,142,284 | 50.2 | Governor | 245,548 | 21.8 |
| Kansas | 887,023 | 43.4 | Governor | 33,052 | 3.9 |
| Kentucky | 1,435,868 | 44.0 | U.S. Senate | 222,096 | 15.5 |
| Louisiana | 1,472,039 | 43.8 | U.S. Senate | 16,401 | 1.1 |
| Maine | 616,996 | 58.5 | Governor | 29,820 | 4.9 |
| Maryland | 1,733,177 | 41.5 | Governor | 88,648 | 6.1 |
| Massachusetts | 2,186,789 | 44.6 | Governor | 40,361 | 1.9 |
| Michigan | 3,188,956 | 43.2 | Governor | 129,547 | 4.3 |
| Minnesota | 1,992,613 | 50.5 | Governor | 109,776 | 5.6 |
| Mississippi | 631,858 | 28.9 | U.S. Senate | 141,234 | 33.0 |
| Missouri | 1,426,303 | 31.8 | Auditor | 684,074 | 53.6 |
| Montana | 373,831 | 47.3 | U.S. Senate | 65,262 | 17.9 |
| Nebraska | 552,115 | 41.5 | Governor | 97,678 | 18.7 |
| Nevada | 547,349 | 29.0 | Governor | 255,793 | 46.7 |
| New Hampshire | 495,565 | 48.4 | Governor | 24,924 | 5.2 |
| New Jersey | 1,955,042 | 32.5 | N/A | N/A | N/A |
| New Mexico | 512,805 | 35.7 | Governor | 73,868 | 14.6 |
| New York | 3,930,310 | 29.0 | Governor | 476,252 | 13.4 |
| North Carolina | 2,939,767 | 41.2 | U.S. Senate | 48,511 | 1.7 |
| North Dakota | 255,128 | 45.0 | U.S. House At-large seat | 42,214 | 17.1 |
| Ohio | 3,149,876 | 36.2 | Governor | 933,235 | 30.9 |
| Oklahoma | 824,831 | 29.8 | Governor | 122,060 | 14.7 |
| Oregon | 1,541,782 | 53.5 | Governor | 59,029 | 4.5 |
| Pennsylvania | 3,495,866 | 36.0 | Governor | 339,261 | 9.8 |
| Rhode Island | 329,212 | 42.2 | Governor | 14,346 | 4.5 |
| South Carolina | 1,261,611 | 35.2 | Governor | 179,089 | 14.6 |
| South Dakota | 282,291 | 44.9 | Governor | 124,865 | 45.1 |
| Tennessee | 1,374,065 | 28.6 | Governor | 642,214 | 47.5 |
| Texas | 4,727,208 | 28.3 | Governor | 957,973 | 20.4 |
| Utah | 577,973 | 30.2 | Attorney General | 173,819 | 35.2 |
| Vermont | 193,087 | 38.8 | Governor | 2,095 | 1.1 |
| Virginia | 2,194,346 | 36.6 | U.S. Senate | 16,727 | 0.8 |
| Washington | 2,123,901 | 43.1 | N/A | N/A | N/A |
| West Virginia | 451,498 | 31.2 | U.S. Senate | 124,667 | 27.6 |
| Wisconsin | 2,410,314 | 56.5 | Governor | 137,607 | 5.7 |
| Wyoming | 168,390 | 39.3 | Governor | 52,703 | 33.6 |
Note: Information from the United States Elections Project was last updated on December 16, 2014.
Key deadlines
| Deadline | Event |
|---|---|
| December 2, 2013 | Last day of petition filing for established political parties |
| January 16, 2014 | Last day to file a Declaration of Intent to be a write-in candidate |
| March 18, 2014 | Primary election |
| November 4, 2014 | General election |
| November 25, 2014 | Last day for canvassing election results by proper canvassing board |
| January 12, 2015 | Inauguration day for state executive officials in general election |
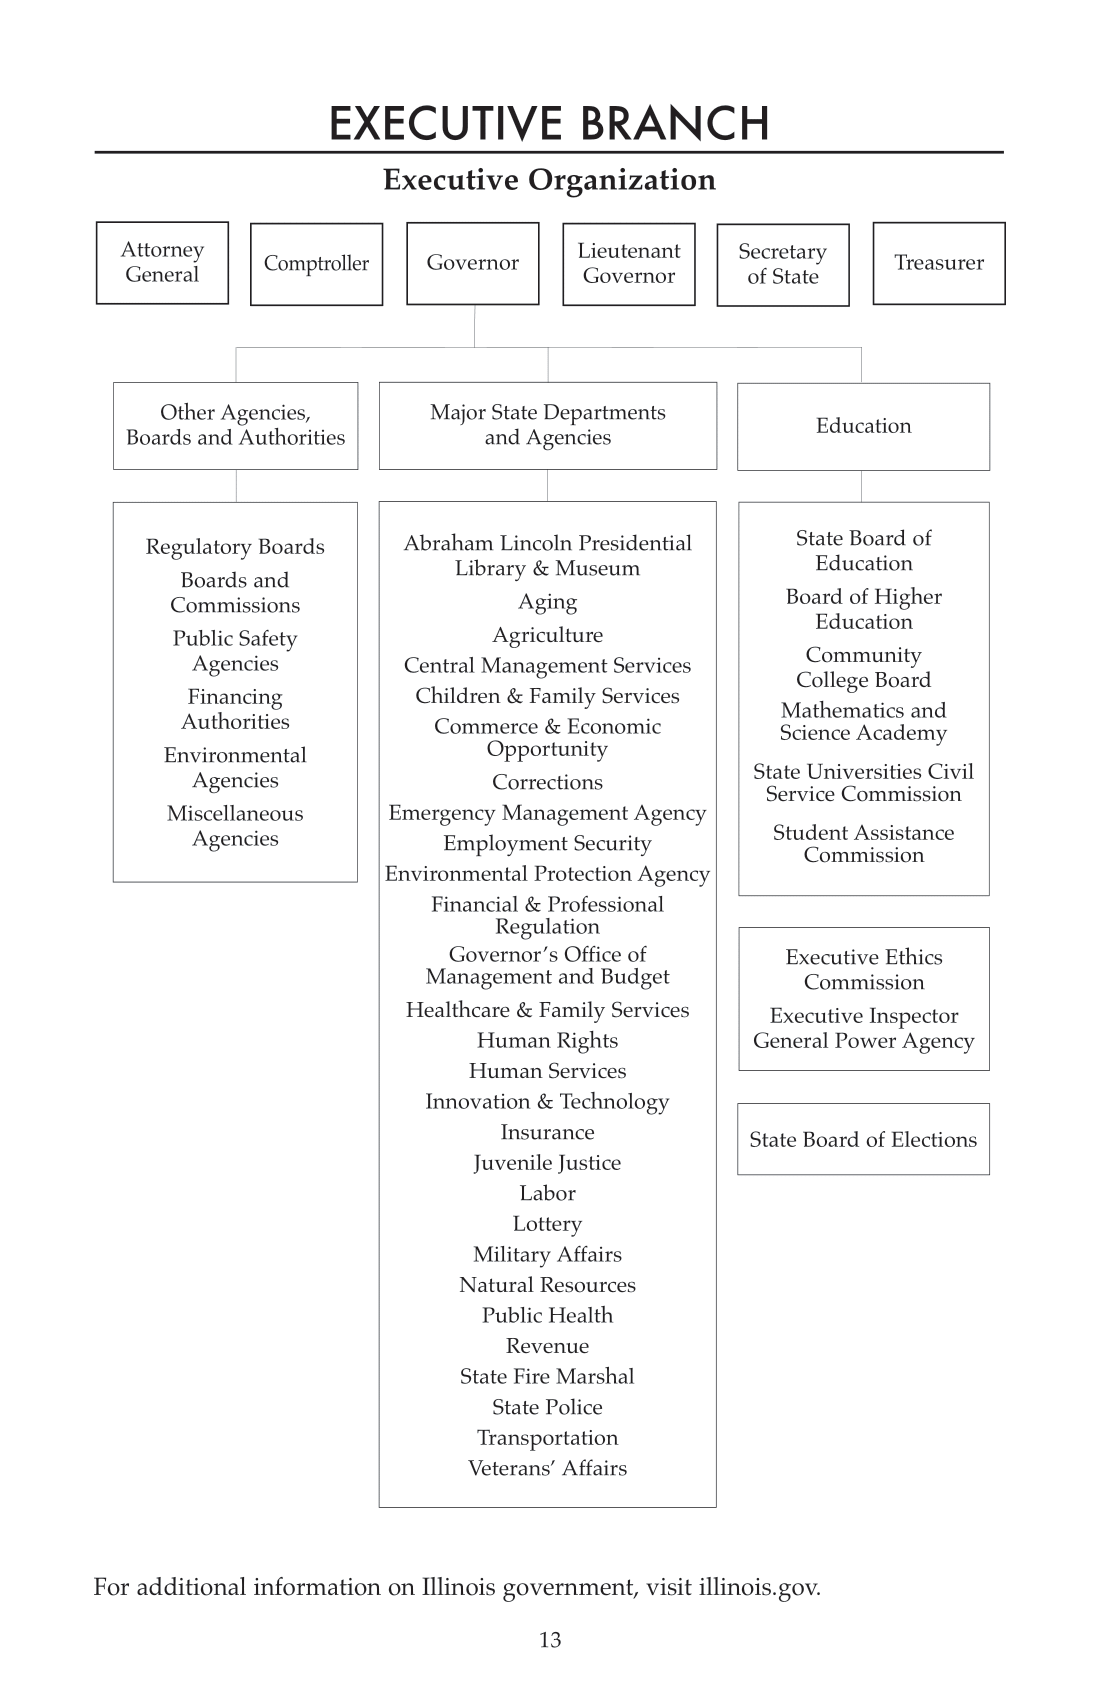
State executive organization
Executive officials in Illinois are part of a three-pronged government structure that includes state legislators and state judges. The following chart details the relationship among different branches of Illinois's state government:
Ballotpedia reports
To learn more about developments in these races, check out the following news articles from Ballotpedia:
- Pat Quinn to face Bruce Rauner in November: Illinois state executive primary elections review
- Illinois primary 2014 state executive officials preview
Recent news
This section links to a Google news search for the term "Illinois + state + executive + elections"
See also
- Illinois Gubernatorial and Lieutenant Gubernatorial election, 2014
- Illinois attorney general election, 2014
- Illinois secretary of state election, 2014
- Illinois down ballot state executive elections, 2014
External links
Footnotes
- ↑ Illinois Courts Student Learning Center, "Illinois Government Lesson 5 - Voting in Illinois," accessed October 25, 2019
- ↑ National Conference of State Legislatures, "State Primary Election Types," accessed October 25, 2019
- ↑ FairVote, "Primaries," accessed October 25, 2019
- ↑ Ballotpedia research conducted December 26, 2013, through January 3, 2014, researching and analyzing various state websites and codes.
- ↑ Illinois State Board of Elections, "Candidate list: Governor and Lieutenant Governor," accessed December 3, 2013
- ↑ CBS Local - Chicago, "2014 Governor Candidates To Choose Running Mates," August 24, 2013
- ↑ Illinois State Board of Elections, "2014 Candidate List: Secretary of State," accessed December 3, 2013
- ↑ Capitol Fax, "This just in… Lisa Madigan announces re-election bid," July 15, 2013
- ↑ The Southern, "Rutherford announces gov. campaign in Southern Illinois," June 2, 2013
- ↑ Judy Baar Topinka 2014 Official campaign website, "Press release:TOPINKA DELIVERS ‘COMMON SENSE’ TO MT. VERNON, LAUNCHES CAMPAIGN," September 17, 2013
- ↑ United States Elections Project, "2014 November General Election Turnout Rates," November 7, 2014
- ↑ TIME, "Voter Turnout in Midterm Elections Hits 72-Year Low," November 10, 2014
- ↑ PBS, "2014 midterm election turnout lowest in 70 years," November 10, 2014
- ↑ U.S. News & World Report, "Midterm Turnout Down in 2014," November 5, 2014
| ||||||||||||||||

| |||||||||||
State of Illinois Springfield (capital) | |
|---|---|
| Elections |
What's on my ballot? | Elections in 2024 | How to vote | How to run for office | Ballot measures |
| Government |
Who represents me? | U.S. President | U.S. Congress | Federal courts | State executives | State legislature | State and local courts | Counties | Cities | School districts | Public policy |