New Mexico state executive official elections, 2014
2015 →
← 2013
|
| 2014 State Executive Official Elections |
| Alabama • Alaska • Arizona • Arkansas • California • Colorado • Connecticut • Delaware • Florida • Georgia • Hawaii • Idaho • Illinois • Indiana • Iowa • Kansas • Louisiana • Maine • Maryland • Massachusetts • Michigan • Minnesota • Missouri • Montana • Nebraska • Nevada • New Hampshire • New Mexico • New York • North Dakota • Ohio • Oklahoma • Oregon • Pennsylvania • Rhode Island • South Carolina • South Dakota • Tennessee • Texas • Utah • Vermont • Wisconsin • Wyoming |
| Partisan breakdown Candidates by office Voter turnout Key deadlines State executive organization Ballotpedia reports Recent news See also |
| News • Calendar |
Seventeen state executive positions were up for election in 2014 in the state of New Mexico. The general election took place on November 4, 2014.
In addition to candidate lists and election results, this page includes information about important dates, how the state's executive branch is organized, as well as links to articles about recent news in races across the state.
A primary election is an election in which registered voters select a candidate that they believe should be a political party's candidate for elected office to run in the general election. They are also used to choose convention delegates and party leaders. Primaries are state-level and local-level elections that take place prior to a general election. New Mexico utilizes a closed primary process; participation in each party's primary is limited to registered party members.[1][2][3]
For information about which offices are nominated via primary election, see this article.
The following offices were elected in 2014 in New Mexico:
- Governor of New Mexico
- Lieutenant Governor of New Mexico
- New Mexico Attorney General
- New Mexico Secretary of State
- New Mexico Treasurer
- New Mexico Auditor
- New Mexico Commissioner of Public Lands
- New Mexico Public Service Commissioner (3 seats)
- New Mexico Education Commissioner (7 seats)
Partisan breakdown
Heading into the November 4 election, the Democratic Party held nine out of 17 executive seats in New Mexico, with one seat held by an independent and one seat vacant.
| New Mexico State Executives -- Partisan Breakdown | |||
|---|---|---|---|
| Party | As of November 4, 2014 | After the 2014 Election | |
| Democratic Party | 9 | 11 | |
| Republican Party | 6 | 6 | |
| Independent | 1 | 0 | |
| Vacant | 1 | 0 | |
| Total | 17 | 17 | |
Candidates by office


| Office | Incumbent | Assumed Office | Incumbent running? | General Election Candidates | 2015 Winner | Partisan Switch? |
| Public Education Commission (District 1) | Vacant | N/A | No | |||
| Public Education Commission (District 2) | Millie Pogna  |
2010 | Yes[4] | No | ||
| Public Education Commission (District 3) | Carmie Toulouse | Yes[4] | No | |||
| Public Education Commission (District 4) | J. Tyson Parker  |
2013 | No[4] | No | ||
| Public Education Commission (District 5) | James Conyers | Yes[4] | No | |||
| Public Education Commission (District 6) | Gilbert Peralta  |
2010 | Yes[4] | No | ||
| Public Education Commission (District 7) | Eugene Gant  |
2010 | No[4] | No |
Primary results
Governor
Republican primary
Incumbent Susana Martinez was uncontested in the primary.
Democratic primary
| Governor of New Mexico, Democratic Primary, 2014 | ||||
|---|---|---|---|---|
| Candidate | Vote % | Votes | ||
| 35% | 43,918 | |||
| Alan Webber | 22.7% | 28,406 | ||
| Lawrence Rael | 19.8% | 24,878 | ||
| Howie Morales | 14.2% | 17,863 | ||
| Linda Lopez | 8.2% | 10,288 | ||
| Mario Martinez | 0% | 16 | ||
| Phillip Chavez | 0% | 2 | ||
| Total Votes | 125,371 | |||
| Election results via New Mexico Secretary of State. | ||||
Lieutenant Governor
Republican primary
Incumbent John Sanchez was uncontested in the primary.
Democratic primary
Challenger Debra Haaland was uncontested in the primary.
Attorney General
Republican primary
Susan Riedel was uncontested in the primary.
Democratic primary
Hector Balderas was uncontested in the primary.
Secretary of State
Republican primary
Incumbent Dianna Duran was uncontested in the primary.
Democratic primary
Challenger Maggie Toulouse Oliver was uncontested in the primary.
Treasurer
Republican primary
Rick Lopez was uncontested in the primary.
Democratic primary
| New Mexico Treasurer, Democratic Primary, 2014 | ||||
|---|---|---|---|---|
| Candidate | Vote % | Votes | ||
| 52.7% | 59,683 | |||
| John Wertheim | 47.3% | 53,523 | ||
| Total Votes | 113,206 | |||
| Election results via New Mexico Secretary of State. | ||||
Auditor
Republican primary
Robert Aragon was uncontested in the primary.
Democratic primary
Tim Keller was uncontested in the primary.
New Mexico Commissioner of Public Lands
Republican primary
Challenger Aubrey Dunn was uncontested in the primary.
Democratic primary
Incumbent Ray Powell was uncontested in the primary.
Public Regulation Commissioner
District 2
Republican primary
Incumbent Patrick H. Lyons was uncontested in the primary.
Democratic primary
No Democratic candidates filed for the District 2 seat.
District 4
Republican primary
No Republican candidates filed for the District 4 seat.
Democratic primary
| New Mexico Public Regulation Commissioner, District 4, Democratic Primary, 2014 | ||||
|---|---|---|---|---|
| Candidate | Vote % | Votes | ||
| 46.2% | 9,904 | |||
| Theresa Becenti-Aguilar Incumbent | 32.4% | 6,935 | ||
| Edward Michael | 21.4% | 4,587 | ||
| Total Votes | 21,426 | |||
| Election results via New Mexico Secretary of State. | ||||
District 5
Republican primary
Incumbent Ben L. Hall was uncontested in the primary.
Democratic primary
| New Mexico Public Regulation Commissioner, District 5, Democratic Primary, 2014 | ||||
|---|---|---|---|---|
| Candidate | Vote % | Votes | ||
| 50.3% | 9,911 | |||
| Merrie Soules | 49.7% | 9,783 | ||
| Total Votes | 19,694 | |||
| Election results via New Mexico Secretary of State. | ||||
Education Commissioner
District 1
Republican primary
No Republican candidates filed for the District 1 seat.
Democratic primary
Eleanor Chavez was uncontested in the primary.
District 2
Republican primary
Incumbent Millie Pogna was uncontested in the primary.
Democratic primary
No Democratic candidates filed for the District 2 seat.
District 3
Republican primary
No Republican candidates filed for the District 3 seat.
Democratic primary
Carmie Toulouse was uncontested in the primary.
District 4
Republican primary
No Republican candidates filed for the District 4 seat.
Democratic primary
Karyl Armbruster was uncontested in the primary.
District 5
Republican primary
No Republican candidates filed for the District 5 seat.
Democratic primary
James Conyers was uncontested in the primary.
District 6
Republican primary
No Republican candidates filed for the District 6 seat.
Democratic primary
Gilbert Peralta was uncontested in the primary.
District 7
Republican primary
No Republican candidates filed for the District 7 seat.
Democratic primary
Patricia Gipson was uncontested in the primary.
General election results
The general election took place on November 4, 2014.
Governor and Lieutenant Governor
| Governor and Lieutenant Governor of New Mexico, 2014 | ||||
|---|---|---|---|---|
| Party | Candidate | Vote % | Votes | |
| Republican | 57.2% | 293,443 | ||
| Democrat | Gary King/Debra Haaland | 42.8% | 219,362 | |
| Total Votes | 512,805 | |||
| Election results via New Mexico Secretary of State | ||||
Attorney General
| Attorney General of New Mexico, 2014 | ||||
|---|---|---|---|---|
| Party | Candidate | Vote % | Votes | |
| Democratic | 58.3% | 295,008 | ||
| Republican | Susan Riedel | 41.7% | 211,303 | |
| Total Votes | 506,311 | |||
| Election results via New Mexico Secretary of State | ||||
Secretary of State
| Secretary of State of New Mexico, 2014 | ||||
|---|---|---|---|---|
| Party | Candidate | Vote % | Votes | |
| Republican | 51.6% | 262,117 | ||
| Democratic | Maggie Toulouse Oliver | 48.4% | 245,508 | |
| Total Votes | 507,625 | |||
| Election results via New Mexico Secretary of State | ||||
Treasurer
| New Mexico Treasurer, 2014 | ||||
|---|---|---|---|---|
| Party | Candidate | Vote % | Votes | |
| Democratic | 52.5% | 261,203 | ||
| Republican | Rick Lopez | 47.5% | 236,699 | |
| Total Votes | 497,902 | |||
| Election results via New Mexico Secretary of State | ||||
Auditor
| New Mexico Auditor, 2014 | ||||
|---|---|---|---|---|
| Party | Candidate | Vote % | Votes | |
| Democratic | 54.3% | 270,386 | ||
| Republican | Robert Aragon | 45.7% | 228,019 | |
| Total Votes | 498,405 | |||
| Election results via New Mexico Secretary of State | ||||
New Mexico Commissioner of Public Lands
| New Mexico Land Commissioner, 2014 | ||||
|---|---|---|---|---|
| Party | Candidate | Vote % | Votes | |
| Republican | 50.1% | 250,185 | ||
| Democratic | Ray Powell Incumbent | 49.9% | 249,481 | |
| Total Votes | 499,666 | |||
| Election results via New Mexico Secretary of State | ||||
Public Regulation Commissioner
| New Mexico Public Service Commissioner, 2014 | ||||
|---|---|---|---|---|
| Party | Candidate | Vote % | Votes | |
| Democratic | 50.9% | 45,547 | ||
| Republican | Ben L. Hall Incumbent | 49.1% | 43,966 | |
| Total Votes | 89,513 | |||
| Election results via New Mexico Secretary of State | ||||
Patrick H. Lyons and Lynda Lovejoy were running for election without opposition.
Education Commissioner
All seven candidates for the Public Education Commission were running for election without opposition.
Voter turnout
Political scientist Michael McDonald's United States Elections Project studied voter turnout in the 2014 election by looking at the percentage of eligible voters who headed to the polls. McDonald used voting-eligible population (VEP), or the number of eligible voters independent of their current registration status, to calculate turnout rates in each state on November 4. He also incorporated ballots cast for the highest office in each state into his calculation. He estimated that 81,687,059 ballots were cast in the 50 states plus the District of Columbia, representing 35.9 percent of the VEP.[5] By comparison, 61.6 percent of VEP voted in the 2008 presidential election and 58.2 percent of VEP voted in the 2012 presidential election.[6]
Quick facts
- According to PBS Newshour, voter turnout in the 2014 midterms was the lowest since the 1942 midterms, which took place during the nation's involvement in World War II.[7]
- Forty-three states and the District of Columbia failed to surpass 50 percent turnout in McDonald's analysis.
- The three states with the lowest turnout according to McDonald's analysis were Texas (28.3 percent), Tennessee (28.6 percent), and Indiana (28.8 percent).
- Maine (58.5 percent), Wisconsin (56.5 percent), and Colorado (54.5 percent) were the three states with the highest turnout.
- There were only 12 states that increased voter turnout in 2014 compared to the 2010 midterm elections.[8]
| Voter turnout rates, 2014 | |||||
|---|---|---|---|---|---|
| State | Total votes counted | % voter eligible population | Top statewide office up for election | Size of lead (Raw votes) | Size of lead (%) |
| Alabama | 1,191,274 | 33.2 | Governor | 320,319 | 27.2 |
| Alaska | 285,431 | 54.4 | Governor | 4,004 | 1.6 |
| Arizona | 1,537,671 | 34.1 | Governor | 143,951 | 12.5 |
| Arkansas | 852,642 | 40.1 | Governor | 118,664 | 14.0 |
| California | 7,513,972 | 30.8 | Governor | 1,065,748 | 17.8 |
| Colorado | 2,080,071 | 54.5 | Governor | 50,395 | 2.4 |
| Connecticut | 1,096,509 | 42.5 | Governor | 26,603 | 2.5 |
| Delaware | 234,038 | 34.4 | Attorney General | 31,155 | 13.6 |
| District of Columbia | 177,176 | 35.8 | Mayor | 27,934 | 19.0 |
| Florida | 6,026,802 | 43.3 | Governor | 66,127 | 1.1 |
| Georgia | 2,596,947 | 38.5 | Governor | 202,685 | 8.0 |
| Hawaii | 369,554 | 36.5 | Governor | 45,323 | 12.4 |
| Idaho | 445,307 | 39.6 | Governor | 65,852 | 14.9 |
| Illinois | 3,680,417 | 40.9 | Governor | 171,900 | 4.9 |
| Indiana | 1,387,622 | 28.8 | Secretary of State | 234,978 | 17.8 |
| Iowa | 1,142,284 | 50.2 | Governor | 245,548 | 21.8 |
| Kansas | 887,023 | 43.4 | Governor | 33,052 | 3.9 |
| Kentucky | 1,435,868 | 44.0 | U.S. Senate | 222,096 | 15.5 |
| Louisiana | 1,472,039 | 43.8 | U.S. Senate | 16,401 | 1.1 |
| Maine | 616,996 | 58.5 | Governor | 29,820 | 4.9 |
| Maryland | 1,733,177 | 41.5 | Governor | 88,648 | 6.1 |
| Massachusetts | 2,186,789 | 44.6 | Governor | 40,361 | 1.9 |
| Michigan | 3,188,956 | 43.2 | Governor | 129,547 | 4.3 |
| Minnesota | 1,992,613 | 50.5 | Governor | 109,776 | 5.6 |
| Mississippi | 631,858 | 28.9 | U.S. Senate | 141,234 | 33.0 |
| Missouri | 1,426,303 | 31.8 | Auditor | 684,074 | 53.6 |
| Montana | 373,831 | 47.3 | U.S. Senate | 65,262 | 17.9 |
| Nebraska | 552,115 | 41.5 | Governor | 97,678 | 18.7 |
| Nevada | 547,349 | 29.0 | Governor | 255,793 | 46.7 |
| New Hampshire | 495,565 | 48.4 | Governor | 24,924 | 5.2 |
| New Jersey | 1,955,042 | 32.5 | N/A | N/A | N/A |
| New Mexico | 512,805 | 35.7 | Governor | 73,868 | 14.6 |
| New York | 3,930,310 | 29.0 | Governor | 476,252 | 13.4 |
| North Carolina | 2,939,767 | 41.2 | U.S. Senate | 48,511 | 1.7 |
| North Dakota | 255,128 | 45.0 | U.S. House At-large seat | 42,214 | 17.1 |
| Ohio | 3,149,876 | 36.2 | Governor | 933,235 | 30.9 |
| Oklahoma | 824,831 | 29.8 | Governor | 122,060 | 14.7 |
| Oregon | 1,541,782 | 53.5 | Governor | 59,029 | 4.5 |
| Pennsylvania | 3,495,866 | 36.0 | Governor | 339,261 | 9.8 |
| Rhode Island | 329,212 | 42.2 | Governor | 14,346 | 4.5 |
| South Carolina | 1,261,611 | 35.2 | Governor | 179,089 | 14.6 |
| South Dakota | 282,291 | 44.9 | Governor | 124,865 | 45.1 |
| Tennessee | 1,374,065 | 28.6 | Governor | 642,214 | 47.5 |
| Texas | 4,727,208 | 28.3 | Governor | 957,973 | 20.4 |
| Utah | 577,973 | 30.2 | Attorney General | 173,819 | 35.2 |
| Vermont | 193,087 | 38.8 | Governor | 2,095 | 1.1 |
| Virginia | 2,194,346 | 36.6 | U.S. Senate | 16,727 | 0.8 |
| Washington | 2,123,901 | 43.1 | N/A | N/A | N/A |
| West Virginia | 451,498 | 31.2 | U.S. Senate | 124,667 | 27.6 |
| Wisconsin | 2,410,314 | 56.5 | Governor | 137,607 | 5.7 |
| Wyoming | 168,390 | 39.3 | Governor | 52,703 | 33.6 |
Note: Information from the United States Elections Project was last updated on December 16, 2014.
Key deadlines
| Deadline | Event |
|---|---|
| March 11, 2014 | Candidate filing deadline for primary |
| June 3, 2014 | Primary election |
| June 26, 2014 | Filing deadline for independent and minor party candidates |
| November 4, 2014 | General election |
| November 25, 2014 | State canvassing of election results |
| January 1, 2015 | Inauguration day for state executive officers |
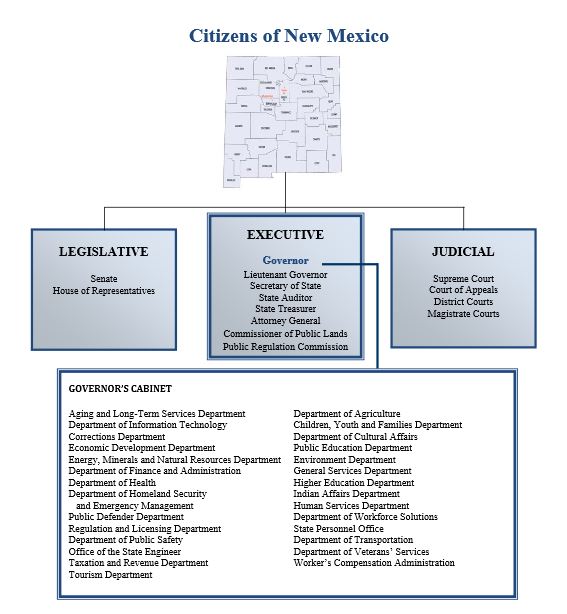
State executive organization
Executive officials in New Mexico are part of a three-pronged government structure that includes state legislators and state judges. The following chart details the relationship among different branches of New Mexico's state government:
Ballotpedia reports
To learn more about developments in these races, check out the following news articles from Ballotpedia:
- Only contested incumbent loses in primary: New Mexico state executive elections review
- Four contested primaries in New Mexico: State executive elections preview
- New Mexico filing deadline report: 19 Candidates file for 7 state executive positions
Recent news
This section links to a Google news search for the term "New + Mexico + state + executive + elections"
See also
- New Mexico filing deadline report: 19 Candidates file for 7 state executive positions
- Portal:Elections
- State executive official elections, 2014
- New Mexico state executive offices
Footnotes
- ↑ National Conference of State Legislatures, "State Primary Election Types," accessed April 28, 2023
- ↑ Ballotpedia research conducted December 26, 2013, through January 3, 2014, researching and analyzing various state websites and codes.
- ↑ New Mexico Secretary of State, "FAQs for Primary & General Election Candidacy," accessed April 28, 2023
- ↑ 4.0 4.1 4.2 4.3 4.4 4.5 4.6 4.7 4.8 Cite error: Invalid
<ref>tag; no text was provided for refs namedcandlist - ↑ United States Elections Project, "2014 November General Election Turnout Rates," November 7, 2014
- ↑ TIME, "Voter Turnout in Midterm Elections Hits 72-Year Low," November 10, 2014
- ↑ PBS, "2014 midterm election turnout lowest in 70 years," November 10, 2014
- ↑ U.S. News & World Report, "Midterm Turnout Down in 2014," November 5, 2014
| ||||||||||||||||

 |
State of New Mexico Santa Fe (capital) |
|---|---|
| Elections |
What's on my ballot? | Elections in 2024 | How to vote | How to run for office | Ballot measures |
| Government |
Who represents me? | U.S. President | U.S. Congress | Federal courts | State executives | State legislature | State and local courts | Counties | Cities | School districts | Public policy |