South Carolina state executive official elections, 2014
2015 →
← 2013
|
| 2014 State Executive Official Elections |
| Alabama • Alaska • Arizona • Arkansas • California • Colorado • Connecticut • Delaware • Florida • Georgia • Hawaii • Idaho • Illinois • Indiana • Iowa • Kansas • Louisiana • Maine • Maryland • Massachusetts • Michigan • Minnesota • Missouri • Montana • Nebraska • Nevada • New Hampshire • New Mexico • New York • North Dakota • Ohio • Oklahoma • Oregon • Pennsylvania • Rhode Island • South Carolina • South Dakota • Tennessee • Texas • Utah • Vermont • Wisconsin • Wyoming |
| Partisan breakdown Candidates by office Voter turnout Key deadlines State executive organization Ballotpedia reports Recent news See also |
| News • Calendar |
Nine state executive positions were up for election in 2014 in the state of South Carolina. The general election took place on November 4, 2014.
In addition to candidate lists and election results, this page includes information about important dates, how the state's executive branch is organized, as well as links to articles about recent news in races across the state.
A primary election is an election in which registered voters select a candidate that they believe should be a political party's candidate for elected office to run in the general election. They are also used to choose convention delegates and party leaders. Primaries are state-level and local-level elections that take place prior to a general election. South Carolina utilizes an open primary system, in which registered voters do not have to be members of a party to vote in that party's primary. Voters must take an oath affirming that they have not voted in another party's primary.[1][2][3][4]
For information about which offices are nominated via primary election, see this article.
The following offices were elected in 2014 in South Carolina:
- Governor of South Carolina
- Lieutenant Governor of South Carolina
- South Carolina Attorney General
- South Carolina Secretary of State
- South Carolina Treasurer
- South Carolina Controller
- South Carolina Superintendent
- South Carolina Agriculture Commissioner
- South Carolina Adjutant General
Partisan breakdown
Heading into the November 4 election, the Republican Party held eight of the nine state executive seats in South Carolina.
| South Carolina State Executives -- Partisan Breakdown | |||
|---|---|---|---|
| Party | As of November 4, 2014 | After the 2014 Election | |
| Republican Party | 8 | 9 | |
| Democratic Party | 1 | 0 | |
| Total | 9 | 9 | |
Candidates by office
| Office | Incumbent | Assumed Office | Incumbent running? | General Election Candidates | 2015 Winner | Partisan Switch? |
| Governor | Nikki Haley 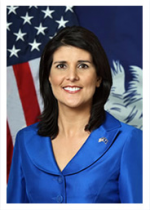 |
2011 | Yes[5] | No | ||
| Lieutenant Governor | John McGill  |
2014 | No | Yes | ||
| Secretary of State | Mark Hammond 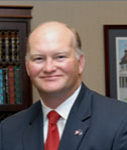 |
2003 | Yes | No | ||
| Attorney General | Michael Alan Wilson  |
2011 | Yes | No | ||
| Treasurer | Curtis Loftis, Jr.  |
2011 | Yes | No | ||
| Comptroller General | Richard Eckstrom  |
2002 | Yes | No | ||
| Superintendent of Education | Mick Zais  |
2011 | No | No | ||
| Commissioner of Agriculture | Hugh Weathers 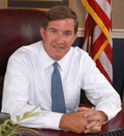 |
2005 | Yes | No | ||
| Adjutant General | Robert E. Livingston, Jr.  |
2011 | Yes | No |
Primary election results
Governor
Lieutenant Governor
| Lieutenant Governor of South Carolina, Republican Primary, 2014 | ||||
|---|---|---|---|---|
| Candidate | Vote % | Votes | ||
| 43.6% | 131,546 | |||
| 23.9% | 72,204 | |||
| Pat McKinney (withdrew)[6] | 24.4% | 73,451 | ||
| Ray Moore | 8.1% | 24,335 | ||
| Total Votes | 301,536 | |||
| Election results via South Carolina State Elections Commission. | ||||
Primary runoff results
| Lieutenant Governor of South Carolina, Republican Runoff, 2014 | ||||
|---|---|---|---|---|
| Candidate | Vote % | Votes | ||
| 63.6% | 85,301 | |||
| Mike Campbell | 36.4% | 48,863 | ||
| Total Votes | 134,164 | |||
| Election results via South Carolina State Elections Commission. | ||||
Attorney General
Secretary of State
Treasurer
| South Carolina Treasurer, Republican Primary, 2014 | ||||
|---|---|---|---|---|
| Candidate | Vote % | Votes | ||
| 62% | 177,854 | |||
| Brian Adams | 38% | 108,934 | ||
| Total Votes | 286,788 | |||
| Election results via South Carolina State Elections Commission. | ||||
Controller
Auditor
Superintendent of Public Instruction
| South Carolina Superintendent, Republican Primary, 2014 | ||||
|---|---|---|---|---|
| Candidate | Vote % | Votes | ||
| 22.4% | 64,992 | |||
| 22% | 63,584 | |||
| Sheri Few | 19.4% | 56,044 | ||
| Gary Burgess | 10.7% | 31,091 | ||
| Amy Cofield | 7.2% | 20,720 | ||
| Charmeka Childs | 6.7% | 19,436 | ||
| Elizabeth Moffly | 6% | 17,421 | ||
| Don Jordan | 5.6% | 16,246 | ||
| Total Votes | 289,534 | |||
| Election results via South Carolina State Elections Commission. | ||||
| South Carolina Superintendent, Democratic Primary, 2014 | ||||
|---|---|---|---|---|
| Candidate | Vote % | Votes | ||
| 36.4% | 42,186 | |||
| 26.3% | 30,488 | |||
| Jerry Govan | 18.9% | 21,824 | ||
| Montrio Belton | 18.4% | 21,260 | ||
| Total Votes | 115,758 | |||
| Election results via South Carolina State Elections Commission. | ||||
Primary runoff results
| South Carolina Superintendent of Education, Republican Runoff, 2014 | ||||
|---|---|---|---|---|
| Candidate | Vote % | Votes | ||
| 57.2% | 76,672 | |||
| Sally Atwater | 42.8% | 57,452 | ||
| Total Votes | 134,124 | |||
| Election results via South Carolina State Elections Commission. | ||||
| South Carolina Superintendent of Education, Democratic Runoff, 2014 | ||||
|---|---|---|---|---|
| Candidate | Vote % | Votes | ||
| 59.1% | 23,541 | |||
| Sheila Gallagher | 40.9% | 16,269 | ||
| Total Votes | 39,810 | |||
| Election results via South Carolina State Elections Commission. | ||||
Agriculture Commissioner
| South Carolina Agriculture Commissioner, Republican Primary, 2014 | ||||
|---|---|---|---|---|
| Candidate | Vote % | Votes | ||
| 65.1% | 184,621 | |||
| Joe Farmer | 34.9% | 99,155 | ||
| Total Votes | 283,776 | |||
| Election results via South Carolina State Elections Commission. | ||||
Adjutant General
| South Carolina Adjutant General, Republican Primary, 2014 | ||||
|---|---|---|---|---|
| Candidate | Vote % | Votes | ||
| 75.8% | 209,561 | |||
| James Breazeale | 24.2% | 67,077 | ||
| Total Votes | 276,638 | |||
| Election results via South Carolina State Elections Commission. | ||||
General election results
The general election took place on November 4, 2014.
Governor
| Governor of South Carolina, 2014 | ||||
|---|---|---|---|---|
| Party | Candidate | Vote % | Votes | |
| Republican | 55.9% | 696,645 | ||
| Democratic | Vincent Sheheen | 41.4% | 516,166 | |
| Libertarian | Steve French | 1.2% | 15,438 | |
| Independent | Tom Ervin | 0.9% | 11,496 | |
| United Citizens | Morgan Reeves | 0.5% | 5,622 | |
| Nonpartisan | Write-in votes | 0.1% | 934 | |
| Total Votes | 1,246,301 | |||
| Election results via South Carolina State Election Commission | ||||
Lieutenant Governor
| Lieutenant Governor of South Carolina, 2014 | ||||
|---|---|---|---|---|
| Party | Candidate | Vote % | Votes | |
| Republican | 58.8% | 726,821 | ||
| Democratic | Bakari Sellers | 41.1% | 508,807 | |
| Nonpartisan | Write-in votes | 0.1% | 1,514 | |
| Total Votes | 1,237,142 | |||
| Election results via South Carolina State Election Commission | ||||
Attorney General
| Attorney General of South Carolina, 2014 | ||||
|---|---|---|---|---|
| Party | Candidate | Vote % | Votes | |
| Republican | 60.3% | 738,434 | ||
| Democratic | Parnell Diggs | 39.7% | 486,058 | |
| Nonpartisan | Write-in votes | 0.1% | 879 | |
| Total Votes | 1,225,371 | |||
| Election results via South Carolina State Election Commission | ||||
Secretary of State
| Secretary of State of South Carolina, 2014 | ||||
|---|---|---|---|---|
| Party | Candidate | Vote % | Votes | |
| Republican | 59.5% | 730,739 | ||
| Democratic | Ginny Deerin | 40.4% | 496,344 | |
| Nonpartisan | Write-in votes | 0.1% | 788 | |
| Total Votes | 1,227,871 | |||
| Election results via South Carolina State Election Commission | ||||
Treasurer
Curtis Loftis, Jr. was running for election without opposition.
Controller
| South Carolina Controller, 2014 | ||||
|---|---|---|---|---|
| Party | Candidate | Vote % | Votes | |
| Republican | 59.8% | 728,549 | ||
| Democratic | Kyle Herbert | 40.1% | 489,066 | |
| Nonpartisan | Write-in votes | 0.1% | 693 | |
| Total Votes | 1,218,308 | |||
| Election results via South Carolina State Election Commission | ||||
Superintendent of Public Instruction
| South Carolina Superintendent, 2014 | ||||
|---|---|---|---|---|
| Party | Candidate | Vote % | Votes | |
| Republican | 57% | 699,081 | ||
| Democratic | Tom Thompson | 38.8% | 476,358 | |
| American | Ed Murray | 3.8% | 46,695 | |
| Nonpartisan | Write-in votes | 0.4% | 5,055 | |
| Total Votes | 1,227,189 | |||
| Election results via South Carolina State Election Commission | ||||
Agriculture Commissioner
| South Carolina Agriculture Commissioner, 2014 | ||||
|---|---|---|---|---|
| Party | Candidate | Vote % | Votes | |
| Republican | 79.7% | 759,640 | ||
| United Citizen | David Edmond | 11.1% | 106,223 | |
| American | Emile DeFelice | 8.9% | 84,831 | |
| Nonpartisan | Write-in votes | 0.3% | 2,922 | |
| Total Votes | 953,616 | |||
| Election results via South Carolina State Election Commission | ||||
Adjutant General
Robert E. Livingston, Jr. won election without opposition.
Voter turnout
Political scientist Michael McDonald's United States Elections Project studied voter turnout in the 2014 election by looking at the percentage of eligible voters who headed to the polls. McDonald used voting-eligible population (VEP), or the number of eligible voters independent of their current registration status, to calculate turnout rates in each state on November 4. He also incorporated ballots cast for the highest office in each state into his calculation. He estimated that 81,687,059 ballots were cast in the 50 states plus the District of Columbia, representing 35.9 percent of the VEP.[7] By comparison, 61.6 percent of VEP voted in the 2008 presidential election and 58.2 percent of VEP voted in the 2012 presidential election.[8]
Quick facts
- According to PBS Newshour, voter turnout in the 2014 midterms was the lowest since the 1942 midterms, which took place during the nation's involvement in World War II.[9]
- Forty-three states and the District of Columbia failed to surpass 50 percent turnout in McDonald's analysis.
- The three states with the lowest turnout according to McDonald's analysis were Texas (28.3 percent), Tennessee (28.6 percent), and Indiana (28.8 percent).
- Maine (58.5 percent), Wisconsin (56.5 percent), and Colorado (54.5 percent) were the three states with the highest turnout.
- There were only 12 states that increased voter turnout in 2014 compared to the 2010 midterm elections.[10]
| Voter turnout rates, 2014 | |||||
|---|---|---|---|---|---|
| State | Total votes counted | % voter eligible population | Top statewide office up for election | Size of lead (Raw votes) | Size of lead (%) |
| Alabama | 1,191,274 | 33.2 | Governor | 320,319 | 27.2 |
| Alaska | 285,431 | 54.4 | Governor | 4,004 | 1.6 |
| Arizona | 1,537,671 | 34.1 | Governor | 143,951 | 12.5 |
| Arkansas | 852,642 | 40.1 | Governor | 118,664 | 14.0 |
| California | 7,513,972 | 30.8 | Governor | 1,065,748 | 17.8 |
| Colorado | 2,080,071 | 54.5 | Governor | 50,395 | 2.4 |
| Connecticut | 1,096,509 | 42.5 | Governor | 26,603 | 2.5 |
| Delaware | 234,038 | 34.4 | Attorney General | 31,155 | 13.6 |
| District of Columbia | 177,176 | 35.8 | Mayor | 27,934 | 19.0 |
| Florida | 6,026,802 | 43.3 | Governor | 66,127 | 1.1 |
| Georgia | 2,596,947 | 38.5 | Governor | 202,685 | 8.0 |
| Hawaii | 369,554 | 36.5 | Governor | 45,323 | 12.4 |
| Idaho | 445,307 | 39.6 | Governor | 65,852 | 14.9 |
| Illinois | 3,680,417 | 40.9 | Governor | 171,900 | 4.9 |
| Indiana | 1,387,622 | 28.8 | Secretary of State | 234,978 | 17.8 |
| Iowa | 1,142,284 | 50.2 | Governor | 245,548 | 21.8 |
| Kansas | 887,023 | 43.4 | Governor | 33,052 | 3.9 |
| Kentucky | 1,435,868 | 44.0 | U.S. Senate | 222,096 | 15.5 |
| Louisiana | 1,472,039 | 43.8 | U.S. Senate | 16,401 | 1.1 |
| Maine | 616,996 | 58.5 | Governor | 29,820 | 4.9 |
| Maryland | 1,733,177 | 41.5 | Governor | 88,648 | 6.1 |
| Massachusetts | 2,186,789 | 44.6 | Governor | 40,361 | 1.9 |
| Michigan | 3,188,956 | 43.2 | Governor | 129,547 | 4.3 |
| Minnesota | 1,992,613 | 50.5 | Governor | 109,776 | 5.6 |
| Mississippi | 631,858 | 28.9 | U.S. Senate | 141,234 | 33.0 |
| Missouri | 1,426,303 | 31.8 | Auditor | 684,074 | 53.6 |
| Montana | 373,831 | 47.3 | U.S. Senate | 65,262 | 17.9 |
| Nebraska | 552,115 | 41.5 | Governor | 97,678 | 18.7 |
| Nevada | 547,349 | 29.0 | Governor | 255,793 | 46.7 |
| New Hampshire | 495,565 | 48.4 | Governor | 24,924 | 5.2 |
| New Jersey | 1,955,042 | 32.5 | N/A | N/A | N/A |
| New Mexico | 512,805 | 35.7 | Governor | 73,868 | 14.6 |
| New York | 3,930,310 | 29.0 | Governor | 476,252 | 13.4 |
| North Carolina | 2,939,767 | 41.2 | U.S. Senate | 48,511 | 1.7 |
| North Dakota | 255,128 | 45.0 | U.S. House At-large seat | 42,214 | 17.1 |
| Ohio | 3,149,876 | 36.2 | Governor | 933,235 | 30.9 |
| Oklahoma | 824,831 | 29.8 | Governor | 122,060 | 14.7 |
| Oregon | 1,541,782 | 53.5 | Governor | 59,029 | 4.5 |
| Pennsylvania | 3,495,866 | 36.0 | Governor | 339,261 | 9.8 |
| Rhode Island | 329,212 | 42.2 | Governor | 14,346 | 4.5 |
| South Carolina | 1,261,611 | 35.2 | Governor | 179,089 | 14.6 |
| South Dakota | 282,291 | 44.9 | Governor | 124,865 | 45.1 |
| Tennessee | 1,374,065 | 28.6 | Governor | 642,214 | 47.5 |
| Texas | 4,727,208 | 28.3 | Governor | 957,973 | 20.4 |
| Utah | 577,973 | 30.2 | Attorney General | 173,819 | 35.2 |
| Vermont | 193,087 | 38.8 | Governor | 2,095 | 1.1 |
| Virginia | 2,194,346 | 36.6 | U.S. Senate | 16,727 | 0.8 |
| Washington | 2,123,901 | 43.1 | N/A | N/A | N/A |
| West Virginia | 451,498 | 31.2 | U.S. Senate | 124,667 | 27.6 |
| Wisconsin | 2,410,314 | 56.5 | Governor | 137,607 | 5.7 |
| Wyoming | 168,390 | 39.3 | Governor | 52,703 | 33.6 |
Note: Information from the United States Elections Project was last updated on December 16, 2014.
Key deadlines
| Deadline | Event |
|---|---|
| March 30, 2014 | Primary and convention filing deadline[11] |
| June 10, 2014 | Primary election |
| August 15, 2014 | Filing deadline for petition and nonpartisan candidates |
| November 4, 2014 | General election |
| January 14, 2015 | Inauguration for state executives |
State executive organization
Executive officials in South Carolina are part of a three-pronged government structure that includes state legislators and state judges.

Ballotpedia reports
To learn more about developments in these races, check out the following news articles from Ballotpedia:
- South Carolina primary runoff 2014 state executives preview
- An analysis of South Carolina's lieutenant governorship, 2014
- Filing deadline report: Busy primary season in South Carolina
Recent news
This section links to a Google news search for the term "South + Carolina + state + executive + elections"
See also
Footnotes
- ↑ NCSL,"State Primary Election Types," accessed October 25, 2019
- ↑ FairVote,"Primaries," accessed October 25, 2019
- ↑ Ballotpedia research conducted December 26, 2013, through January 3, 2014, researching and analyzing various state websites and codes.
- ↑ South Carolina Election Commission',"Nomination by Political Party," accessed October 25, 2019
- ↑ Washington Post, "South Carolina Gov. Haley launches re-election campaign (Video)," August 26, 2013
- ↑ ColaDaily.com "Pat McKinney withdraws from lieutenant governor race," June 12, 2014
- ↑ United States Elections Project, "2014 November General Election Turnout Rates," November 7, 2014
- ↑ TIME, "Voter Turnout in Midterm Elections Hits 72-Year Low," November 10, 2014
- ↑ PBS, "2014 midterm election turnout lowest in 70 years," November 10, 2014
- ↑ U.S. News & World Report, "Midterm Turnout Down in 2014," November 5, 2014
- ↑ Souith Carolina Election Commission, "2014 Election Calendar," January 8, 2014
| ||||||||||||||||

 |
State of South Carolina Columbia (capital) |
|---|---|
| Elections |
What's on my ballot? | Elections in 2024 | How to vote | How to run for office | Ballot measures |
| Government |
Who represents me? | U.S. President | U.S. Congress | Federal courts | State executives | State legislature | State and local courts | Counties | Cities | School districts | Public policy |