Energy policy in New Mexico, 2004-2017
This article does not contain the most recently published data on this subject. If you would like to help our coverage grow, consider donating to Ballotpedia.
Energy policy involves governmental actions affecting the production, distribution, and consumption of energy in a state. Energy policies are enacted and enforced at the local, state, and federal levels and may change over time. These policies include legislation, regulation, taxes, incentives for energy production or use, standards for energy efficiency, and more. Stakeholders include citizens, politicians, environmental groups, industry groups, and think tanks. A variety of factors can affect the feasibility of federal and state-level energy policies, such as available natural resources, geography, and consumer needs.
This article outlines state-level oil and gas regulations, renewable energy programs, oil and gas production, energy usage, energy and electricity prices, fuel taxes, and utilities in New Mexico.
See the tabs below for further information:
- Policy: This tab provides information about state regulations on energy production and policies related to oil and gas production, fracking, renewable energy generation, energy efficiency, and net metering.
- Production: This tab provides information about total energy production by energy source in New Mexico.
- Usage: This tab presents information about electricity consumption by energy source.
- Prices and taxes: This tab presents information about average energy and electricity prices, per capita spending on energy, and fuel taxes.
- Utilities: This tab presents information about public and private utilities, electricity markets, the types of utilities in New Mexico, and the electric reliability organizations in New Mexico.
- Background: This tab provides information about the types of nonrenewable and renewable energy sources produced and used in the United States, an energy profile of New Mexico, a state profile of New Mexico from the Almanac of American Politics (2016), and economic indicators in the state, such as median income.
Policy
State regulations
The New Mexico Oil Conservation Division has regulatory authority over oil and natural gas operations in the state. State rules and regulations cover the drilling of all wells used for oil or gas exploration, the spacing of wells, permitting requirements for oil and gas operators, injection wells used to enhance oil and gas recovery or to dispose of wastewater, the cementing and plugging of wells, the underground storage of natural gas, the prevention of well blowout and leaks, well restoration, reporting requirements, land remediation, and more. All New Mexico rules and regulations related to oil and gas operations are found in Title 19, Chapter 15 of the New Mexico Administrative Code.[1][2]
Fracking
- See also: Fracking in New Mexico
The Oil Conservation Division is responsible for regulating hydraulic fracturing (also known as fracking) in New Mexico. Operators who intended to use fracking must file a hydraulic fracturing disclosure form to the state government within 45 after a well is completed. In addition, the division enforces regulations for the reporting and disclosure of the types of fluids used in fracking and at what volume, a description of each chemical additive used in fracking, the maximum amount of surface and injecting pressure used during the process, well safety, and other information considered necessary by the division for the regulation of fracking. More detailed information on oil and gas rules and regulations can be found in Title 19, Chapter 15 of the New Mexico Administrative Code.[2]
Renewable energy policies
States have implemented funding and financial incentive programs to subsidize or otherwise increase investment in renewable energy resources such as wind, solar, and hydroelectric power. These programs include renewable portfolio standards, grants, rebate programs, tax incentives, loans, performance-based incentives, and more. The aim of the policies generally involves reducing the cost of renewable energy production for consumers, reducing regulatory compliance costs, reducing investment risks involving renewable energy, and/or increasing the adoption of renewable energy sources by individuals and businesses.[3]
Renewable Portfolio Standard
- See also: Renewable Portfolio Standard
A Renewable Portfolio Standard (RPS), also known as a renewable electricity standard, is a mandate intended to increase the amount of renewable energy production and use. Under these standards, a utility company can be required by a state to have a certain percentage of its electricity come from certain renewable energy resources. In addition, states may give tax credits to utility companies to fulfill these requirements.[4][5]
As of February 2017, New Mexico was one of 30 states with a Renewable Portfolio Standard. In 2004, the New Mexico State Legislature enacted the Renewable Energy Act establishing a statewide renewable portfolio standard. All investor-owned utilities in the state must generate 20 percent of their total retail electric sales from eligible renewable energy sources by the year 2020. In addition, rural electric cooperatives must generate 10 percent of their total retail sales from eligible sources by the year 2020. Eligible renewable sources include solar energy, wind energy, geothermal energy, hydroelectric power facilities established after July 1, 2007, and biomass resources.[6][7]
Grant programs
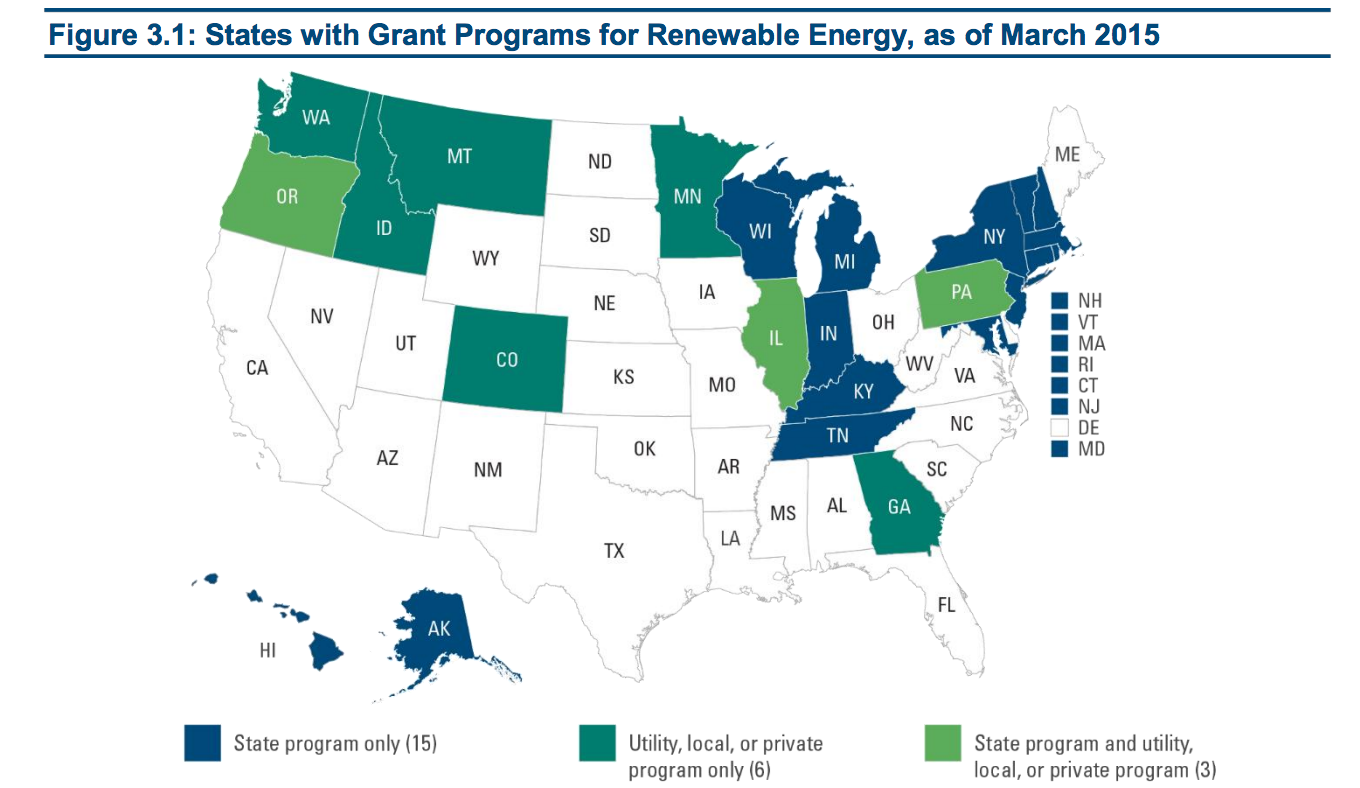
States, nonprofit organizations, and/or private utilities may operate grant programs for renewable energy. These programs may include state or private funding for energy installation costs, research and development, infrastructure and business development, system testing, and renewable energy feasibility studies (studies that look into the potential for renewable energy use in specific areas). Grants can be provided with or without requiring a recipient to match the grant. Additional incentives, such as lower interest loans, may be included with a grant.[3]
As of March 2015, New Mexico was one of 26 states that did not have state-run, utility-run, or locally run grant programs for renewable energy. See the map below for grant programs by state.[3]
Loan programs
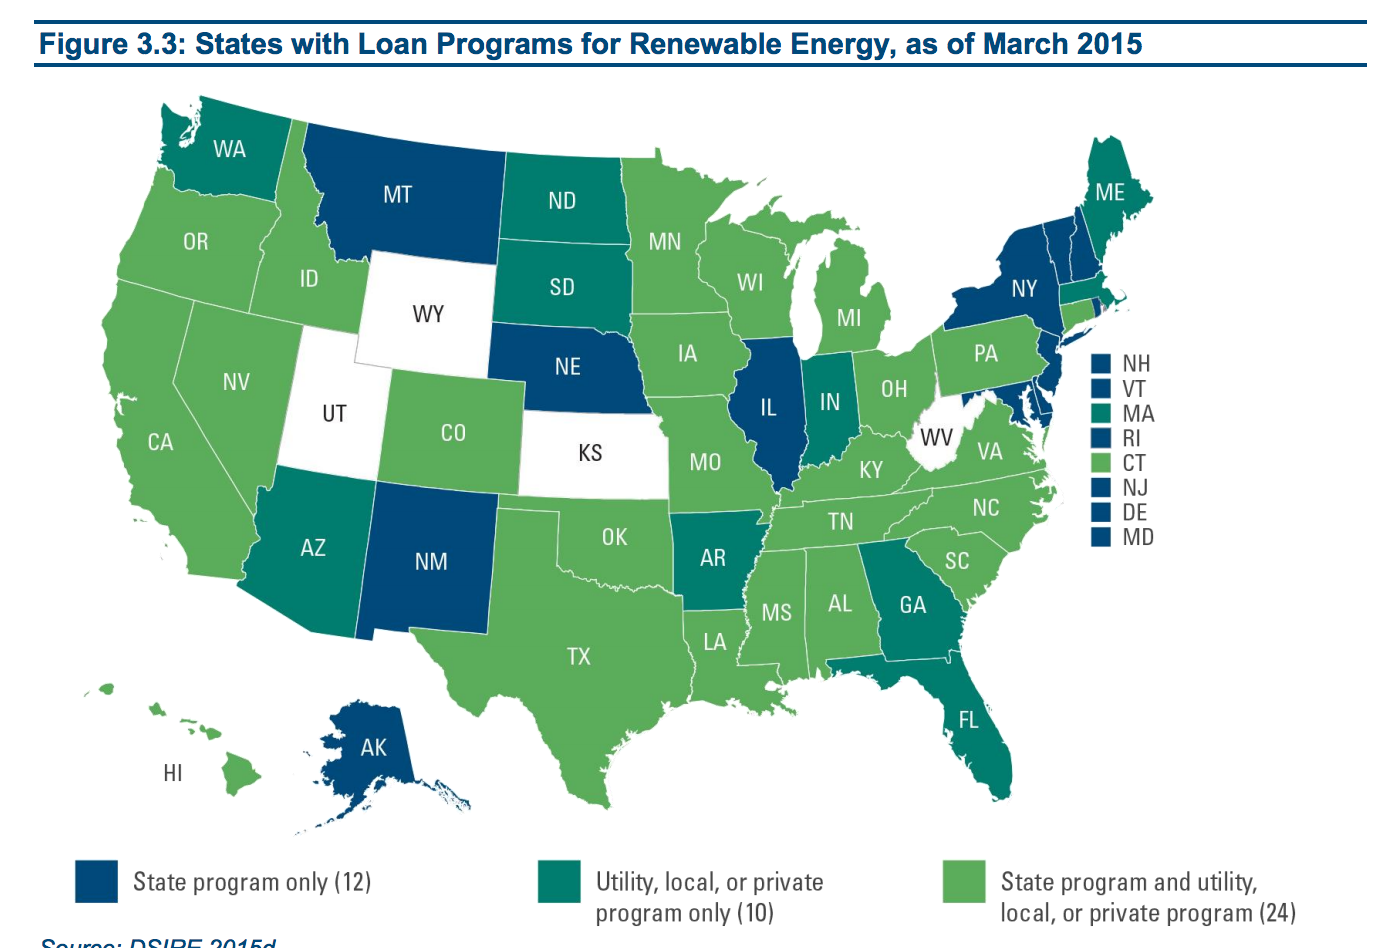
Loan programs may be used to offer lower interest loans or other financing options to individuals and businesses to reduce the upfront costs of purchasing and installing renewable energy technologies. Loan programs may include programs that use payments from earlier borrowers to provide loans for new borrowers, programs in which building owners reduce their energy consumption to pay their upfront costs for renewable energy technologies, and programs that allow individuals with a higher debt-to-income ratio to purchase homes that use less energy, among others.[3]
As of March 2015, New Mexico was one of 36 states with a state-run loan program for renewable energy technologies. The New Mexico Energy Conservation and Management Division operates a Property Assessed Clean Energy (PACE) financing program, which allows local governments to issue bonds to raise funds for renewable energy projects. Individual homeowners who participate in the program install renewable energy technologies on their property and pay an assessment on their property tax bill. This assessment is repaid over certain periods of time depending on the agreements made with the local government. More information about the program can be accessed here.[3][8]
A complete list of state, local, and private incentive, loan, grant, and assistance programs for renewable energy and energy efficiency in New Mexico can be found here.
See the map below for renewable energy loan programs by state.
Energy efficiency regulations
As of February 2017, New Mexico required all new residential and commercial buildings to meet energy efficiency standards. All residential and commercial buildings must meet energy efficiency standards for heating, ventilating, air conditioning, water heating, and lighting found in the 2009 International Energy Conservation Code.[6][9]
Net metering
Net metering is a billing system in which customers who generate their own electricity, usually using renewable sources (such as solar panels) are able to sell their excess electricity back to the electric grid, which is an interconnected network that is used to deliver electricity. This requires electricity to be able to flow both to and from a consumer.[10][11][12]
As of October 2016, New Mexico was one of 41 states with a statewide net metering policy. All utilities under the jurisdiction of the New Mexico Public Regulation Commission must offer net metering to customers. Customers with renewable energy systems with a capacity of 80 megawatts (MW) or less are eligible for net metering. Eligible renewable sources include geothermal energy, photovoltaic solar energy, biomass, hydroelectric power, landfill methane gas, wind energy, and fuel cells powered by any of the above technologies. For a complete list of net metering programs by state, click here.[6][13][14]
Recent legislation
The following is a list of recent energy policy bills that have been introduced in or passed by the New Mexico State Legislature. To learn more about each of these bills, click the bill title. This information is provided by BillTrack50 and LegiScan.
Note: Due to the nature of the sorting process used to generate this list, some results may not be relevant to the topic. If no bills are displayed below, no legislation pertaining to this topic has been introduced in the legislature recently.
Ballot measures
Energy policy ballot measures
- See also: Energy on the ballot and List of New Mexico ballot measures
Ballotpedia has not covered any ballot measures relating to state and local energy policy in New Mexico.
Utility policy ballot measures
- See also: Local utility tax and fees on the ballot
Ballotpedia has not covered any ballot measures relating to local utility tax and fees in New Mexico.
Production
The sections below include statistics on total energy production in New Mexico, oil and natural gas production in New Mexico, oil and gas production in New Mexico over time (2004-2014), and oil and gas production on federal land, including the amount of federal land leased in New Mexico for production.
Total energy production
The table below provides information regarding energy production in New Mexico in British thermal units (Btu). A British thermal unit is used to measure the heat contained in different fuels. The U.S. Department of Energy defines a Btu as "the quantity of heat required to raise the temperature of 1 pound of liquid water by 1 degree Fahrenheit." Fuels are discussed in terms of Btu to compare fuels with different energy content and prices. For example, one gallon of gasoline equals 120,524 Btu.[15]
| Energy production, 2014 (in billion Btu) | ||||||||
|---|---|---|---|---|---|---|---|---|
| State | Biomass | Coal | Crude oil | Nuclear energy | Natural gas | Renewable | Total* | |
| New Mexico | 3,267 | 400,158 | 717,379 | 0 | 1,355,013 | 42,194 | 2,518,011 | |
| Arizona | 5,939 | 173,337 | 325 | 338,044 | 109 | 123,235 | 640,989 | |
| Colorado | 17,818 | 528,242 | 552,114 | 0 | 1,834,169 | 127,109 | 3,059,452 | |
| Texas | 43,833 | 576,803 | 6,702,967 | 410,907 | 9,379,513 | 526,915 | 17,640,938 | |
| U.S. average | 38,759 | 404,181 | 307,301 | 160,980 | 585,731 | 187,132 | 1,684,085 | |
| *Total figures were computed by Ballotpedia. Source: U.S. Energy Information Administration, "Google Sheets API" | ||||||||
Nonrenewable energy production
The table below provides information regarding nonrenewable energy production in New Mexico. For coal data, the phrase productive capacity refers to the maximum amount of coal that could be expected to be produced in 2014. The natural gas and crude oil production data refer to the amounts of natural gas and crude oil produced in December 2014 and April 2016, respectively.[16][17]
| Nonrenewable energy production | |||
|---|---|---|---|
| State | Coal, productive capacity (short tons) |
Natural gas (million cubic feet) |
Crude oil (thousand barrels) |
| Date | 2014 | December 2014 | April 2016 |
| New Mexico | 27,400,000 | 93,134 | 12,337 |
| Arizona | 8,500,000 | 12 | 0 |
| Colorado | 29,841,775 | 130,204 | 9,496 |
| Texas | 45,823,585 | 653,385 | 96,908 |
| U.S. average | 24,874,314 | 43,350 | 4,388 |
| Source: U.S. Energy Information Administration, "Google Sheets API" | |||
Oil and gas production (2004-2014)
Note: This section provides information about oil and gas production on private and state-owned lands. Information on oil and gas production on federal lands is accessible here.
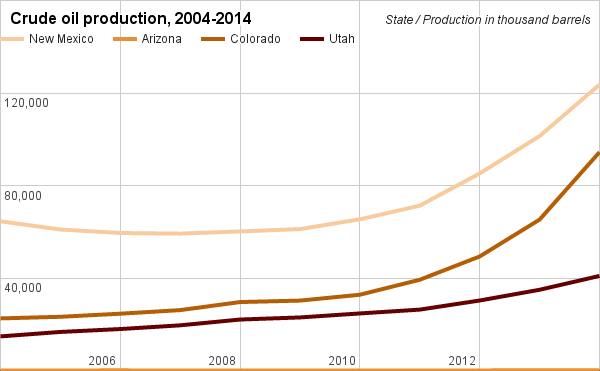
The graph and table below provide information about crude oil production in New Mexico. Information from select surrounding states is provided for comparative purposes.[18]
| Crude oil production in New Mexico and select surrounding states, in thousand barrels | |||||||||||||
|---|---|---|---|---|---|---|---|---|---|---|---|---|---|
| State | 2004 | 2005 | 2006 | 2007 | 2008 | 2009 | 2010 | 2011 | 2012 | 2013 | 2014 | Percent of total 2014 production | 2014 Rank |
| New Mexico | 64,517 | 60,964 | 59,454 | 59,180 | 60,143 | 61,143 | 65,377 | 71,286 | 85,218 | 101,373 | 123,623 | 3.89% | 6 |
| Arizona | 54 | 50 | 55 | 43 | 52 | 46 | 40 | 37 | 52 | 60 | 56 | 0.0% | 30 |
| Colorado | 22,532 | 23,226 | 24,562 | 26,116 | 29,594 | 30,227 | 32,765 | 39,243 | 49,310 | 65,257 | 94,414 | 2.97% | 7 |
| Utah | 14,744 | 16,673 | 17,927 | 19,535 | 22,041 | 22,943 | 24,674 | 26,331 | 30,268 | 34,912 | 40,893 | 1.29% | 11 |
| United States | 1,991,394 | 1,891,227 | 1,857,044 | 1,853,166 | 1,830,002 | 1,952,670 | 2,000,861 | 2,060,398 | 2,377,806 | 2,722,171 | 3,180,813 | -- | -- |
| Source: U.S. Energy Information Administration, "Crude Oil Production" Note: The data above are field production data. | |||||||||||||
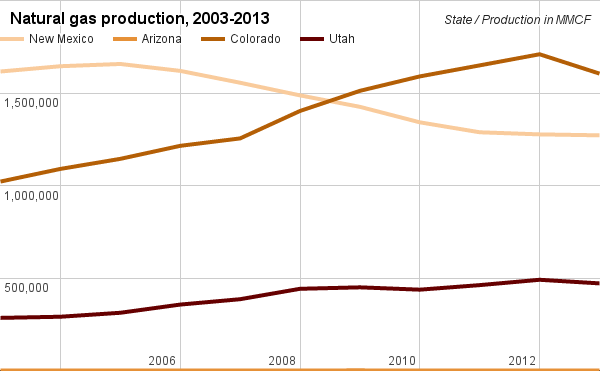
The graph and table below provide information about natural gas production in New Mexico. Information from select surrounding states is provided for comparative purposes.[19]
| Natural gas production in New Mexico and select surrounding states, in million cubic feet (MMCF) | |||||||||||||
|---|---|---|---|---|---|---|---|---|---|---|---|---|---|
| State | 2003 | 2004 | 2005 | 2006 | 2007 | 2008 | 2009 | 2010 | 2011 | 2012 | 2013 | Percent of total 2013 production | 2013 rank |
| New Mexico | 1,616,179 | 1,644,738 | 1,656,850 | 1,619,528 | 1,555,450 | 1,487,123 | 1,425,222 | 1,341,475 | 1,287,682 | 1,276,296 | 1,271,185 | 4.24% | 8 |
| Arizona | 443 | 331 | 233 | 611 | 655 | 523 | 712 | 183 | 168 | 117 | 72 | 0.0% | 30 |
| Colorado | 1,021,294 | 1,089,622 | 1,143,985 | 1,214,396 | 1,254,529 | 1,402,845 | 1,511,654 | 1,589,664 | 1,649,306 | 1,709,376 | 1,604,860 | 5.35% | 7 |
| Utah | 284,359 | 290,586 | 311,994 | 356,321 | 385,361 | 441,598 | 449,511 | 436,885 | 461,507 | 490,393 | 470,863 | 1.57% | 11 |
| United States | 24,118,978 | 23,969,678 | 23,456,822 | 23,535,018 | 24,663,656 | 25,636,257 | 26,056,893 | 26,816,085 | 28,479,026 | 29,542,313 | 30,005,254 | -- | -- |
| Source: U.S. Energy Information Administration, "Natural Gas Gross Withdrawals and Production" The data presented above are gross withdrawals in million cubic feet (MMCF). Production data for 2014 were estimated for some, but not all, states; "--" indicates data were not available. | |||||||||||||
Oil and gas production on federal land
The federal government leases federally managed land to private individuals and companies for energy development, including crude oil and natural gas drilling, solar energy development, and geothermal energy development. Approximately 166 million acres of federal land were available to be leased for energy development as of December 2014. The U.S. Bureau of Land Management (BLM) is responsible for regulating oil and gas drilling on federal lands in the United States.[20][21]
The table below provides information about oil and natural gas production on federal lands in New Mexico in 2014. Information from select surrounding states is provided for comparison.[22][23]
| Oil and natural gas production on federal land, 2014 | ||
|---|---|---|
| State | Oil production (in thousands of barrels) | Natural gas production (in million cubic feet) |
| New Mexico | 57,992 | 646,876 |
| Arizona | 0 | 0 |
| Colorado | 4,780 | 339,478 |
| Texas | 273 | 38,250 |
| U.S. average | 2,976.06 | 49,996.92 |
| Source: Office of Natural Resource Revenue, "Statistical Information" | ||
Land leased
Private oil and natural gas companies apply for leases from the U.S. Bureau of Land Management (BLM) to develop energy resources on federal lands. After a lease is approved, the company must submit information to the BLM about how it will conduct its drilling and production operations. The BLM also inspects a company’s operations during production.[24]
The table below provides information about oil and gas producing leases and acres on federal lands in New Mexico from 2013 to 2015. Information from select surrounding states is provided for comparison.
| Oil and gas producing leases and acres on federal land by state, 2013-2015 | ||||||
|---|---|---|---|---|---|---|
| State | FY 2015 | FY 2014 | FY 2013 | |||
| Producing leases | Producing acres | Producing leases | Producing acres | Producing leases | Producing acres | |
| New Mexico | 6,579 | 3,751,887 | 6,556 | 3,727,864 | 6,535 | 3,697,459 |
| Arizona | 0 | 0 | 0 | 0 | 0 | 0 |
| Colorado | 2,192 | 1,483,943 | 2,179 | 1,478,105 | 2,180 | 1,474,922 |
| Texas | 278 | 166,227 | 272 | 162,102 | 253 | 156,590 |
| U.S. average | 485 | 257,505 | 483 | 258,996 | 480 | 262,870 |
| Source: U.S. Bureau of Land Management, "Oil and Gas Statistics" | ||||||
Energy usage
The section below includes statistics on electricity consumption in the state by energy type (in 2014).
Consumption
The table below provides information about energy consumption by source in New Mexico in 2014. Information from select surrounding states is provided for comparison.[16]
| Energy consumption in New Mexico, 2014 (in billion Btu) | ||||||||||
|---|---|---|---|---|---|---|---|---|---|---|
| State | Coal | Crude oil and petroleum products | Natural gas | Nuclear energy | Solar | Wind | Geothermal | Hydropower | Wood and wood waste | Biomass |
| New Mexico | 215,348 | 246,508 | 256,085 | 0 | 6,595 | 21,633 | 451 | 936 | 9,313 | 17,189 |
| Arizona | 447,849 | 515,002 | 315,448 | 338,044 | 46,869 | 4,452 | 345 | 58,185 | 7,445 | 31,481 |
| Colorado | 350,526 | 483,029 | 499,668 | 0 | 7,582 | 70,076 | 759 | 16,831 | 14,044 | 36,073 |
| Texas | 1,585,961 | 6,054,161 | 4,219,128 | 410,907 | 5,550 | 380,449 | 2,478 | 3,670 | 90,934 | 214,603 |
| U.S. average | 359,931 | 716,746 | 544,353 | 172,585 | 20,739 | 531,323 | 16,555 | 61,397 | 65,345 | 101,581 |
| Source: U.S. Energy Information Administration, "Google Sheets API" | ||||||||||
Prices and taxes
The sections below include information on energy prices and spending in New Mexico, fuel taxes and state taxes in New Mexico and in neighboring states, and an overview of the federal tax on gasoline.
Energy prices
The price of electricity is affected by supply and demand. The supply of electricity is affected by fuel prices, environmental and energy regulations, power plant capacity, weather, and other factors. Demand for electricity also affects the price. Because electricity cannot be stored for long periods of time, it must be produced and used when it is needed. As demand for electricity increases, the price also generally increases.[25][26]
The table below provides information about energy prices in New Mexico as of April 2016. Information from select surrounding states is provided for comparison.[16]
| Energy prices in New Mexico | ||
|---|---|---|
| State | Natural gas Dollars per thousand cubic foot |
Electricity Cents per kilowatthour |
| Date | April 2016 | April 2016 |
| New Mexico | $7.44 | 8.4 |
| Arizona | $16.53 | 9.9 |
| Colorado | $6.82 | 9.4 |
| Texas | $11.66 | 7.7 |
| U.S. average | $11.20 | 10.41 |
| Source: U.S. Energy Information Administration, "Google Sheets API" | ||
Electricity prices can vary depending on the type of consumer; consumer categories include residential, commercial, industrial, and in some cases, transportation. The rate-making process is both political and economic. The table below presents information about electricity prices by consumer type in New Mexico in April 2016. Information from select surrounding states is provided for comparison.
| Electricity prices in New Mexico by sector (in cents per kilowatthour) | |||||
|---|---|---|---|---|---|
| State | Commercial | Industrial | Residential | Transportation | Average (all sectors) |
| Date | April 2016 | April 2016 | April 2016 | April 2016 | April 2016 |
| New Mexico | 9.0 | 5.6 | 11.3 | --* | 8.6 |
| Arizona | 10.1 | 5.6 | 12.4 | 9.4 | 9.4 |
| Colorado | 9.5 | 6.9 | 11.8 | 10.1 | 9.6 |
| Texas | 7.4 | 4.8 | 11.3 | 5.3 | 7.2 |
| U.S. average | 10.48 | 7.45 | 13.05 | 10.47 | 10.36 |
| Source: U.S. Energy Information Administration, "Google Sheets API" | |||||
Energy spending
The table below provides information about energy spending in New Mexico as of 2014. Information from select surrounding states is provided for comparison.
| Energy spending in New Mexico, 2014 (in millions of dollar except per capita spending) | |||||
|---|---|---|---|---|---|
| State | Petroleum | Coal | Natural gas | Nuclear | Per capita spending |
| New Mexico | $6,171 | $812 | $975 | $0 | $4,325 |
| Arizona | $13,753 | $945 | $2,156 | $277 | $3,360 |
| Colorado | $12,388 | $684 | $2,686 | $0 | $3,733 |
| Texas | $117,944 | $3,214 | $16,884 | $298 | $6,025 |
| U.S. average | $17,267 | $1,322 | $3,786 | $574 | $5,304 |
| Source: U.S. Energy Information Administration, "Google Sheets API" | |||||
Fuel taxes

Revenue collected by federal, state, and local governments from fuel taxes is usually used to fund transportation infrastructure such as roads and bridges. Some states may charge an excise tax based on how much gas or diesel is purchased. Some states may charge retail tax based on the average price of gas over a certain period. Additionally, some states may charge an environmental tax to be used for environmental projects. The Tax Foundation, which created the map to the right, used data from the American Petroleum Institute, which converted each state's different tax structure into cents per gallon to compare each state's gas taxes. In 2016, gas taxes accounted for 23 percent of the price of gasoline. Crude oil accounted for 40 percent of the price of gasoline, refining accounted for 24 percent of the price, and distribution and marketing accounted for 13 percent of the remainder.[27][28]
The table below provides information about state fuel taxes by type (excluding the federal gas taxes) in New Mexico as of January 2016. As of January 2016, New Mexico levied a 18.9 cent state gasoline tax and a 22.9 cent state diesel tax. New Mexico ranked 44th highest in total gasoline taxes (federal and state) and 37th highest in total diesel fuel taxes as of January 2016.[29][30]
| State motor fuel taxes in cents per gallon, January 2016 | ||||||
|---|---|---|---|---|---|---|
| State | State gasoline tax | Total gasoline tax | Rank | State diesel tax | Total diesel tax | Rank |
| New Mexico | 18.9 | 37.3 | 44 | 22.9 | 47.3 | 37 |
| Arizona | 19.0 | 37.4 | 43 | 27.0 | 51.4 | 29 |
| Colorado | 22.0 | 40.4 | 37 | 20.5 | 44.9 | 41 |
| Texas | 20.0 | 38.4 | 42 | 20.0 | 44.4 | 43 |
| U.S. average | 30.29 | 48.69 | N/A | 30.01 | 54.41 | N/A |
| Source: American Petroleum Institute, "Motor Fuel Taxes" | ||||||
Federal tax
The first federal tax on gasoline was proposed by Secretary of the Treasury Ogden L. Mills under President Herbert Hoover (R) as a revenue generating measure to balance the budget during the Great Depression. A 1-cent tax per gallon of imported gasoline and fuel oil was passed as part of the Revenue Act of 1932 and signed by President Franklin D. Roosevelt (D). The 1-cent tax continued until 1951 when the tax was increased to 2 cents in part to raise revenue during the Korean War. In 1956, the tax was raised to 3 cents to fund the Interstate Highway System. During this time, the Highway Trust Fund was created as a means to fund highway construction. Since 1956, there have been increases to the tax. As of April 2016, the gas tax was last raised by President Bill Clinton (D) in 1993 to 18.4 cents per gallon.[31]
Utilities
The sections below include general information on utilities, an overview of utilities and electricity markets, information on the types of utilities in New Mexico, an overview of electricity reliability organizations (EROs), and the EROs that oversee electricity in New Mexico.
Background
Utilities are firms that own and/or operate facilities to generate, transmit, and/or distribute electricity, gas, and/or water to the public. Electric utilities are commercial entities that own and operate facilities to generate, transmit, and distribute electricity to the public and/or the industrial sector. State and local regulators oversee transmission and distribution charges. Local utilities read electric meters and bill individuals or businesses, generally on a monthly basis.[32][33]
Utilities are defined differently in each state and in federal legislation. Two general types of utilities are private and public utilities. Private utilities, commonly known as investor-owned utilities, provide stocks to investors and sell bonds. These utilities are regulated by state regulatory agencies. State agencies are also responsible for setting retail rates charged by investor-owned utilities, overseeing utility infrastructure, and ensuring that investor-owned utilities respond to customer service demands. Public utilities include government or municipally owned utilities. Another type of utility is an electric cooperative. Cooperatives are nonprofit businesses voluntarily owned and managed by the individuals and businesses that use their services. They are commonly used in rural areas that do not have access to a larger state or region-wide electric grid.[33]
Electricity markets
Electricity markets in each state are defined as regulated or deregulated. A regulated market includes utilities that own and manage the power plants that generate the electricity, the electricity transmission lines, and the distribution equipment (such as wires and electric poles). In addition, the utilities rates are approved and regulated by local and state agencies. A deregulated market requires utilities to divest ownership in the generation and transmission of electricity. In this market, utilities oversee the interconnection from a meter at a household or business to the power grid and is responsible for billing ratepayers.[34][35]
Depending on the state and/or area, public utilities may provide most or all energy services to homes and businesses, or a state may allow other private electricity providers to transmit and distribute electricity in addition to other utilities. For example, one type of private provider is a retail energy provider, which sells electricity in areas with retail competition. The provider purchases wholesale electricity and the delivery services (such as transmission lines) and can price electricity to particular consumers.[34][35]
As of February 2017, New Mexico was one of 40 states with a regulated electricity market. The New Mexico Public Regulation Commission is responsible for regulating and setting electric rates for all investor-owned electric utilities and electric cooperatives in the state. As of February 2017, New Mexico had three investor-owned utilities—El Paso Electric, the Public Service Company of New Mexico, and Xcel Energy—and 21 electric cooperatives.[36][37][38]
Electric reliability organizations
The Energy Policy Act of 2005 required the Federal Energy Regulatory Commission (FERC) to designate an electric reliability organization (ERO) for the United States. An ERO oversees the reliability of a nation's electric grid. In 2006, FERC granted authority to the North American Electric Reliability Corporation (NERC) to develop and enforce grid reliability standards for the United States. NERC, a self-regulated nonprofit corporation, is authorized to enforce grid reliability standards for all users, owners, and operators of the U.S. electrical system.[39]
NERC works with eight regional reliability organizations to oversee the U.S. electrical system. These organizations, known as regional entities, are composed of officials from investor-owned utilities, federal power agencies, electric cooperatives, and state and municipal utilities. Regional entities enforce NERC and regional reliability standards. Further, they forecast electricity demand and coordinate operations with other regional entities.[40]
New Mexico EROs
As of February 2017, the Western Electricity Coordinating Council (WECC) was the NERC-affiliated corporation that oversees electricity in New Mexico. The WECC conducts studies and assessments of the electricity grid, conducts long-term planning, and develops regional standards for electricity reliability.[41]
Background
The sections below include an overview of the types of renewable and nonrenewable energy produced and consumed in the United States, an energy profile of New Mexico (from the U.S. Energy Information Administration), a general profile of New Mexico (from the 2016 edition of the Almanac of American Politics), and various economic indicators in New Mexico.
Background on energy resources
Nonrenewable energy sources, such as coal, oil, and natural gas (sometimes known as fossil fuels), and renewable sources, such as hydropower, wind, biofuels, and solar energy, are produced in each state, though at different levels depending on a state's geography, energy consumption, and the raw materials available in a particular state. For example, several states do not have coal, oil, and/or natural gas resources. States that lack these resources import these fuels.[42]
According to the U.S. Department of Energy, oil, coal, and natural gas comprise the majority of the resources used to generate power in the United States. In 2014, the top five energy-producing states were the top five fossil fuel-producing states—Texas, Wyoming, Pennsylvania, Louisiana, and West Virginia. These states' fossil fuel production accounted for approximately 42 percent of U.S. energy production in 2014. States with fewer coal, oil, and natural gas resources generally consume less energy. In 2014, the bottom five energy-producing states—Rhode Island, Delaware, Hawaii, Nevada, and New Hampshire—produced 0.2 percent of U.S. energy and consumed approximately 2 percent of total U.S. energy.[42]
The production of biofuels (liquid fuels created from plant or plant-derived materials) is generally concentrated in the Midwest—states such as Illinois, Iowa, Nebraska, and South Dakota) given the region's agricultural production of crops such as corn, which is used to make ethanol, a biofuel that can be blended with gasoline and used as a transportation fuel.[42]
Other renewable sources are used to generate power in the states include hydroelectric power, which accounted for about half of all renewable energy production in the United States in 2014.[42]
New Mexico energy profile
As of 2014, New Mexico was seventh-largest net supplier of energy given its petroleum, natural gas, and coal production. From 2009 to 2016, petroleum production and the number of proved oil reserves in New Mexico doubled. As of 2015, New Mexico was the largest petroleum producer of the eight states surrounding the Rocky Mountains and accounted for approximately 4 percent of total U.S. crude oil production.[16]
In 2014, New Mexico was in the top 10 natural gas producing states and accounted for approximately 4 percent of total U.S. natural gas production. As of 2015, the state had natural gas wells, shale gas wells, and coalbed methane wells. The state was also a natural gas exporter as of 2015. Interstate pipelines deliver natural gas from New Mexico to Arizona and states along the West Coast. As of 2015, New Mexico had two underground storage fields for natural gas; these fields had a combined capacity of 89 billion cubic feet of natural gas, which represented about 1 percent of total U.S. natural gas storage capacity.[16]
As of 2015, coal-fired power plants accounted for more than 60 percent of New Mexico's net electricity generation followed by natural gas-fired plants. The remainder of the state's electricity came from renewable energy sources, primarily wind energy. Around 6 percent of the state's electricity generation as of 2015 came from approximately 700 operating wind turbines.[16]
State profile
| Demographic data for New Mexico | ||
|---|---|---|
| New Mexico | U.S. | |
| Total population: | 2,080,328 | 316,515,021 |
| Land area (sq mi): | 121,298 | 3,531,905 |
| Race and ethnicity** | ||
| White: | 73.2% | 73.6% |
| Black/African American: | 2.1% | 12.6% |
| Asian: | 1.4% | 5.1% |
| Native American: | 9.1% | 0.8% |
| Pacific Islander: | 0.1% | 0.2% |
| Two or more: | 3.3% | 3% |
| Hispanic/Latino: | 47.4% | 17.1% |
| Education | ||
| High school graduation rate: | 84.2% | 86.7% |
| College graduation rate: | 26.3% | 29.8% |
| Income | ||
| Median household income: | $44,963 | $53,889 |
| Persons below poverty level: | 24.7% | 11.3% |
| Source: U.S. Census Bureau, "American Community Survey" (5-year estimates 2010-2015) Click here for more information on the 2020 census and here for more on its impact on the redistricting process in New Mexico. **Note: Percentages for race and ethnicity may add up to more than 100 percent because respondents may report more than one race and the Hispanic/Latino ethnicity may be selected in conjunction with any race. Read more about race and ethnicity in the census here. | ||
Presidential voting pattern
- See also: Presidential voting trends in New Mexico
New Mexico voted for the Democratic candidate in five out of the six presidential elections between 2000 and 2020.
Pivot Counties (2016)
Ballotpedia identified 206 counties that voted for Donald Trump (R) in 2016 after voting for Barack Obama (D) in 2008 and 2012. Collectively, Trump won these Pivot Counties by more than 580,000 votes. Of these 206 counties, three are located in New Mexico, accounting for 1.46 percent of the total pivot counties.[43]
Pivot Counties (2020)
In 2020, Ballotpedia re-examined the 206 Pivot Counties to view their voting patterns following that year's presidential election. Ballotpedia defined those won by Trump won as Retained Pivot Counties and those won by Joe Biden (D) as Boomerang Pivot Counties. Nationwide, there were 181 Retained Pivot Counties and 25 Boomerang Pivot Counties. New Mexico had three Retained Pivot Counties, 1.66 percent of all Retained Pivot Counties.
More New Mexico coverage on Ballotpedia
- Elections in New Mexico
- United States congressional delegations from New Mexico
- Public policy in New Mexico
- Influencers in New Mexico
- New Mexico fact checks
- More...
Economic indicators
- See also: Economic indicators by state
Broadly defined, a healthy economy is typically one that has a "stable and strong rate of economic growth" (gross state product, in this case) and low unemployment, among many other factors. The economic health of a state can significantly affect its healthcare costs, insurance coverage, access to care, and citizens' physical and mental health. For instance, during economic downturns, employers may reduce insurance coverage for employees, while those who are laid off may lose coverage altogether. Individuals also tend to spend less on non-urgent care or postpone visits to the doctor when times are hard. These changes in turn may affect the decisions made by policymakers as they react to shifts in the industry. Additionally, a person's socioeconomic status has profound effects on their access to care and the quality of care received.[44][45][46]
In 2013, New Mexico had the largest portion of residents that earned incomes below 100 percent of the federal poverty level compared to neighboring states and had the lowest median annual household income, $44,472. Its unemployment rate in September 2014 was 6.6 percent—0.7 percentage points above the national rate of 5.9 percent.[47][48][49][50]
Note: Gross state product (GSP) on its own is not necessarily an indicator of economic health; GSP may also be influenced by state population size. Many factors must be looked at together to assess state economic health.
| Various economic indicators by state | ||||||||
|---|---|---|---|---|---|---|---|---|
| State | Distribution of population by FPL* (2013) | Median annual income (2011-2013) | Unemployment rate | Total GSP (2013)† | ||||
| Under 100% | 100-199% | 200-399% | 400%+ | Sept. 2013 | Sept. 2014 | |||
| New Mexico | 22% | 20% | 28% | 30% | $44,472 | 6.9% | 6.6% | $92,245 |
| Arizona | 20% | 23% | 25% | 31% | $49,698 | 8% | 6.9% | $279,024 |
| Colorado | 11% | 17% | 29% | 44% | $61,634 | 6.6% | 4.7% | $294,443 |
| Utah | 8% | 20% | 36% | 36% | $60,053 | 4.3% | 3.5% | $141,240 |
| United States | 15% | 19% | 30% | 36% | $52,047 | 7.2% | 5.9% | $16,701,415 |
| * Federal Poverty Level. "The U.S. Census Bureau's poverty threshold for a family with two adults and one child was $18,751 in 2013. This is the official measurement of poverty used by the Federal Government." † Median annual household income, 2011-2013. ‡ In millions of current dollars. "Gross State Product is a measurement of a state's output; it is the sum of value added from all industries in the state." Source: The Henry J. Kaiser Family Foundation, "State Health Facts" | ||||||||
See also
- Energy policy in the U.S.
- Fracking in New Mexico
- Net metering
- Renewable Portfolio Standard
- Environmental policy in New Mexico
Recent news
The link below is to the most recent stories in a Google news search for the terms New Mexico energy policy. These results are automatically generated from Google. Ballotpedia does not curate or endorse these articles.
Footnotes
- ↑ New Mexico Oil Conservation Division, "About," accessed March 27, 2017
- ↑ 2.0 2.1 New Mexico Oil Conservation Division, "OCD Rules," accessed March 27, 2017
- ↑ 3.0 3.1 3.2 3.3 3.4 U.S. Environmental Protection Agency, "Chapter 3. Funding and Financial Incentive Policies," accessed March 1, 2017
- ↑ National Renewable Energy Laboratory, “State & Local Activities,” accessed January 30, 2014
- ↑ National Conference of State Legislatures, "State Renewable Portfolio Standards and Goals," accessed March 14, 2017
- ↑ 6.0 6.1 6.2 Mexico.pdf Institute for Energy Research, "New Mexico Energy Facts," accessed March 15, 2017
- ↑ DSIRE, "New Mexico - Renewable Energy Standard," accessed March 27, 2017
- ↑ New Mexico Energy Conservation and Management Division, "Property Assessed Clean Energy (PACE) Bond Financing," accessed March 27, 2017
- ↑ DSIRE, "Building Energy Code - New Mexico," accessed March 27, 2017
- ↑ Database of State Incentives for Renewables and Efficiency, "Glossary," accessed October 22, 2014
- ↑ Edison Electric Institute, "Straight Talk About Net Metering," September 2013
- ↑ Call Me Power, "What is the difference between wholesale and retail electricity?" March 12, 2015
- ↑ DSIRE, "Net metering programs," accessed February 28, 2017
- ↑ DSIRE, "New Mexico - Net Metering," accessed March 27, 2017
- ↑ U.S. Energy Information Administration, "British Thermal Units (Btu)," December 15, 2014
- ↑ 16.0 16.1 16.2 16.3 16.4 16.5 U.S. Energy Information Administration, "New Mexico State Energy Profile," May 19, 2016
- ↑ U.S. Energy Information Administration, "Table 13. Productive Capacity and Capacity Utilization of Underground Coal Mines by State and Mining Method, 2014," accessed July 19, 2016
- ↑ U.S. Energy Information Administration, "Crude Oil Production," July 31, 2015
- ↑ U.S. Energy Information Administration, "Natural Gas Gross Withdrawals and Production," July 31, 2015
- ↑ Congressional Research Service, "Federal Land Ownership: Overview and Data," December 29, 2014
- ↑ U.S. Bureau of Land Management, "Public Land Statistics 2014," May 2015
- ↑ Western Energy Alliance, "Production," accessed November 25, 2015
- ↑ James M. Inhofe - U.S. Senator, Oklahoma, "Inhofe Introduces Bill to Achieve Domestic Energy Independence Through State Control of Federal Energy Resources," June 26, 2013
- ↑ U.S. Bureau of Land Management, "Oil and Gas Lease Sales," accessed October 20, 2014
- ↑ RWE, "How the electricity price is determined," accessed April 21, 2015
- ↑ Forbes, "How The Price For Power Is Set," December 26, 2012
- ↑ U.S. Energy Information Administration, "Gasoline and Diesel Fuel Update," accessed April 25, 2016
- ↑ Tax Foundation, "How High Are Gas Taxes in Your State?" July 23, 2016
- ↑ The Washington Post, "A (very) brief history of the state gas tax on its 95th birthday," February 25, 2014
- ↑ American Petroleum Institute, "Motor Fuel Taxes," accessed April 27, 2016
- ↑ U.S. Department of Transportation, "When did the Federal Government begin collecting the gas tax?" November 18, 2015
- ↑ Business Dictionary, "Electric utility," accessed February 28, 2017
- ↑ 33.0 33.1 U.S. Department of Energy, "A Primer on Electric Utilities, Deregulation, and Restructuring of U.S. Energy Markets," May 2002
- ↑ 34.0 34.1 Electric Choice, "Map of Deregulated Energy States and Markets (Updated 2017)," accessed February 28, 2017
- ↑ 35.0 35.1 Allied Power Services, "Deregulated States," accessed February 28, 2017
- ↑ New Mexico Public Regulation Commission, "Utility Division," accessed March 21, 2017
- ↑ New Mexico Public Regulation Commission, "Cooperatives," accessed March 27, 2017
- ↑ New Mexico Public Regulation Commission, "Electric," accessed March 27, 2017
- ↑ WhatIs.com, "North American Electric Reliability Corporation (NERC)," accessed February 28, 2017
- ↑ North American Electric Reliability Corporation, "Frequently asked questions," August 2013
- ↑ Western Electricity Coordinating Council, "Standards," accessed March 16, 2017
- ↑ 42.0 42.1 42.2 42.3 U.S. Department of Energy, "How Much Energy Does Your State Produce?" November 10, 2014
- ↑ The raw data for this study was provided by Dave Leip of Atlas of U.S. Presidential Elections.
- ↑ Academy Health, "Impact of the Economy on Health Care," August 2009
- ↑ The Conversation, "Budget explainer: What do key economic indicators tell us about the state of the economy?" May 6, 2015
- ↑ Health Affairs, "Socioeconomic Disparities In Health: Pathways And Policies," accessed July 13, 2015
- ↑ The Henry J. Kaiser Family Foundation, "Distribution of Total Population by Federal Poverty Level," accessed July 17, 2015
- ↑ The Henry J. Kaiser Family Foundation, "Median Annual Household Income," accessed July 17, 2015
- ↑ The Henry J. Kaiser Family Foundation, "Unemployment Rate (Seasonally Adjusted)," accessed July 17, 2015
- ↑ The Henry J. Kaiser Family Foundation, "Total Gross State Product (GSP) (millions of current dollars)," accessed July 17, 2015
