Ballotpedia:Who Runs the States, Louisiana
Praise or blame is extended to political parties for the economic, educational, health and other quality of life outcomes that result from the policies those parties enact into law. To better understand which political party enjoys power in each of the states, Ballotpedia has analyzed state government control from 1992-2013 using the concept of a "partisan trifecta." A partisan trifecta is defined as when a state's governorship and legislative chambers are controlled by the same political party.
The two major political parties claim that their policies will lead to better outcomes. What does the data show?
At Ballotpedia, we explored these issues in a three-part study, Who Runs the States.
This page takes a specific look at how Louisiana performed in the study.
Background about the study
- See also: Ballotpedia: Who Runs the States
Part One examines the partisanship of state government from 1992 to 2013. Part Two establishes a State Quality of Life Index (SQLI), aggregating a variety of existing state indices into one measurement. Part Three will overlay the two reports, looking for trends and correlations.
Part 1: Partisanship analysis
Louisiana Governor
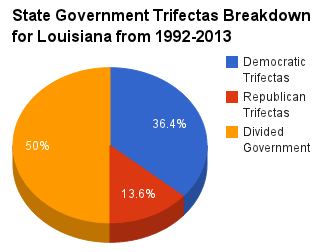
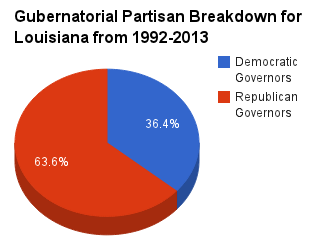
From 1992 to 2013, there were Democratic governors in office for eight years while there were Republican governors in office for 14 years, including the last six. Louisiana was under Republican trifectas for the last three years of the study period.
Across the country, there were 493 years of Democratic governors (44.82%) and 586 years of Republican governors (53.27%) from 1992-2013.
Over the course of the 22-year study, state governments became increasingly more partisan. At the outset of the study period (1992), 18 of the 49 states with partisan legislatures had single-party trifectas and 31 states had divided governments. In 2013, only 13 states have divided governments, while single-party trifectas held sway in 36 states, the most in the 22 years studied.
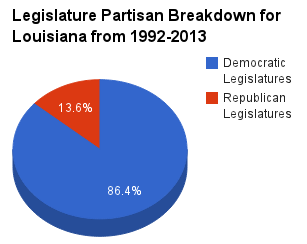
Louisiana Senate
From 1992 to 2013, the Democratic Party was the majority in the Louisiana State Senate for 19 years while the Republicans were the majority for three years. The Louisiana State Senate is one of 16 state senates that was Democratic for more than 80 percent of the years between 1992-2013.
Across the country, there were 541 Democratic and 517 Republican state senates from 1992 to 2013.
Louisiana House of Representatives
From 1992 to 2013, the Democratic Party was the majority in the Louisiana State House of Representatives for the first 19 years while the Republicans were the majority for the last three years. The Louisiana State House of Representatives is one of 18 state Houses that was Democratic for more than 80 percent of the years between 1992 and 2013.
Across the country, there were 577 Democratic and 483 Republican state houses of representatives from 1992 to 2013.
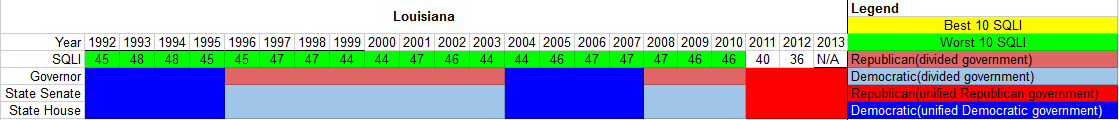
The chart below shows the partisan composition of the Office of the Governor of Louisiana, the Louisiana State Senate and the Louisiana House of Representatives from 1992-2013.
Partisan control changes
There were four partisan control changes in Louisiana during the study period. The average number of changes in the 50 states was also four.
Part 2: State Quality of Life Index (SQLI)
Louisiana’s average ranking over the course of the study period was 45.19, which puts it at 46 in the overall SQLI ranking.[1]
- The year that Louisiana had the highest ranking was 2012, in which it ranked 36th.
- The years that Louisiana had the lowest ranking were 1993 and 1994, in which it ranked 48th.
- The index type that Louisiana had the highest ranking in was Tax Freedom Day, in which it ranked 2nd.
- The index types that Louisiana had the lowest ranking in were America’s Health Rankings and S&P Credit Rating, in which it ranked 49th.
| Louisiana SQLI 1992-2012 | ||||||||||||||||||||||||
|---|---|---|---|---|---|---|---|---|---|---|---|---|---|---|---|---|---|---|---|---|---|---|---|---|
| Index | 1992 | 1993 | 1994 | 1995 | 1996 | 1997 | 1998 | 1999 | 2000 | 2001 | 2002 | 2003 | 2004 | 2005 | 2006 | 2007 | 2008 | 2009 | 2010 | 2011 | 2012 | |||
| 24/7 Wall St Best/Worst Governed States | N/A | N/A | N/A | N/A | N/A | N/A | N/A | N/A | N/A | N/A | N/A | N/A | N/A | N/A | N/A | N/A | N/A | N/A | 46 | 42 | 41 | |||
| America's Health Rankings | 50 | 50 | 50 | 50 | 49 | 50 | 50 | 50 | 49 | 50 | 49 | 49 | 49 | 48 | 49 | 48 | 49 | 47 | 49 | 50 | 49 | |||
| CAFR Debt/GDP | N/A | N/A | N/A | N/A | N/A | N/A | N/A | N/A | N/A | N/A | N/A | N/A | N/A | 10 | 13 | 17 | 20 | 29 | 21 | 22 | N/A | |||
| Chief Executive Magazine Best and Worst States for Business Survey | N/A | N/A | N/A | N/A | N/A | N/A | N/A | N/A | N/A | N/A | N/A | N/A | N/A | 38 | 46 | 47 | 45 | 43 | 40 | 27 | 13 | |||
| CNBC Top States for Business | N/A | N/A | N/A | N/A | N/A | N/A | N/A | N/A | N/A | N/A | N/A | N/A | N/A | N/A | N/A | 47 | 43 | 44 | 44 | 42 | 42 | |||
| Forbes Best States for Business | N/A | N/A | N/A | N/A | N/A | N/A | N/A | N/A | N/A | N/A | N/A | N/A | N/A | N/A | 50 | 49 | 49 | 44 | 44 | 25 | 34 | |||
| Govt. Employment Share Population | 28 | 30 | 32 | 37 | 38 | 40 | 39 | 39 | 38 | 35 | 36 | 39 | 39 | 35 | 34 | 33 | 33 | 33 | 32 | 32 | 27 | |||
| Graduation Rate | 50 | 50 | 50 | 50 | 49 | 48 | 45 | 48 | 48 | 47 | 45 | 43 | 43 | 43 | 44 | 39 | 46 | 49 | 47 | 48 | 46 | |||
| Personal Income Per Capita | 45 | 44 | 41 | 41 | 42 | 40 | 44 | 45 | 45 | 45 | 43 | 44 | 44 | 42 | 36 | 30 | 29 | 28 | 28 | 28 | 29 | |||
| Poverty Rate | 49 | 50 | 50 | 46 | 47 | 41 | 49 | 49 | 49 | 46 | 47 | 46 | 47 | 49 | 48 | 48 | 49 | 34 | 49 | 49 | N/A | |||
| Real GDP per capita | 31 | 30 | 25 | 21 | 26 | 16 | 15 | 18 | 23 | 22 | 23 | 20 | 18 | 17 | 17 | 21 | 25 | 20 | 16 | 17 | N/A | |||
| S&P Credit Rating | N/A | N/A | N/A | N/A | N/A | N/A | N/A | N/A | N/A | 47 | 47 | 48 | 48 | 48 | 50 | 50 | 49 | 45 | 45 | 28 | 29 | |||
| State Govt. Spending/GDP | 35 | 38 | 34 | 34 | 24 | 31 | 32 | 32 | 32 | 22 | 24 | 22 | 23 | 16 | 22 | 34 | 39 | 39 | 28 | 24 | N/A | |||
| State & local tax burden | 6 | 5 | 6 | 6 | 6 | 8 | 8 | 8 | 8 | 9 | 9 | 9 | 8 | 9 | 8 | 8 | 8 | 8 | 4 | N/A | N/A | |||
| Tax Freedom Day | N/A | N/A | N/A | N/A | N/A | N/A | N/A | N/A | N/A | N/A | N/A | N/A | N/A | N/A | N/A | N/A | N/A | N/A | N/A | N/A | 2 | |||
| Unemployment Rate | 40 | 42 | 47 | 46 | 44 | 43 | 41 | 37 | 44 | 43 | 37 | 37 | 33 | 46 | 17 | 16 | 13 | 8 | 14 | 15 | 15 | |||
| Unfunded Pension Liabilities per capita | N/A | N/A | N/A | N/A | N/A | N/A | N/A | N/A | N/A | N/A | N/A | N/A | N/A | N/A | N/A | N/A | N/A | 31 | 33 | 31 | N/A | |||
| Voter Turnout | 29 | 50 | 50 | 16 | 16 | 45 | 45 | 24 | 24 | 33 | 33 | 29 | 29 | 49 | 49 | 33 | 33 | 38 | 38 | 22 | 22 | |||
| Well-Being Index | N/A | N/A | N/A | N/A | N/A | N/A | N/A | N/A | N/A | N/A | N/A | N/A | N/A | N/A | N/A | N/A | 42 | 41 | 42 | 36 | 43 | |||
Part 3: Partisanship and SQLI Overlay
The chart below depicts the partisanship of the Kentucky state government and the state's SQLI ranking for the years studied. For the SQLI, the states were ranked from 1-50, with 1 being the best and 50 the worst. Louisiana has had three periods of trifectas, two Democratic trifectas (1992-1995 and 2004-2007) and one Republican trifecta (2011-2013). Louisiana had its longest period of divided government between 1996 and 2003. For all but two years of the study, Louisiana has ranked in the bottom-10 in the SQLI ranking and only left the bottom-10 in the last two years of the study, 2011 and 2012. The state’s lowest ranking came in 1993 and 1994 under a Democratic trifecta. Its highest ranking (36th) came in 2012 under a Republican trifecta.
- SQLI average with Democratic trifecta: 46.25
- SQLI average with Republican trifecta: 38.00
- SQLI average with divided government: 45.73
See also
- Ballotpedia:Who runs the states
- Governor of Louisiana
- Louisiana State Senate
- Louisiana House of Representatives
Additional information
External links
Footnotes
- ↑ Note: The average rank is compiled by adding up all years of rankings and then dividing by 21 to obtain the average state ranking. This average figure is ranked relative to the rest of the 49 states to derive an overall SQLI ranking.
 |
State of Louisiana Baton Rouge (capital) |
|---|---|
| Elections |
What's on my ballot? | Elections in 2024 | How to vote | How to run for office | Ballot measures |
| Government |
Who represents me? | U.S. President | U.S. Congress | Federal courts | State executives | State legislature | State and local courts | Counties | Cities | School districts | Public policy |