Public education in Mississippi
| K-12 education in Mississippi | |
 | |
| Education facts | |
| State superintendent: Lance Evans | |
| Number of students: 457,954 | |
| Number of teachers: 31,063 | |
| Teacher/pupil ratio: 1:14.7 | |
| Number of school districts: 137 | |
| Number of schools: 1,013 | |
| Graduation rate: 85% | |
| Per-pupil spending: $9,653 | |
| See also | |
| Mississippi Department of Education • List of school districts in Mississippi • Mississippi • School boards portal | |
Public education in the United States Public education in Mississippi Glossary of education terms | |
| Note: The statistics on this page are mainly from government sources, including the U.S. Census Bureau and the National Center for Education Statistics. Figures given were the most recent as of June 2015. | |
The Mississippi public school system (prekindergarten through grade 12) operates within districts governed by locally elected school boards and superintendents. In 2022, Mississippi had 457,954 students enrolled in a total of 1,013 schools in 137 school districts. There were 31,063 teachers in the public schools, or roughly one teacher for every 15 students, compared to the national average of 1:16. In 2020, Mississippi spent on average $9,653 per pupil.[1] The state's graduation rate was 85 percent in the 2018-2019 school year.[2]
General information
- See also: General comparison table for education statistics in the 50 states and Education spending per pupil in all 50 states
The following chart shows how Mississippi compares to the national level for the most recent years for which data is available.
| Public education in Mississippi | |||||||
|---|---|---|---|---|---|---|---|
| State | Schools | Districts | Students | Teachers | Teacher to pupil ratio | Per pupil spending* | |
| Mississippi | 1,013 | 137 | 457,954 | 31,063 | 1:14.7 | $9,653 | |
| United States | 90,323 | 13,194 | 47,755,383 | 2,783,705 | 1:16 | $13,494 | |
| *Per pupil spending data reflects information reported for fiscal year 2020. Sources: Education statistics in the United States | |||||||
Academic performance
The sections below do not contain the most recently published data on this subject. If you would like to help our coverage grow, consider donating to Ballotpedia.
| Education terms |
|---|
| For more information on education policy terms, see this article. |
NAEP scores
- See also: NAEP scores by state
The National Center for Education Statistics provides state-by-state data on student achievement levels in mathematics and reading in the National Assessment of Educational Progress (NAEP). The table below presents the percentage of fourth and eighth grade students that scored at or above proficient in reading and math during school year 2012-2013. Compared to three neighboring states (Alabama, Arkansas, and Louisiana), Mississippi's scores were the lowest nearly across the board.[3]
| Percent of students scoring at or above proficient, 2012-2013 | ||||
|---|---|---|---|---|
| Math - Grade 4 | Math - Grade 8 | Reading - Grade 4 | Reading - Grade 8 | |
| Mississippi | 26% | 21% | 21% | 20% |
| Alabama | 38% | 20% | 31% | 25% |
| Arkansas | 39% | 28% | 32% | 30% |
| Louisiana | 26% | 21% | 23% | 24% |
| United States | 41% | 34% | 34% | 34% |
| Source: United States Department of Education, ED Data Express, "State Tables" | ||||
Graduation, ACT and SAT scores
The following table shows the graduation rates and average composite ACT and SAT scores for Mississippi and surrounding states during the 2012-2013 school year. All statements made in this section refer to that school year.[3][4][5]
In the United States, public schools reported graduation rates that averaged to about 81.4 percent. About 54 percent of all students in the country took the ACT, while 50 percent reported taking the SAT. The average national composite scores for those tests were 20.9 out of a possible 36 for the ACT, and 1498 out of a possible 2400 for the SAT.[6]
Mississippi schools reported a graduation rate of 75.5 percent during the 2012-2013 school year, second lowest among its neighboring states.
In Mississippi, more students took the ACT than the SAT in 2013, earning an average ACT score of 18.9.
| Comparison table for graduation rates and test scores, 2012-2013 | |||||||
|---|---|---|---|---|---|---|---|
| State | Graduation rate, 2013 | Average ACT composite, 2013 | Average SAT composite, 2013 | ||||
| Percent | Quintile ranking** | Score | Participation rate | Score | Participation rate | ||
| Mississippi | 75.5% | Fifth | 18.9 | 95% | 1,673 | 3% | |
| Alabama | 80% | Fourth | 20.4 | 78% | 1,608 | 7% | |
| Arkansas | 84.9% | Second | 20.2 | 90% | 1,697 | 4% | |
| Louisiana | 73.5% | Fifth | 19.5 | 100% | 1,655 | 5% | |
| United States | 81.4% | 20.9 | 54% | 1498 | 50% | ||
| **Graduation rates for states in the first quintile ranked in the top 20 percent nationally. Similarly, graduation rates for states in the fifth quintile ranked in the bottom 20 percent nationally. Sources: United States Department of Education, "ED Data Express" ACT.org, "2013 ACT National and State Scores" The Commonwealth Foundation, "SAT scores by state, 2013" | |||||||
Dropout rate
- See also: Public high school dropout rates by state for a full comparison of dropout rates by group in all states
The high school event dropout rate indicates the proportion of students who were enrolled at some time during the school year and were expected to be enrolled in grades nine through 12 in the following school year but were not enrolled by October 1 of the following school year. Students who have graduated, transferred to another school, died, moved to another country, or who are out of school due to illness are not considered dropouts. The average public high school event dropout rate for the United States remained constant at 3.3 percent for both school year 2010–2011 and school year 2011–2012. The event dropout rate for Mississippi was lower than the national average at 3.2 percent in the 2010-2011 school year, and 3.2 percent in the 2011-2012 school year.[7]
Educational choice options
- See also: School choice in Mississippi
As of June 2015, school choice options in Mississippi included charter schools, school vouchers, an inter-district open enrollment policy and online learning programs. In addition, about 9.26 percent of school-age children in the state attended private schools in the 2011-2012 academic year, and an estimated 2.67 percent were homeschooled in 2012-2013.
Developments
Espinoza v. Montana Department of Revenue (2020)

On June 30, 2020, the U.S. Supreme Court decided Espinoza v. Montana Department of Revenue, which concerned whether the government can exclude religious institutions from student-aid programs. The case related to Article X, Section 6 of the Montana Constitution, also known as Montana’s Blaine Amendment.[8]
In its 5-4 opinion, the court held that the application of Article X, Section 6 violated the free exercise clause of the U.S. Constitution. The majority held Article X, Section 6 barred religious schools and parents who wished to send their children to those schools from receiving public benefits because of the religious character of the school.[9]
The case addressed the tension between the free exercise and Establishment clauses of the U.S. Constitution—where one guarantees the right of individuals' free exercise of religion and the other guarantees that the state won't establish a religion—and the intersections of state constitutions with state law and with the U.S. Constitution.
Mississippi is one of the states with a Blaine Amendment.
Education funding and expenditures
- See also: Mississippi state budget and finances
Source: National Association of State Budget Officers
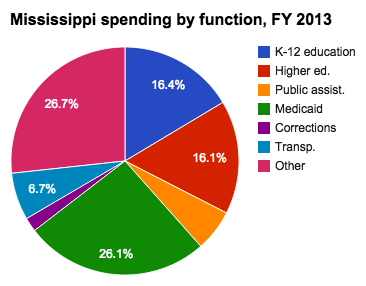
According to the National Association of State Budget Officers (NASBO), states spent an average of 19.8 percent of their total budgets on elementary and secondary education during fiscal year 2013. In addition, the United States Census Bureau found that approximately 45.6 percent of the country's school system revenue came from state sources, while about 45.3 percent came from local sources. The remaining portion of school system revenue came from federal sources.[10][11]
Mississippi spent approximately 16.4 percent of its budget on elementary and secondary education during fiscal year 2013. School system revenue came primarily from state funds. Mississippi spent the second lowest percentage of its total budget on public education when compared to its neighboring states.
| Comparison of financial figures for school systems, fiscal year 2013 | |||||||
|---|---|---|---|---|---|---|---|
| State | Percentage of budget | Per pupil spending | Revenue sources | ||||
| Percent federal funds | Percent state funds | Percent local funds | |||||
| Mississippi | 16.4% | $8,130 | 16% | 49.9% | 34.1% | ||
| Alabama | 20.4% | $8,755 | 11.3% | 54.5% | 34.2% | ||
| Arkansas | 15.6% | $9,394 | 11.3% | 76.2% | 12.5% | ||
| Louisiana | 19.3% | $10,490 | 15.2% | 41.7% | 43.1% | ||
| United States | 19.8% | $10,700 | 9.1% | 45.6% | 45.3% | ||
| Sources: NASBO, "State Expenditure Report" (Table 8). U.S. Census Bureau, "Public Education Finances: 2013, Economic Reimbursable Surveys Division Reports" (Table 5 and Table 8). | |||||||
Revenue breakdowns
- See also: Public school system revenues in the U.S. to compare all states.
According to the United States Census Bureau, public school system revenues totaled approximately $598 billion in fiscal year 2013.[11]
In Mississippi, the primary source of school system revenue during fiscal year 2013 was state funding, at $2.2 billion. Mississippi reported the lowest total public education revenue when compared to its neighboring states.
| Revenues by source, fiscal year 2013 (amounts in thousands) | ||||
|---|---|---|---|---|
| State | Federal revenue | State revenue | Local revenue | Total revenue |
| Mississippi | $707,522 | $2,213,501 | $1,511,995 | $4,433,018 |
| Alabama | $811,739 | $3,898,347 | $2,443,158 | $7,153,244 |
| Arkansas | $572,096 | $3,847,045 | $631,643 | $5,050,784 |
| Louisiana | $1,229,248 | $3,370,399 | $3,484,625 | $8,084,272 |
| United States | $54,367,305 | $272,916,892 | $270,645,402 | $597,929,599 |
| Source: U.S. Census Bureau, "Public Education Finances: 2013, Economic Reimbursable Surveys Division Reports" (Table 1) | ||||
Expenditure breakdowns
According to the National Center for Education Statistics, public school system expenditures totaled approximately $602 billion in fiscal year 2012.[12]
Public education expenditures in Mississippi totaled approximately $4.3 billion in fiscal year 2012. Mississippi reported the lowest total public education expenditures when compared to its neighboring states.
| Expenditures by type, fiscal year 2012 (amounts in thousands) | ||||
|---|---|---|---|---|
| State | General expenditures | Capital outlay | Other | Total expenditures |
| Mississippi | $3,972,787 | $402,465 | $97,791 | $4,341,018 |
| Alabama | $6,386,517 | $582,174 | $260,609 | $7,229,299 |
| Arkansas | $4,606,995 | $625,078 | $161,257 | $5,393,330 |
| Louisiana | $7,544,782 | $744,610 | $168,301 | $8,457,692 |
| United States | $527,096,473 | $48,773,386 | $25,897,123 | $601,766,981 |
| Source: National Center for Education Statistics, "Revenues and Expenditures for Public Elementary and Secondary Education: School Year 2011–12 (Fiscal Year 2012)" (Table 5) | ||||
Personnel salaries
According to the National Center for Education Statistics, the average national salary for classroom teachers in public elementary and secondary schools declined by 1.3 percent from the 1999-2000 school year to the 2012-2013 school year. During the same period in Mississippi, the average salary decreased by 3.5 percent.[14]
| Estimated average salaries for teachers (in constant dollars**) | |||||
|---|---|---|---|---|---|
| 1999-2000 | 2009-2010 | 2011-2012 | 2012-2013 | Percent difference | |
| Mississippi | $43,535 | $48,722 | $42,339 | $41,994 | -3.5% |
| Alabama | $50,139 | $50,779 | $48,802 | $47,949 | -4.4% |
| Arkansas | $45,625 | $49,850 | $47,085 | $46,632 | 2.2% |
| Louisiana | $45,246 | $52,201 | $51,014 | $51,381 | 13.6% |
| United States | $57,133 | $58,925 | $56,340 | $56,383 | -1.3% |
| **"Constant dollars based on the Consumer Price Index (CPI), prepared by the Bureau of Labor Statistics, U.S. Department of Labor, adjusted to a school-year basis. The CPI does not account for differences in inflation rates from state to state." | |||||
Organizations
State agencies
- See also: Mississippi State Board of Education
The mission statement of the Mississippi State Board of Education reads:[15]
| “ | To provide leadership through the development of policy and accountability systems so that all students are prepared to compete in the global community.[16] | ” |
The Mississippi Department of Education is responsible for "implementing state and federal education laws, disbursing state and federal funds, holding schools and districts accountable for performance and licensing all educators."[17]
The Department of Education is led by the Superintendent of Education. The Superintendent of Education is appointed by the State Board of Education. Carey Wright was appointed to the position in 2013.[17][18]
The State Board of Education is composed of nine members. The Governor appoints the following members:[19]
- One member from the state's Northern Supreme Court District
- One member from the state's Central Supreme Court District
- One member from the state's Southern Supreme Court District
- One member who is a school administrator
- One member is a public school teacher
The Lieutenant Governor appoints two at-large members and the Speaker of the House appoints two at-large members.[19]
Unions
In 2012 the Fordham Institute and Education Reform Now assessed the power and influence of state teacher unions in all 50 states and the District of Columbia. Their rankings were based on 37 different variables in five broad areas: resources and membership, involvement in politics, scope of bargaining, state policies and perceived influence. Mississippi ranked 46th overall for union power and influence, or "weakest," which was in the fifth of five tiers.[20]
The main union related to the Mississippi school system is the Mississippi Association of Educators (MAE).[21] According to reports, MAE had a total revenue of $1,639,194 during the 2003 tax period. Another statewide union is AFT Mississippi. A local school union in Mississippi is AFT Biloxi, which had in 2003 total revenues of $343,958.[22]
Government sector lobbying
- See also: Mississippi government sector lobbying
The main education government sector lobbying organization is the Mississippi School Boards Association.
Transparency
The Mississippi Accountability and Transparency Act (2008) mandated the creation of a spending transparency website, which can be accessed here.[23] The state has also launched the Management and Reporting System. This site provides information pertaining to the state budget, state property, revenues, vendors, and state employees.
Studies and reports
Quality Counts 2014
- See also: Education Week survey
Education Week, a publication that reports on many education issues throughout the country, began using an evaluation system in 1997 to grade each state on various elements of education performance. This system, called Quality Counts, uses official data on performance from each state to generate report cards for all 50 states and the District of Columbia. The report card in 2014 uses six different categories:
- Chance for success
- K-12 achievement
- Standards, assessments and accountability
- The teaching profession
- School finance
- Transitions and alignment
Each of these six categories had a number of other elements that received individual scores. Those scores were then averaged and used to determine the final score in each category. Every state received two types of scores for each of the six major categories: A numerical score out of 100 and a letter grade based on that score. Education Week used the score for the first category, "chance for success," as the value for ranking each state and the District of Columbia. The average grade received in the entire country was 77.3, or a C+ average. The country's highest average score was in the category of "standards, assessments and accountability" at 85.3, or a B average. The lowest average score was in "K-12 achievement", at 70.2, or a C- average.
Mississippi received a score of 68.9, or a D+ average in the "chance for success" category. This was below the national average. The state's highest score was in "standards, assessments and accountability" at 92.8, or an A average. The lowest score was in school finance" at 57.1, or an F average. Mississippi had the lowest score in the "K-12 achievement" category in the country. The chart below displays the scores of Mississippi and its surrounding states.[24]
Note: Click on a column heading to sort the data.
| Public education report cards, 2014 | ||||||
|---|---|---|---|---|---|---|
| State | Chance for success | K-12 achievement | Standards, assessments and accountability | The teaching profession | School finance | Transitions and alignment |
| Mississippi | 68.9 (D+) | 57.1 (F) | 92.8 (A) | 66.5 (D) | 64.9 (D) | 75.0 (C) |
| Alabama | 72.0 (C-) | 62.2 (D-) | 92.2 (A-) | 74.8 (C) | 71.1 (C-) | 85.7 (B) |
| Arkansas | 71.8 (C-) | 66.7 (D+) | 94.4 (A) | 88.0 (B+) | 74.1 (C) | 96.4 (A) |
| Louisiana | 69.9 (C-) | 59.8 (D-) | 97.2 (A) | 79.6 (B-) | 74.9 (C) | 92.9 (A) |
| United States | 77.3 (C+) | 70.2 (C-) | 85.3 (B) | 72.5 (C) | 75.5 (C) | 81.1 (B-) |
| Source: Education Week, "Quality Counts 2014" A full discussion of how these numbers were generated can be found here. | ||||||
State Budget Solutions education study
State Budget Solutions examined national trends in education from 2009 to 2011, including state-by-state analysis of education spending, graduation rates and average ACT scores. The study showed that the states that spent the most did not have the highest average ACT test scores, nor did they have the highest average graduation rates. A summary of the study is available here. The full report can be accessed here.
School districts
- See also: School board elections portal
District types
Mississippi contains five types of school districts:[25]
- Municipal separate districts include the area of a municipality and possibly added territory beyond that municipality. Municipal separate districts have not been authorized since 1987, but those districts that existed before that time may still operate unless abolished by the county board of education or the district's own board of education, if petitioned to do so by residents.
- Special municipal separate districts are municipal separate districts in which the added territory contains at least a quarter of the district's students.
- County districts include all of the territory in a county, except for any territory possessed by a municipal separate district.
- Consolidated districts include portions of a county that are not possessed by either a county school district or a municipal separate district.
- Consolidated line districts are similar to consolidated districts but possess territory in multiple counties.
School board composition
Mississippi school board members are generally elected by residents of the school district, although some school board members for municipal separate school districts are appointed and confirmed by the local mayor, city council or board of aldermen. Mississippi school board elections typically follow the district method. In district elections, only voters residing in a specific geographic area within the school district may vote on certain candidates, who must also reside in that specific geographic area.
Most school boards consist of five members, although there are a few exceptions with six or seven members. School board members serve five-year terms, except for county school districts and two special municipal school districts whose board members serve six-year terms.[26]
Term limits
Mississippi does not impose statewide term limits on school board members. State Senator Sollie Norwood (D) introduced SB 2635 on January 20, 2014, which would have created term limits for all municipal separate school districts, but the bill died in committee on February 4, 2014.[27]
Elections
- See also: Mississippi school board elections, 2024
The table below contains links to all school board elections covered by Ballotpedia in 2024 in this state. This list may not include all school districts with elections in 2024. Ballotpedia's coverage includes all school districts in the 100 largest cities by population and the 200 largest school districts by student enrollment.
Editor's note: Some school districts choose to cancel the primary election, or both the primary and general election, if the number of candidates who filed does not meet a certain threshold. The table below does not reflect which primary or general elections were canceled. Please click through to each school district's page for more information.
| 2024 Mississippi School Board Elections | |||||||
|---|---|---|---|---|---|---|---|
| District | Primary | General Election | General Runoff Election | Regular term length | Seats up for election | Total board seats | 2017-2018 enrollment |
| DeSoto County School District | N/A | 11/5/2024 | 11/26/2024 | 6 | 2 | 5 | 33,991 |
Path to the ballot
To qualify for the ballot as a school board candidate in Mississippi, a person must be:
- A resident of and registered voter in the school district
- The holder of either a high school diploma or its equivalent
A person must not be:
- An employee of the school district
- Married to an employee of the school district
The process of running for office as a school board candidate begins with filing a "qualifying statement of intent" with the county election commission. The number of petition signatures required and the filing deadlines vary according to the type of school district:[28]
- Candidates in municipal separate districts must include a minimum of 25 petition signatures and it must be filed at least 60 days prior to the election.
- Candidates in special municipal separate districts in Louisville, Natchez-Adams, Grenada and Tishomingo must include a minimum of 150 petition signatures and it must be filed between 90 and 30 days prior to the election.
- Candidates in the Vicksburg-Warren special municipal separate district must include a minimum of 150 petition signatures and it must be filed between 90 and 60 days prior to the election.
- Candidates in county districts must include a minimum of 50 petition signatures and it must be filed between 90 and 60 days prior to the election. If there are fewer than 100 qualified electors in a district, candidate petitions must only be signed by a minimum of 20 percent of residents.
- Candidates in consolidated and consolidated line districts must include a minimum of 50 petition signatures and it must be filed between 90 and 60 days prior to the election. If there are fewer than 100 qualified electors in a district, candidate petitions must only be signed by a minimum of 20 percent of residents.
School board election dates also vary according to the type of school district:[26]
- Municipal separate districts hold elections on the first Saturday of March.
- Two special municipal separate districts hold elections on the first Saturday of March, but two other districts hold their elections during the November general election. In the fifth special municipal separate district, board members are appointed on or before March 1 each year.
- County districts hold elections during the November general election.
- Consolidated and consolidated line districts hold elections during the November general election.
Campaign finance
Mississippi requires all school board candidates to file a statement of economic interest with the Mississippi Ethics Commission within 15 days after qualifying as a candidate. All candidates must file periodic, pre-election and annual campaign finance reports with the municipal clerk. If a candidate receives a contribution of more than $200 between 10 days and 48 hours preceding the election, that candidate must file a "48 hour report" with the municipal clerk.[29][30]
Recent legislation
The following is a list of recent education bills that have been introduced in or passed by the Mississippi state legislature. To learn more about each of these bills, click the bill title. This information is provided by BillTrack50 and LegiScan.
- Note: Due to the nature of the sorting process used to generate this list, some results may not be relevant to the topic. If no bills are displayed below, no legislation pertaining to this topic has been introduced in the legislature recently.
Education ballot measures
- See also: Education on the ballot and List of Mississippi ballot measures
Ballotpedia has tracked the following statewide ballot measures relating to education.
- Mississippi Board of Trustees of State Institutions of Higher Learning, Amendment 1 (2003)
- Mississippi Public School Support Amendments, Initiative 42 and Alternative 42 (2015)
- Mississippi Free Public Schools, Amendment 2 (1987)
- Mississippi La Bauve Fund, Amendment 4 (1987)
- Mississippi Educational Trust Fund, Amendment 1 (1986)
- Mississippi State Board of Education, Amendment 1 (1982)
- Mississippi Segregation, Amendment 4 (1978)
In the news
The link below is to the most recent stories in a Google news search for the terms Mississippi education policy. These results are automatically generated from Google. Ballotpedia does not curate or endorse these articles.
See also
- Historical public education information in Mississippi
- Mississippi state budget and finances
- Mississippi Department of Education
- List of school districts in Mississippi
- School choice in Mississippi
- Charter schools in Mississippi
- Mississippi
- Education Policy in the U.S.
External links
- Mississippi Department of Education
- Mississippi State Superintendent of Education
- Mississippi State Board of Education
Footnotes
- ↑ United States Census Bureau, "U.S. School System Current Spending Per Pupil by Region: Fiscal Year 2020," May 18, 2022
- ↑ National Center for Education Statistics, "Fast Facts: High school graduation rates," accessed September 28, 2022
- ↑ 3.0 3.1 United States Department of Education, ED Data Express, "State Tables," accessed May 13, 2014
- ↑ ACT, "2012 ACT National and State Scores," accessed May 13, 2014
- ↑ Commonwealth Foundation, "SAT Scores by State 2013," October 10, 2013
- ↑ StudyPoints, "What's a good SAT score or ACT score?" accessed June 7, 2015
- ↑ United States Department of Education, National Center for Education Statistics, "Common Core of Data (CCD), State Dropout and Graduation Rate Data File, School Year 2010-11, Provision Version 1a and School Year 2011-12, Preliminary Version 1a," accessed May 13, 2014
- ↑ Supreme Court of the United States, Espinoza v. Montana Department of Revenue: "Petition for a writ of certiorari," accessed July 3, 2019
- ↑ Supreme Court of the United States, Espinoza v. Montana Department of Revenue, decided June 30, 2020
- ↑ NASBO, "State Expenditure Report," accessed July 2, 2015
- ↑ 11.0 11.1 U.S. Census Bureau, "Public Education Finances: 2013, Economic Reimbursable Surveys Division Reports," accessed July 2, 2015
- ↑ National Center for Education Statistics, "Revenues and Expenditures for Public Elementary and Secondary Education: School Year 2011–12 (Fiscal Year 2012)," accessed July 2, 2015
- ↑ Maciver Institute, "REPORT: How much are teachers really paid?" accessed October 29, 2014
- ↑ United States Department of Education, National Center for Education Statistics, "Table 211.60. Estimated average annual salary of teachers in public elementary and secondary schools, by state: Selected years, 1969-70 through 2012-13," accessed May 13, 2014
- ↑ Mississippi Department of Education, "State Board of Education: Vision, Mission, Goals," accessed May 21, 2014
- ↑ Note: This text is quoted verbatim from the original source. Any inconsistencies are attributable to the original source.
- ↑ 17.0 17.1 Mississippi Department of Education, "About MDE," accessed May 21, 2014
- ↑ Mississippi Department of Education, "State Superintendent of Education," accessed May 21, 2014
- ↑ 19.0 19.1 Mississippi Department of Education, "Mississippi Board of Education," accessed May 21, 2014
- ↑ Thomas E Fordham Institute, " How Strong Are U.S. Teacher Unions? A State-By-State Comparison," October 29, 2012
- ↑ Mississippi Association of Educators, "Main Page," accessed May 5, 2010
- ↑ Center for Union Facts, "Mississippi teachers unions," accessed May 5, 2010
- ↑ National Taxpayers Union, "Nation's Largest Taxpayer Group Applauds Mississippi for Passing Spending Transparency Legislation," April 17, 2008
- ↑ Education Week "Quality Counts 2014," accessed February 19, 2015
- ↑ United States Census Bureau, "Mississippi," accessed July 9, 2014
- ↑ 26.0 26.1 Mississippi School Boards Association, "So You Want To Be A School Board Member: A Guide for Candidates," accessed July 9, 2014
- ↑ Mississippi Legislature, "Senate Bill 2635," accessed July 9, 2014
- ↑ Secretary of State, "2013 Candidate Qualifying Guide," accessed July 10, 2014
- ↑ Secretary of State, "2014 Mississippi Elections Candidate Qualifying Guide," accessed July 10, 2014
- ↑ Secretary of State, "2014 Campaign Finance Guide," accessed July 10, 2014