Ohio school board elections, 2015
| Ohio's 2015 elections State ballot measures • School boards • Municipal • Candidate ballot access |
2016 →
← 2014
|
Candidate filing dates • Finance reporting • Poll opening and closing times |
A total of 19 Ohio school districts among America's largest school districts by enrollment held elections for 46 seats in 2015. All of the districts held their elections on November 3, 2015.
Here are several quick facts about Ohio's school board elections in 2015:
- The largest school district by enrollment with an election in 2015 was Columbus City Schools with 50,384 K-12 students.
- The smallest school district by enrollment with an election in 2015 was Northwest Local School District with 9,197 K-12 students.
- Two districts tied for the most seats on the ballot in 2015 with four seats up for election each.
- Thirteen districts were tied for the fewest seats on the ballot in 2015 with two seats up for election each.
The districts listed below served 320,378 K-12 students during the 2012-2013 school year, according to the National Center for Education Statistics.[1] Click on the district names for more information on the district and its school board elections.
| 2015 Ohio School Board Elections | ||||
|---|---|---|---|---|
| District | Date | Seats up for election | Total board seats | Student enrollment |
| Akron Public Schools | 11/3/2015 | 4 | 7 | 22,394 |
| Canton City Schools | 11/3/2015 | 3 | 5 | 9,612 |
| Cincinnati Public Schools | 11/3/2015 | 3 | 7 | 31,615 |
| Columbus City Schools | 11/3/2015 | 4 | 7 | 50,384 |
| Dayton Public Schools | 11/3/2015 | 3 | 7 | 14,357 |
| Dublin City Schools | 11/3/2015 | 2 | 5 | 14,627 |
| Fairfield City School District | 11/3/2015 | 2 | 5 | 9,703 |
| Hamilton City School District | 11/3/2015 | 2 | 5 | 9,868 |
| Hilliard City Schools | 11/3/2015 | 2 | 5 | 15,435 |
| Lakota Local Schools | 11/3/2015 | 2 | 5 | 16,526 |
| Mason City School District | 11/3/2015 | 2 | 5 | 10,836 |
| Northwest Local School District | 11/3/2015 | 2 | 5 | 9,197 |
| Olentangy Local School District | 11/3/2015 | 3 | 5 | 17,383 |
| Parma City School District | 11/3/2015 | 2 | 5 | 11,315 |
| Pickerington Local School District | 11/3/2015 | 2 | 5 | 10,061 |
| South-Western City Schools | 11/3/2015 | 2 | 5 | 20,906 |
| Toledo Public Schools | 11/3/2015 | 2 | 5 | 22,107 |
| Westerville City School District | 11/3/2015 | 2 | 5 | 14,629 |
| Worthington Schools | 11/3/2015 | 2 | 5 | 9,423 |
Trends in Ohio school board elections
- See also: School boards in session: 2015 in brief
The 2015 school board elections in Ohio's largest school districts attracted a similar average number of candidates per seat on the ballot as the average number of candidates who ran for a school board seat in 2015 across the United States as a whole. The Ohio elections also had a similar percentage of unopposed seats as there were nationwide. Newcomers overall fared better in school board elections across the country than they did in Ohio's elections. They took 34.78 percent of seats on the ballot in Ohio, whereas they won 40.77 percent of the seats up for election nationwide.
The following sections analyze competitiveness and incumbency advantage in Ohio's school board elections. One of the 19 school districts that held elections in 2015 utilized a primary election. In the other districts, winners only had to receive a plurality, or relative majority, of votes in the general election to secure a seat on the board. All of the school board elections held in the state in 2015 were nonpartisan.
Details of the data discussed here can be found in the table below.
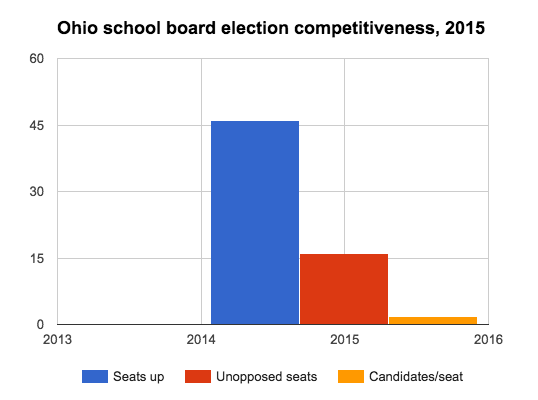
Competitiveness
School board elections in Ohio's largest school districts attracted an average of 1.74 candidates per seat on the ballot in 2015. This was nearly the same as the average 1.72 candidates who ran per school board seat up for election in the largest school districts in the United States in 2015. Unopposed seats were slightly less prevalent in Ohio than in the country as a whole. A total of 34.78 percent of seats were unopposed in the state, compared to the 35.97 percent of seats that were unopposed nationwide.
Incumbency advantage
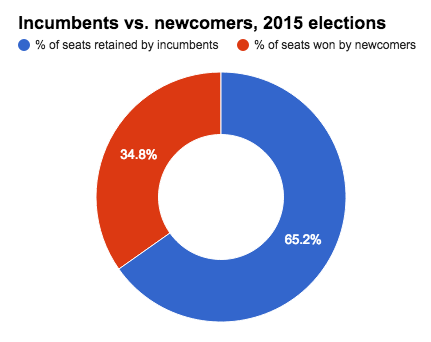
A total of 83.33 percent of incumbents who ran for re-election in Ohio's 2015 school board elections retained their seats. Thirty-six of the 46 incumbents whose terms were on the ballot ran to keep their seats, and 30 of them won re-election. Fourteen of those winners won re-election unopposed; the other winners defeated challengers to win additional terms.
A total of 82.66 percent of incumbents kept their seats in school board elections across the country, and 40.45 percent of them ran unopposed. The map below details the success rates for incumbents who ran in the 2015 school board elections that were held in the largest school districts by enrollment in the U.S.
The map above details the success rates of incumbent who ran to retain their school board seats in the largest school districts in each state. States depicted in gray did not hold school board elections. |
Data table
The table below displays the statistics for school board elections in Ohio's largest school districts in 2015.
| Ohio school board elections, 2015 | ||||||||||
|---|---|---|---|---|---|---|---|---|---|---|
| Year | Total | Incumbents | ||||||||
| Seats up | Candidates | Candidates/ seat |
Unopposed seats | % unopposed | % seats won by newcomers | Sought re-election | Unopposed | Retained | % retained | |
| 2015 | 46 | 80 | 1.74 | 16 | 34.78% | 34.78% | 36 | 14 | 30 | 83.33% |
Spotlight districts
A statewide program funded by the No Child Left Behind Act was shut down in 2013 after allegations of fraud in Columbus City Schools. The school board paid over $850,000 to tutoring companies that charged for unperformed services. In 2015, the state auditor released the conclusion of its audit of the district which showed little to no oversight of payments to the contracted tutoring companies.
Columbus City Schools
The state of Ohio conducted a special investigation audit that discovered approximately $850,000 in payments from Columbus City Schools to tutoring companies for services that were never provided. The money was paid to 27 different tutoring companies to tutor at-risk students in the district as part of a federal grant program provided by No Child Left Behind (NCLB). The district received the NCLB money from the state as part of the now defunct Supplemental Educational Services program. The district was billed for students who did not attend the tutoring sessions or who were not attending school in the district. Two tutoring company owners, Mussa Farrah and Ashkir Ali, have been charged with aggravated identity theft and making false statements as a result of the investigation.[2]
School board candidate Bernadine Kennedy Kent and her husband, James Whitaker, attempted to uncover the fraud in 2006 when they filed a report with the Columbus Police Department that alleged fraud involving the NCLB funds. Kent is a former assistant principal in the district and operates the nonprofit Parents Advocates for Students in Schools (PASS). After no action was taken by the Columbus Police Department, Kent and Whitaker went to the FBI with the information they had collected regarding the fraudulent payments. The FBI then launched an investigation which led to the state audit. In 2014, it was discovered that Kent and Whitaker were placed on a "chronic complainer" list by the Columbus Police Department which led to their original report being ignored.[3][4]
While the tutoring providers submitted false invoices to the district, Ohio state auditor Dave Yost criticized the district for a lack of oversight: “Even if you don’t do it for every single invoice, to not at least sample some of those invoices and check it back is a little bit puzzling." The district released a statement regarding the audit that said it had implemented new accounting practices since that time.[5]
Survey responses
Two of the 83 candidates running for a school board seat in Ohio's largest school districts in the 2015 elections responded to Ballotpedia's school board candidate survey. The following sections display their answers to questions about top priorities and education issues.
Top priorities

When asked what his top priorities would be if elected, John McManus, winner of a seat on the Dayton Public Schools Board of Education, stated:
| “ | The majority of the challenges listed by state government in their report warning of impending takeover are directly correlated to the administrative shortcomings of the District. I have spent years in state and federal government service specializing in government operations and public sector administrative policies and procedures. The Board must work to clean up the administrative failures in order to best avoid a takeover. My top priority would be putting my experience to use to help the other members of the Board implement sound administrative foundations for the District.[6] | ” |
| —John McManus (2015)[7] | ||

Andrew Forgrave, challenger for a seat on the Olentangy Local School District Board of Education, stated the following as his top priorities:
| “ | School enrollment is expected to expand for the foreseeable future. This growth will require an expansion of the current facilities. The board needs ensure the taxpayers money is being maximized for the use of the best quality education for the students. We need to maintain and improve the quality of education for the students. The students' school experience must also be taken into consideration in any of the board's decisions.[6] | ” |
| —Andrew Forgrave (2015)[8] | ||
Ranking the issues
The candidates were asked to rank the following issues by importance in the school district, with 1 being the most important and 7 being the least important. This table displays the candidates' average rankings as well as the highest and lowest rankings for each issue.
| Issue importance ranking | |||
|---|---|---|---|
| Issues | Average ranking | Highest ranking | Lowest ranking |
| Expanding arts education | 5.00 | 5 | 5 |
| Expanding career-technical education | 4.00 | 4 | 4 |
| Balancing or maintaining the district's budget | 1.00 | 1 | 1 |
| Improving college readiness | 4.00 | 2 | 6 |
| Closing the achievement gap | 4.00 | 2 | 6 |
| Improving education for special needs students | 3.00 | 3 | 3 |
| Expanding school choice options | 7.00 | 7 | 7 |
Positions on the issues
The candidates were asked an additional 10 short answer and multiple choice questions regarding significant issues in education. Links to those responses can be found below.
State profile
| Demographic data for Ohio | ||
|---|---|---|
| Ohio | U.S. | |
| Total population: | 11,605,090 | 316,515,021 |
| Land area (sq mi): | 40,861 | 3,531,905 |
| Race and ethnicity** | ||
| White: | 82.4% | 73.6% |
| Black/African American: | 12.2% | 12.6% |
| Asian: | 1.9% | 5.1% |
| Native American: | 0.2% | 0.8% |
| Pacific Islander: | 0% | 0.2% |
| Two or more: | 2.5% | 3% |
| Hispanic/Latino: | 3.4% | 17.1% |
| Education | ||
| High school graduation rate: | 89.1% | 86.7% |
| College graduation rate: | 26.1% | 29.8% |
| Income | ||
| Median household income: | $49,429 | $53,889 |
| Persons below poverty level: | 19.6% | 11.3% |
| Source: U.S. Census Bureau, "American Community Survey" (5-year estimates 2010-2015) Click here for more information on the 2020 census and here for more on its impact on the redistricting process in Ohio. **Note: Percentages for race and ethnicity may add up to more than 100 percent because respondents may report more than one race and the Hispanic/Latino ethnicity may be selected in conjunction with any race. Read more about race and ethnicity in the census here. | ||
Presidential voting pattern
- See also: Presidential voting trends in Ohio
Ohio voted Republican in four out of the six presidential elections between 2000 and 2020.
Pivot Counties (2016)
Ballotpedia identified 206 counties that voted for Donald Trump (R) in 2016 after voting for Barack Obama (D) in 2008 and 2012. Collectively, Trump won these Pivot Counties by more than 580,000 votes. Of these 206 counties, nine are located in Ohio, accounting for 4.37 percent of the total pivot counties.[9]
Pivot Counties (2020)
In 2020, Ballotpedia re-examined the 206 Pivot Counties to view their voting patterns following that year's presidential election. Ballotpedia defined those won by Trump won as Retained Pivot Counties and those won by Joe Biden (D) as Boomerang Pivot Counties. Nationwide, there were 181 Retained Pivot Counties and 25 Boomerang Pivot Counties. Ohio had eight Retained Pivot Counties and one Boomerang Pivot County, accounting for 4.42 and 4.00 percent of all Retained and Boomerang Pivot Counties, respectively.
More Ohio coverage on Ballotpedia
- Elections in Ohio
- United States congressional delegations from Ohio
- Public policy in Ohio
- Influencers in Ohio
- Ohio fact checks
- More...
Academic performance
| Education terms |
|---|
| For more information on education policy terms, see this article. |
- See also: Public education in Ohio
NAEP scores
- See also: NAEP scores by state
The National Center for Education Statistics provides state-by-state data on student achievement levels in mathematics and reading in the National Assessment of Educational Progress (NAEP). The chart below presents the percentage of fourth and eighth grade students that scored at or above proficient in reading and math during the 2012-2013 school year. Compared to three neighboring states (Indiana, Michigan, and Pennsylvania), Ohio had the second highest percentage of eighth graders score at or above proficient in reading.[10]
| Percent of students scoring at or above proficient, 2012-2013 | ||||
|---|---|---|---|---|
| Math - Grade 4 | Math - Grade 8 | Reading - Grade 4 | Reading - Grade 8 | |
| Ohio | 48% | 40% | 37% | 39% |
| Indiana | 52% | 38% | 38% | 35% |
| Michigan | 37% | 30% | 31% | 33% |
| Pennsylvania | 44% | 42% | 40% | 42% |
| United States | 41% | 34% | 34% | 34% |
| Source: United States Department of Education, ED Data Express, "State Tables" | ||||
Graduation, ACT and SAT scores
The following table shows the graduation rates and average composite ACT and SAT scores for Ohio and surrounding states during the 2012-2013 school year. All statements made in this section refer to that school year.[10][11][12]
In the United States, public schools reported graduation rates that averaged to about 81.4 percent. About 54 percent of all students in the country took the ACT, while 50 percent reported taking the SAT. The average national composite scores for those tests were 20.9 out of a possible 36 for the ACT and 1,498 out of a possible 2,400 for the SAT.[13]
Ohio schools reported a graduation rate of 82.2 percent, second-lowest among its neighboring states.
In Ohio, more students took the ACT than the SAT, earning an average ACT score of 21.8.
| Comparison table for graduation rates and test scores, 2012-2013 | |||||||
|---|---|---|---|---|---|---|---|
| State | Graduation rate, 2013 | Average ACT composite, 2013 | Average SAT composite, 2013 | ||||
| Percent | Quintile ranking** | Score | Participation rate | Score | Participation rate | ||
| Ohio | 82.2% | Third | 21.8 | 72% | 1,635 | 17% | |
| Indiana | 87% | First | 21.7 | 38% | 1,470 | 70% | |
| Michigan | 77% | Fourth | 19.9 | 100% | 1,782 | 4% | |
| Pennsylvania | 85.5% | Second | 22.7 | 18% | 1,480 | 71% | |
| United States | 81.4% | 20.9 | 54% | 1498 | 50% | ||
| **Graduation rates for states in the first quintile ranked in the top 20 percent nationally. Similarly, graduation rates for states in the fifth quintile ranked in the bottom 20 percent nationally. Sources: United States Department of Education, "ED Data Express ACT.org, "2013 ACT National and State Scores The Commonwealth Foundation, "SAT scores by state, 2013 | |||||||
Dropout rate
- See also: Public high school dropout rates by state for a full comparison of dropout rates by group in all states
The high school event dropout rate indicates the proportion of students who were enrolled at some time during the school year and were expected to be enrolled in grades 9–12 in the following school year but were not enrolled by October 1 of the following school year. Students who have graduated, transferred to another school, died, moved to another country, or who are out of school due to illness are not considered dropouts. The average public high school event dropout rate for the United States remained constant at 3.3 percent for both school year 2010–11 and school year 2011–12. The event dropout rate for Ohio was higher than the national average at 4.4 percent in the 2010-2011 school year, and 4.6 percent in the 2011-2012 school year.[14]
See also
| Ohio | School Boards | News and Analysis |
|---|---|---|
 |
 | |
|
Footnotes
- ↑ National Center for Education Statistics, "Elementary/Secondary Information System," accessed April 20, 2015
- ↑ The Columbus Dispatch, "Audit: Fake tutoring accounts cost taxpayers more than $800,000," October 6, 2015
- ↑ Columbus Free Press, "Are you on the Columbus Police's secret blacklist," January 30, 2014
- ↑ The Columbus Dispatch, "Complainers list holds risk," March 24, 2014
- ↑ WOSU Radio, "Columbus City Schools Bilked Out Of Tutoring Money," October 5, 2015
- ↑ 6.0 6.1 Note: This text is quoted verbatim from the original source. Any inconsistencies are attributable to the original source.
- ↑ Ballotpedia School Board Candidate Survey, 2015, "John McManus' responses," October 14, 2015
- ↑ Ballotpedia School Board Candidate Survey, 2015, "Andrew Forgrave's responses," October 15, 2015
- ↑ The raw data for this study was provided by Dave Leip of Atlas of U.S. Presidential Elections.
- ↑ 10.0 10.1 United States Department of Education, ED Data Express, "State Tables," accessed May 13, 2014
- ↑ ACT, "2012 ACT National and State Scores," accessed May 13, 2014
- ↑ Commonwealth Foundation, "SAT Scores by State 2013," October 10, 2013
- ↑ StudyPoints, "What's a good SAT score or ACT score?" accessed June 7, 2015
- ↑ United States Department of Education, National Center for Education Statistics, "Common Core of Data (CCD), State Dropout and Graduation Rate Data File, School Year 2010-11, Provision Version 1a and School Year 2011-12, Preliminary Version 1a," accessed May 13, 2014
| |||||