Estimated zip code population in 2022: 54,990
Zip code population in 2010: 51,145
Zip code population in 2000: 51,344
Houses and condos: 19,697
Renter-occupied apartments: 13,601
| % of renters here: | 73% |
| State: | 44% |
139.5
(high, U.S. average is 100)
Land area: 3.3
sq. mi.
Water area: 0.0
sq. mi.
| Population density: 16,619 people per square mile | | (very high). |
![Age and Sex of Residents in zip code 91405]()
- OSM Map
- General Map
- Google Map
- MSN Map
- OSM Map
- General Map
- Google Map
- MSN Map
- OSM Map
- General Map
- Google Map
- MSN Map
- OSM Map
- General Map
- Google Map
- MSN Map
Please wait while loading the map...
Real estate property taxes paid for housing units in 2022:
| This zip code: | 0.6% ($4,366) |
| California: | 0.7% ($4,831) |
$4,825 (0.7%)
Median real estate property taxes paid for housing units with no mortgage in 2022: $3,303 (0.5%)

Profiles of local businesses
Business Search - 14 Million verified businesses
| Males: 27,126 |  (49.3%) (49.3%) |
| Females: 27,864 |  (50.7%) (50.7%) |
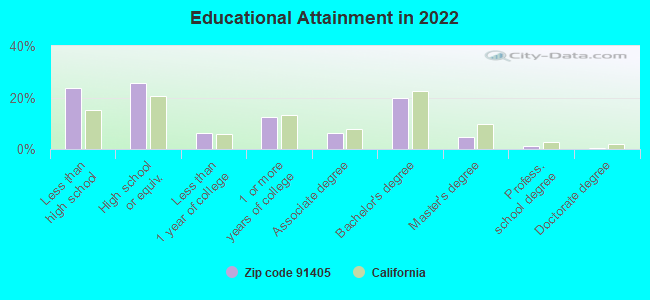
For population 25 years and over in 91405:
- High school or higher: 76.0%
- Bachelor's degree or higher: 25.7%
- Graduate or professional degree: 6.0%
- Unemployed: 7.1%
- Mean travel time to work (commute): 32.6 minutes
For population 15 years and over in 91405:
- Never married: 44.9%
- Now married: 39.8%
- Separated: 2.6%
- Widowed: 4.7%
- Divorced: 7.9%
Zip code 91405 compared to state average:
- Median household income below state average.
- Foreign-born population percentage above state average.
- Renting percentage above state average.
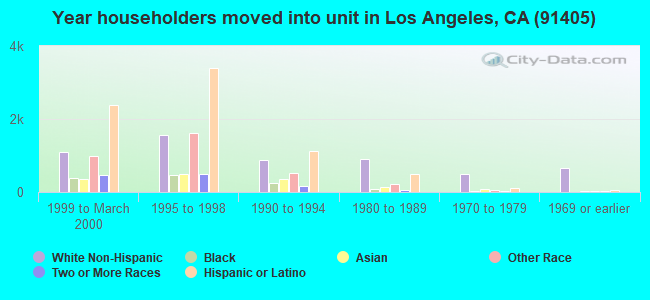
- Length of stay since moving in significantly above state average.
- Number of rooms per house below state average.


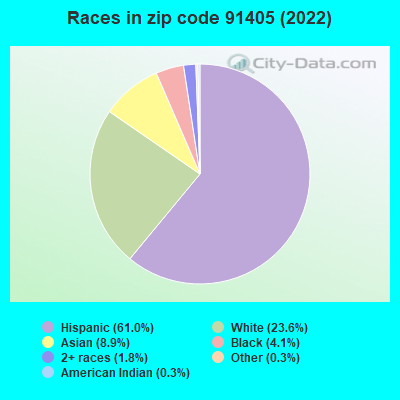
- 33,53461.0%Hispanic or Latino
- 12,99023.6%White
- 4,8848.9%Asian
- 2,2504.1%Black
- 9761.8%Two or more races
- 1590.3%American Indian
- 1880.3%Some other race
- 60.01%Native Hawaiian and Other
Pacific Islander
Data:
100%
urban population.
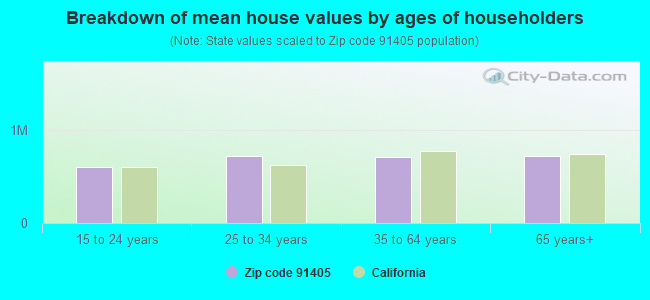
Estimated median house/condo value in 2022: $704,281
| 91405: | $704,281 |
| California: | $715,900 |
According to our research of California and other state lists, there were 64 registered sex offenders living in 91405 zip code as of July 23, 2024.
The ratio of all residents to sex offenders in zip code 91405 is 861 to 1.
The ratio of registered sex offenders to all residents in this zip code is near the state average.
Median resident age:| This zip code: | 35.3 years |
| California median age: | 37.9 years |
Average household size:| This zip code: | 2.9 people |
| California: | 2.8 people |
Averages for the 2020 tax year for zip code 91405, filed in 2021:
Average Adjusted Gross Income (AGI) in 2020: $43,926 (Individual Income Tax Returns)
| Here: | $43,926 |
| State: | $95,910 |
Salary/wage: $42,188 (reported on 77.6% of returns)
| Here: | $42,188 |
| State: | $77,331 |
(% of AGI for various income ranges: 1191.2% for AGIs below $25k, 4156.2% for AGIs $25k-50k, 7923.0% for AGIs $50k-75k, 11790.8% for AGIs $75k-100k, 21249.4% for AGIs $100k-200k, 72306.0% for AGIs over 200k)
Taxable interest for individuals: $892 (reported on 17.5% of returns)
| This zip code: | $892 |
| California: | $2,294 |
(% of AGI for various income ranges: 5.9% for AGIs below $25k, 8.1% for AGIs $25k-50k, 34.0% for AGIs $50k-75k, 50.1% for AGIs $75k-100k, 100.5% for AGIs $100k-200k, 1077.0% for AGIs over 200k)
Ordinary dividends: $2,939 (reported on 7.6% of returns)
(% of AGI for various income ranges: 9.8% for AGIs below $25k, 8.9% for AGIs $25k-50k, 30.2% for AGIs $50k-75k, 80.7% for AGIs $75k-100k, 189.3% for AGIs $100k-200k, 1531.0% for AGIs over 200k)
Net capital gain/loss in AGI: +$9,164 (reported on 8.6% of returns)
| Here: | +$9,164 |
| State: | +$49,306 |
(% of AGI for various income ranges: 3.5% for AGIs below $25k, 12.6% for AGIs $25k-50k, 48.2% for AGIs $50k-75k, 139.2% for AGIs $75k-100k, 472.4% for AGIs $100k-200k, 12452.0% for AGIs over 200k)
Profit/loss from business: +$9,277 (reported on 30.2% of returns)
| Here: | +$9,277 |
| State: | +$15,671 |
(% of AGI for various income ranges: 434.2% for AGIs below $25k, 271.8% for AGIs $25k-50k, 333.1% for AGIs $50k-75k, 480.8% for AGIs $75k-100k, 1236.3% for AGIs $100k-200k, 6811.0% for AGIs over 200k)
Taxable individual retirement arrangement distribution: $14,255 (reported on 2.2% of returns)
| 91405: | $14,255 |
| California: | $23,505 |
(% of AGI for various income ranges: 14.2% for AGIs below $25k, 20.4% for AGIs $25k-50k, 73.3% for AGIs $50k-75k, 137.2% for AGIs $75k-100k, 275.5% for AGIs $100k-200k, 865.0% for AGIs over 200k)
Self-employed (Keogh) retirement plans: $15,650 (reported on 0.2% of returns)
| 91405: | $15,650 |
| California: | $30,163 |
(% of AGI for various income ranges: 72.0% for AGIs $100k-200k)
Total itemized deductions: $30,620 (reported on 7.7% of returns)
| Here: | $30,620 |
| State: | $39,517 |
(% of AGI for various income ranges: 59.4% for AGIs below $25k, 143.3% for AGIs $25k-50k, 372.3% for AGIs $50k-75k, 945.2% for AGIs $75k-100k, 2231.3% for AGIs $100k-200k, 12189.0% for AGIs over 200k)
Charity contributions: $4,707 (reported on 5.9% of returns)
(% of AGI for various income ranges: 2.4% for AGIs below $25k, 10.7% for AGIs $25k-50k, 45.3% for AGIs $50k-75k, 96.1% for AGIs $75k-100k, 295.5% for AGIs $100k-200k, 1921.0% for AGIs over 200k)
Taxes paid: $8,233 (reported on 7.7% of returns)
(% of AGI for various income ranges: 14.4% for AGIs below $25k, 38.2% for AGIs $25k-50k, 110.0% for AGIs $50k-75k, 292.6% for AGIs $75k-100k, 686.7% for AGIs $100k-200k, 2004.0% for AGIs over 200k)
Earned income credit: $2,080 (reported on 22.8% of returns)
(% of AGI for various income ranges: 122.6% for AGIs below $25k, 79.6% for AGIs $25k-50k, 1.5% for AGIs $50k-75k)
Percentage of individuals using paid preparers for their 2020 taxes: 90.5%
(% for various income ranges: 87.7% for AGIs below $25k, 92.5% for AGIs $25k-50k, 92.5% for AGIs $50k-75k, 93.4% for AGIs $75k-100k, 92.5% for AGIs $100k-200k, 90.0% for AGIs over 200k)
Averages for the 2012 tax year for zip code 91405, filed in 2013:
Average Adjusted Gross Income (AGI) in 2012: $33,299 (Individual Income Tax Returns)
| Here: | $33,299 |
| State: | $72,726 |
Salary/wage: $32,565 (reported on 82.7% of returns)
| Here: | $32,565 |
| State: | $59,079 |
(% of AGI for various income ranges: 73.5% for AGIs below $25k, 88.2% for AGIs $25k-50k, 86.0% for AGIs $50k-75k, 82.4% for AGIs $75k-100k, 80.5% for AGIs $100k-200k, 53.7% for AGIs over 200k)
Taxable interest for individuals: $630 (reported on 17.4% of returns)
| This zip code: | $630 |
| California: | $2,146 |
(% of AGI for various income ranges: 0.3% for AGIs below $25k, 0.2% for AGIs $25k-50k, 0.4% for AGIs $50k-75k, 0.6% for AGIs $75k-100k, 0.3% for AGIs $100k-200k, 0.5% for AGIs over 200k)
Ordinary dividends: $2,905 (reported on 6.1% of returns)
(% of AGI for various income ranges: 0.4% for AGIs below $25k, 0.2% for AGIs $25k-50k, 0.4% for AGIs $50k-75k, 1.0% for AGIs $75k-100k, 0.9% for AGIs $100k-200k, 1.1% for AGIs over 200k)
Net capital gain/loss in AGI: +$3,467 (reported on 5.3% of returns)
| Here: | +$3,467 |
| State: | +$30,460 |
(% of AGI for various income ranges: 0.2% for AGIs $50k-75k, 0.3% for AGIs $75k-100k, 0.8% for AGIs $100k-200k, 7.1% for AGIs over 200k)
Profit/loss from business: +$9,331 (reported on 26.3% of returns)
| Here: | +$9,331 |
| State: | +$17,064 |
(% of AGI for various income ranges: 20.5% for AGIs below $25k, 5.3% for AGIs $25k-50k, 3.2% for AGIs $50k-75k, 2.5% for AGIs $75k-100k, 2.6% for AGIs $100k-200k, 3.8% for AGIs over 200k)
Taxable individual retirement arrangement distribution: $11,163 (reported on 2.8% of returns)
| 91405: | $11,163 |
| California: | $19,557 |
(% of AGI for various income ranges: 0.6% for AGIs below $25k, 0.7% for AGIs $25k-50k, 0.9% for AGIs $50k-75k, 1.4% for AGIs $75k-100k, 1.8% for AGIs $100k-200k)
Self-employment retirement plans: $14,467 (reported on 0.1% of returns)
| 91405: | $14,467 |
| California: | $24,530 |
Total itemized deductions: $21,973 (30% of AGI, reported on 20.1% of returns)
| Here: | $21,973 |
| State: | $34,004 |
| Here: | 30.4% of AGI |
| State: | 22.7% of AGI |
(% of AGI for various income ranges: 5.7% for AGIs below $25k, 10.0% for AGIs $25k-50k, 15.8% for AGIs $50k-75k, 19.4% for AGIs $75k-100k, 20.4% for AGIs $100k-200k, 18.7% for AGIs over 200k)
Charity contributions: $2,286 (reported on 14.9% of returns)
(% of AGI for various income ranges: 0.2% for AGIs below $25k, 0.7% for AGIs $25k-50k, 1.4% for AGIs $50k-75k, 1.4% for AGIs $75k-100k, 1.8% for AGIs $100k-200k, 1.6% for AGIs over 200k)
Taxes paid: $6,359 (reported on 20.0% of returns)
| 91405: | $6,359 |
| State: | $14,448 |
(% of AGI for various income ranges: 1.0% for AGIs below $25k, 2.0% for AGIs $25k-50k, 4.1% for AGIs $50k-75k, 6.1% for AGIs $75k-100k, 7.6% for AGIs $100k-200k, 7.3% for AGIs over 200k)
Earned income credit: $2,535 (reported on 31.5% of returns)
(% of AGI for various income ranges: 9.2% for AGIs below $25k, 1.5% for AGIs $25k-50k)
Percentage of individuals using paid preparers for their 2012 taxes: 75.8%
(% for various income ranges: 75.8% for AGIs below $25k, 76.1% for AGIs $25k-50k, 74.9% for AGIs $50k-75k, 74.7% for AGIs $75k-100k, 75.6% for AGIs $100k-200k, 83.3% for AGIs over 200k)
Averages for the 2004 tax year for zip code 91405, filed in 2005:
Average Adjusted Gross Income (AGI) in 2004: $29,523 (Individual Income Tax Returns)
| Here: | $29,523 |
| State: | $58,600 |
Salary/wage: $29,145 (reported on 85.2% of returns)
| Here: | $29,145 |
| State: | $49,455 |
(% of AGI for various income ranges: 82.5% for AGIs below $10k, 83.7% for AGIs $10k-25k, 89.7% for AGIs $25k-50k, 86.7% for AGIs $50k-75k, 83.5% for AGIs $75k-100k, 70.5% for AGIs over 100k)
Taxable interest for individuals: $1,108 (reported on 24.9% of returns)
| This zip code: | $1,108 |
| California: | $2,365 |
(% of AGI for various income ranges: 2.4% for AGIs below $10k, 0.7% for AGIs $10k-25k, 0.8% for AGIs $25k-50k, 0.8% for AGIs $50k-75k, 0.9% for AGIs $75k-100k, 1.5% for AGIs over 100k)
Taxable dividends: $2,130 (reported on 8.8% of returns)
(% of AGI for various income ranges: 1.2% for AGIs below $10k, 0.5% for AGIs $10k-25k, 0.4% for AGIs $25k-50k, 0.6% for AGIs $50k-75k, 0.9% for AGIs $75k-100k, 1.1% for AGIs over 100k)
Net capital gain/loss: +$5,596 (reported on 7.6% of returns)
| Here: | +$5,596 |
| State: | +$23,418 |
(% of AGI for various income ranges: -0.5% for AGIs below $10k, 0.0% for AGIs $10k-25k, -0.1% for AGIs $25k-50k, 0.5% for AGIs $50k-75k, 0.7% for AGIs $75k-100k, 8.3% for AGIs over 100k)
Profit/loss from business: +$8,267 (reported on 22.8% of returns)
| Here: | +$8,267 |
| State: | +$16,826 |
(% of AGI for various income ranges: 34.0% for AGIs below $10k, 11.5% for AGIs $10k-25k, 4.4% for AGIs $25k-50k, 3.2% for AGIs $50k-75k, 3.8% for AGIs $75k-100k, 2.9% for AGIs over 100k)
IRA payment deduction: $2,825 (reported on 2.0% of returns)
| 91405: | $2,825 |
| California: | $3,192 |
(% of AGI for various income ranges: 0.2% for AGIs $10k-25k, 0.2% for AGIs $25k-50k, 0.3% for AGIs $50k-75k, 0.2% for AGIs $75k-100k, 0.1% for AGIs over 100k)
Self-employed pension: $8,369 (reported on 0.4% of returns)
| Here: | $8,369 |
| California: | $17,688 |
(% of AGI for various income ranges: 0.2% for AGIs below $10k, 0.0% for AGIs $25k-50k, 0.1% for AGIs $50k-75k, 0.2% for AGIs $75k-100k, 0.3% for AGIs over 100k)
Total itemized deductions: $19,174 (33% of AGI, reported on 24.2% of returns)
| Here: | $19,174 |
| State: | $28,113 |
| Here: | 32.8% of AGI |
| State: | 25.3% of AGI |
(% of AGI for various income ranges: 12.6% for AGIs below $10k, 7.5% for AGIs $10k-25k, 14.0% for AGIs $25k-50k, 21.4% for AGIs $50k-75k, 23.3% for AGIs $75k-100k, 19.9% for AGIs over 100k)
Charity contributions deductions: $2,326 (4% of AGI, reported on 19.9% of returns)
| Here: | 3.7% of AGI |
| State: | 3.3% of AGI |
(% of AGI for various income ranges: 0.4% for AGIs below $10k, 0.5% for AGIs $10k-25k, 1.2% for AGIs $25k-50k, 2.2% for AGIs $50k-75k, 2.8% for AGIs $75k-100k, 2.5% for AGIs over 100k)
Total tax: $3,460 (reported on 66.4% of returns)
| 91405: | $3,460 |
| State: | $10,761 |
(% of AGI for various income ranges: 6.3% for AGIs below $10k, 4.0% for AGIs $10k-25k, 5.5% for AGIs $25k-50k, 8.4% for AGIs $50k-75k, 10.5% for AGIs $75k-100k, 15.6% for AGIs over 100k)
Earned income credit: $1,928 (reported on 31.1% of returns)
Percentage of individuals using paid preparers for their 2004 taxes: 77.9%
(% for various income ranges: 74.4% for AGIs below $10k, 80.3% for AGIs $10k-25k, 77.5% for AGIs $25k-50k, 76.8% for AGIs $50k-75k, 79.8% for AGIs $75k-100k, 77.4% for AGIs over 100k)
Estimated median household income in 2022: | This zip code: | $58,140 |
| California: | $91,551 |
![Los Angeles, CA (91405) map]() Nearest zip codes: 91402
Nearest zip codes: 91402,
91411,
91401,
91406,
91605,
91343.
Los Angeles Zip Code Map
Percentage of family households:| This zip code: | 50.6% |
| California: | 46.8% |
Percentage of households with unmarried partners:| This zip code: | 8.4% |
| California: | 48.1% |
Likely homosexual households (counted as self-reported same-sex unmarried-partner households)
- Lesbian couples: 0.3% of all households
- Gay men: 0.2% of all households
Household received Food Stamps/SNAP in the past 12 months: 4,165
Household did not receive Food Stamps/SNAP in the past 12 months: 14,908
Women who had a birth in the past 12 months: 542 (326 now married, 217 unmarried)
Women who did not have a birth in the past 12 months: 14,234 (4,859 now married, 9,407 unmarried)
Housing units in zip code 91405 with a mortgage: 3,603 (295
second mortgage, 266
both second mortgage and home equity loan)
Houses without a mortgage: 95
Median monthly owner costs for units with a mortgage: $2,595
Median monthly owner costs for units without a mortgage: $941
Residents with income below the poverty level in 2022:
| This zip code: | 19.9% |
| Whole state: | 12.2% |
| This zip code: | 10.9% |
| Whole state: | 6.2% |
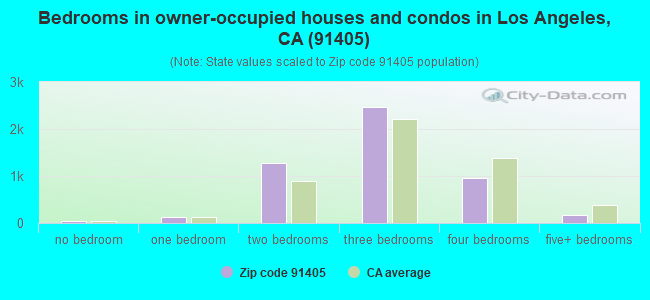
Median number of rooms in houses and condos:
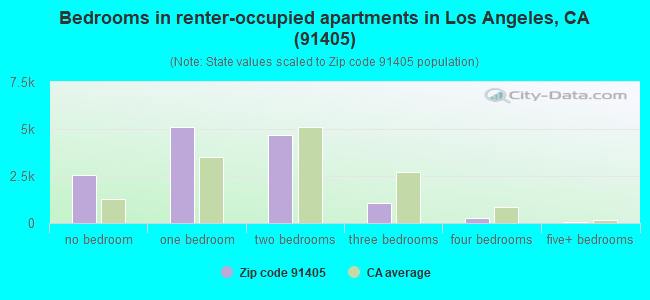
Median number of rooms in apartments:
Notable locations in this zip code not listed on our city pages
- Click to draw/clear zip code borders
Notable locations in zip code 91405: Mid Valley Senior Citizens Center (A), Saint Elizabeth Hall (B). Display/hide their locations on the map
Churches in zip code 91405 include: Central Christian Church (A), First Evangelical Lutheran Church (B), Saint Elizabeth Roman Catholic Church (C), First Lutheran Church (D), La Iglesia En Camino (E), Saint Mark's Episcopal Church (F), Seventh Day Adventist Church (G), Valley Mission Church (H), Van Nuys Church of Christ (I). Display/hide their locations on the map
Parks in zip code 91405 include: Van Nuys Recreation Area (1), Hartland Mini Park (2). Display/hide their locations on the map


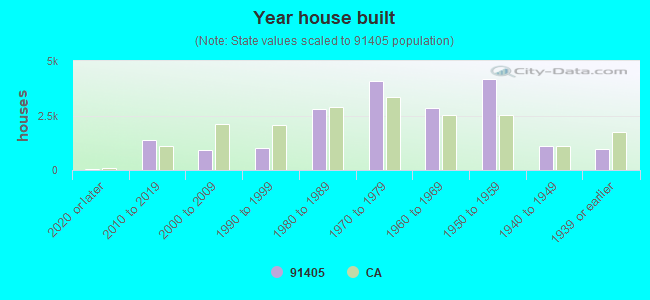
- Year house built (houses)
- 672020 or later
- 1,3982010 to 2019
- 9392000 to 2009
- 1,0091990 to 1999
- 2,7961980 to 1989
- 4,0651970 to 1979
- 2,8601960 to 1969
- 4,1851950 to 1959
- 1,1201940 to 1949
- 9851939 or earlier
![Zip code 91405 satellite photo by USGS]()
Zip code 91405 household income distribution in 2022
![Zip code 91405 household income distribution in 2022]()
- 1,053Less than $10,000
- 1,069$10,000 to $14,999
- 805$15,000 to $19,999
- 961$20,000 to $24,999
- 630$25,000 to $29,999
- 961$30,000 to $34,999
- 624$35,000 to $39,999
- 1,209$40,000 to $44,999
- 649$45,000 to $49,999
- 1,647$50,000 to $59,999
- 2,039$60,000 to $74,999
- 2,233$75,000 to $99,999
- 1,558$100,000 to $124,999
- 943$125,000 to $149,999
- 1,146$150,000 to $199,999
- 1,181$200,000 or more
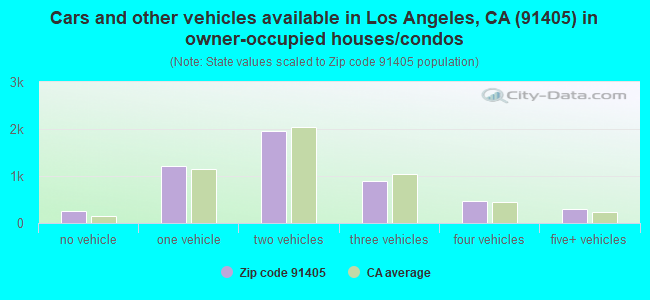
Estimate of home value of owner-occupied houses/condos in 2022 in zip code 91405
![Estimate of home value of owner-occupied houses/condos in 2022 in zip code 91405]()
- 60Less than $10,000
- 20$10,000 to $14,999
- 16$15,000 to $19,999
- 6$20,000 to $24,999
- 29$40,000 to $49,999
- 9$70,000 to $79,999
- 34$80,000 to $89,999
- 41$90,000 to $99,999
- 11$100,000 to $124,999
- 5$125,000 to $149,999
- 22$150,000 to $174,999
- 24$200,000 to $249,999
- 45$250,000 to $299,999
- 359$300,000 to $399,999
- 429$400,000 to $499,999
- 2,066$500,000 to $749,999
- 1,490$750,000 to $999,999
- 332$1,000,000 to $1,499,999
- 15$1,500,000 to $1,999,999
- 27$2,000,000 or more
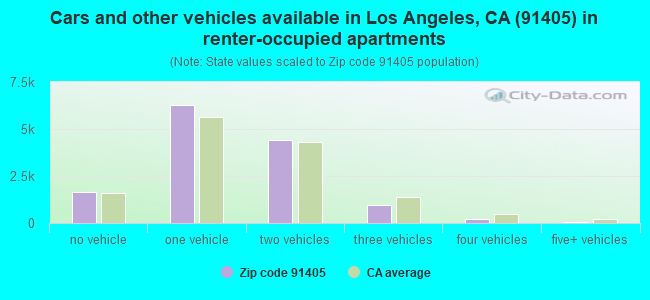
Rent paid by renters in 2022 in zip code 91405
![Rent paid by renters in 2022 in zip code 91405]()
- 29Less than $100
- 35$200 to $249
- 117$250 to $299
- 152$300 to $349
- 54$350 to $399
- 21$400 to $449
- 115$500 to $549
- 5$550 to $599
- 28$600 to $649
- 92$650 to $699
- 23$700 to $749
- 87$750 to $799
- 385$800 to $899
- 621$900 to $999
- 2,368$1,000 to $1,249
- 2,295$1,250 to $1,499
- 4,318$1,500 to $1,999
- 1,460$2,000 to $2,499
- 539$2,500 to $2,999
- 203$3,000 to $3,499
- 217$3,500 or more
- 322No cash rent
Median gross rent in 2022: $1,661.
Median price asked for vacant for-sale houses and condos in 2022: $754,092.
Estimated median house (or condo) value in 2022 for:
- White Non-Hispanic householders: $758,923
- Black or African American householders: $679,995
- American Indian or Alaska Native householders: $556,544
- Asian householders: $658,543
- Native Hawaiian and other Pacific Islander householders: $758,923
- Some other race householders: $704,686
- Two or more races householders: $771,471
- Hispanic or Latino householders: $685,257
Estimated median house or condo value in 2022: $704,281
| 91405: | $704,281 |
| California: | $715,900 |
$546,736 - $903,982
Mean price in 2022:
Detached houses: $1,324,769| Here: | $1,324,769 |
| State: | $988,808 |
Townhouses or other attached units: $832,477| Here: | $832,477 |
| State: | $838,546 |
In 2-unit structures: $1,127,961| Here: | $1,127,961 |
| State: | $1,138,100 |
In 3-to-4-unit structures: $930,211| Here: | $930,211 |
| State: | $824,253 |
In 5-or-more-unit structures: $784,826| Here: | $784,826 |
| State: | $730,996 |
Mobile homes: $255,082| Here: | $255,082 |
| State: | $184,506 |
Occupied boats, RVs, vans, etc.: $63,014| Here: | $63,014 |
| State: | $204,957 |
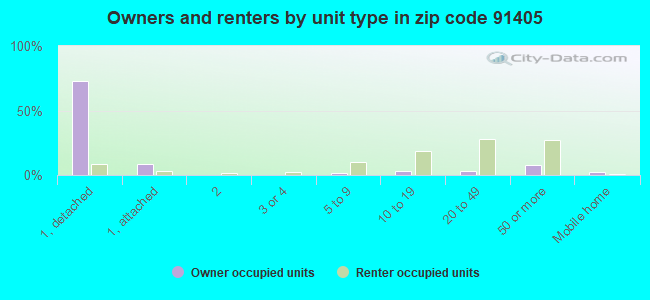
Housing units in structures:
- One, detached: 5,109
- One, attached: 853
- Two: 255
- 3 or 4: 376
- 5 to 9: 1,437
- 10 to 19: 2,745
- 20 to 49: 4,148
- 50 or more: 4,668
- Mobile homes: 188
Unemployment: 7.1%
Means of transportation to work in zip code 91405
![Means of transportation to work in zip code 91405]()
- 61.7%17,119Drove a car alone
- 12.8%3,549Carpooled
- 5.2%1,441Bus or trolley bus
- 0.1%31Streetcar or trolley car
- 0.0%11Subway or elevated
- 1.1%305Ferryboat
- 0.5%128Taxi
- 0.2%48Motorcycle
- 0.7%181Bicycle
- 2.1%571Walked
- 1.2%330Other means
- 13.0%3,614Worked at home
Travel time to work (commute) in zip code 91405
![Travel time to work (commute) in zip code 91405]()
- 228Less than 5 minutes
- 9175 to 9 minutes
- 1,80310 to 14 minutes
- 3,35315 to 19 minutes
- 2,84720 to 24 minutes
- 1,34325 to 29 minutes
- 4,55330 to 34 minutes
- 93135 to 39 minutes
- 1,49540 to 44 minutes
- 2,24745 to 59 minutes
- 2,91460 to 89 minutes
- 1,20390 or more minutes
Neighborhoods in zip code 91405:
Percentage of zip code residents living and working in this county: 98.3%
Household type by relationship:
Households: 54,990
- Male householders: 9,465 (2,308 living alone), Female householders: 9,230 (2,019 living alone)
7,341 spouses (7,203 opposite-sex spouses), 2,102 unmarried partners, (1,987 opposite-sex unmarried partners), 16,715 children (16,136 natural, 169 adopted, 412 stepchildren), 741 grandchildren, 1,594 brothers or sisters, 1,936 parents, 35 foster children, 2,546 other relatives, 2,714 non-relatives
- In group quarters: 595 (-1 institutionalized population)
Size of family households: 3,645 2-persons, 3,278 3-persons, 2,605 4-persons, 1,594 5-persons, 726 6-persons, 471 7-or-more-persons
Size of nonfamily households: 4,319 1-person, 1,747 2-persons, 241 3-persons, 60 4-persons
5,854 married couples with children.
4,229 single-parent households (1,220 men, 3,009 women).
25.4% of residents of 91405 zip code speak English at home.
55.6% of residents speak Spanish at home (51% very well, 21% well, 19% not well, 8% not at all).
11.5% of residents speak other Indo-European language at home (58% very well, 20% well, 17% not well, 5% not at all).
6.5% of residents speak Asian or Pacific Island language at home (49% very well, 26% well, 23% not well, 2% not at all).
1.5% of residents speak other language at home (60% very well, 28% well, 11% not well, 1% not at all).
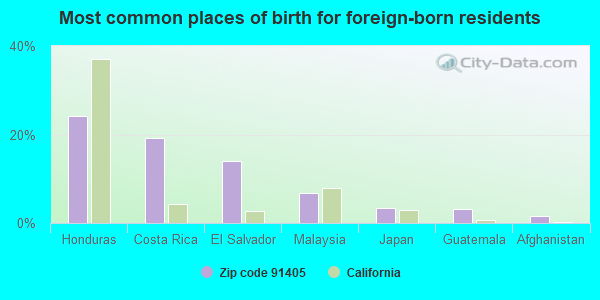
Foreign born population: 25,920 (47.1%)
(47.1%
of them are naturalized citizens)
| This zip code: | 47.1% |
| Whole state: | 26.7% |


- 24%Honduras
- 19%Costa Rica
- 14%El Salvador
- 7%Malaysia
- 3%Japan
- 3%Guatemala
- 2%Afghanistan

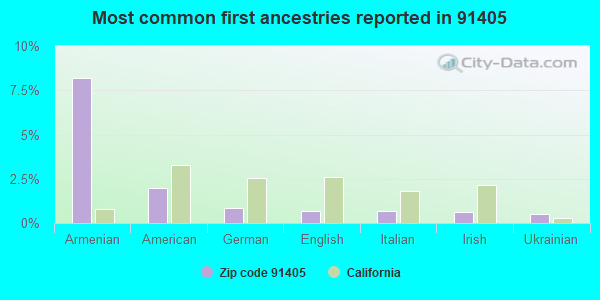
- 8%Armenian
- 2%American
- 1%German
- 1%English
- 1%Italian
- 1%Irish
- 1%Ukrainian

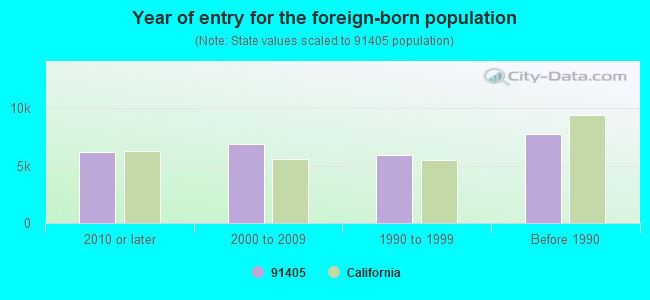
- Year of entry for the foreign-born population
- 6,1482010 or later
- 6,9022000 to 2009
- 5,8811990 to 1999
- 7,771Before 1990
Public high schools in in zip code 91405 not listed on the city page:
Private high schools in in this zip code not listed on the city page:
- CROSSROADS SCHOOL
 (Students: 33, Location: 6843 LENNOX AVE, Grades: 8-12)
- ACADEMY OF AMHERST JR-SR HIGH SCHOOL (Students: 7, Location: 13440 CREWE ST, Grades: 10-12)
![Zip code 91405 topographic map]()
Public elementary/middle schools in in zip code 91405 not listed on the city page:
- VALERIO STREET ELEMENTARY (Students: 773, Location: 15035 VALERIO ST., Grades: KG-5)
- HAZELTINE AVENUE ELEMENTARY (Students: 583, Location: 7150 HAZELTINE AVE., Grades: KG-5)
- COLUMBUS AVENUE (Students: 395, Location: 6700 COLUMBUS AVE., Grades: KG-5)
- ANDRES AND MARIA CARDENAS ELEMENTARY (Location: 6900 CALHOUN AVE., Grades: KG-5)
- LASHON ACADEMY (Location: 7477 KESTER AVE., Grades: KG-6, Charter school)
Private elementary/middle schools in in this zip code not listed on the city page:
- PINECREST SCHOOLS - VAN NUYS (Students: 292, Location: 14111 SHERMAN WAY, Grades: PK-8)
- ST ELISABETH SCHOOL (Students: 245, Location: 6635 TOBIAS AVE, Grades: PK-8)
Major facilities with environmental interests located in this zip code:
- 1-DAY PAINT & BODY CENTERS INC (7607 VAN NUYS BLVD in VAN NUYS, CA)
STATE MASTER (California - Hazardous Waste Tracking) - HAZARDOU WASTE PROGRAM
CRITERIA AND HAZARDOUS AIR POLLUTANT INVENTORY (Inventory of air pollution sources)
Small Quantity Generators, between 100 kg and 1000 kg of hazardous waste/month (Resource Conservation and Recovery Act (tracking hazardous waste))
Business SIC classification: TOP, BODY, AND UPHOLSTERY REPAIR SHOPS AND PAINT SHOPS
Business NAICS classification: AUTOMOTIVE BODY, PAINT, AND INTERIOR REPAIR AND MAINTENANCE.
- 1-DAY PAINT & BODY CENTERS INC (6859 VAN NUYS BLVD in VAN NUYS, CA)
STATE MASTER (California - Hazardous Waste Tracking) - HAZARDOU WASTE PROGRAM
CRITERIA AND HAZARDOUS AIR POLLUTANT INVENTORY (Inventory of air pollution sources)
Small Quantity Generators, between 100 kg and 1000 kg of hazardous waste/month (Resource Conservation and Recovery Act (tracking hazardous waste))
Business SIC classification: TOP, BODY, AND UPHOLSTERY REPAIR SHOPS AND PAINT SHOPS
Business NAICS classification: AUTOMOTIVE BODY, PAINT, AND INTERIOR REPAIR AND MAINTENANCE.
- INDUSTRIAL ELECTRONIC ENGINEERS INCORPORATED (7740 LEMONA AVENUE in VAN NUYS, CA)
STATE MASTER (California - Hazardous Waste Tracking) - HAZARDOU WASTE PROGRAM
CRITERIA AND HAZARDOUS AIR POLLUTANT INVENTORY (Inventory of air pollution sources)
Small Quantity Generators, between 100 kg and 1000 kg of hazardous waste/month (Resource Conservation and Recovery Act (tracking hazardous waste))
Business SIC classification: PRIMARY BATTERIES, DRY AND WET
Business NAICS classification: OTHER COMPUTER PERIPHERAL EQUIPMENT MANUFACTURING.; OTHER ELECTRONIC COMPONENT MANUFACTURING.
- ED PINK RACINE ENGINES INC (14612 RAYMER ST in VAN NUYS, CA)
STATE MASTER (California - Hazardous Waste Tracking) - HAZARDOU WASTE PROGRAM
Small Quantity Generators, between 100 kg and 1000 kg of hazardous waste/month (Resource Conservation and Recovery Act (tracking hazardous waste)) - notification
Business NAICS classification: GENERAL AUTOMOTIVE REPAIR.
Alternative names: ED PINK RACING ENGINES, INC.
- GLOVER MFG INC (15226 STAGG ST in VAN NUYS, CA)
STATE MASTER (California - Hazardous Waste Tracking) - HAZARDOU WASTE PROGRAM
Small Quantity Generators, between 100 kg and 1000 kg of hazardous waste/month (Resource Conservation and Recovery Act (tracking hazardous waste)) - notification
Organizations: DOUG BURCHFIELD (CONTACT/OWNER)
- HEMATOLOGY ONCOLOGY CONSULTANTS (6850 SEPULVEDA BLVD # 211 in VAN NUYS, CA)
STATE MASTER (California - Hazardous Waste Tracking) - HAZARDOU WASTE PROGRAM
Small Quantity Generators, between 100 kg and 1000 kg of hazardous waste/month (Resource Conservation and Recovery Act (tracking hazardous waste)) - notification
Organizations: STANLEY H ROSSMAN MD (CONTACT/OWNER)
- LOS ANGELES USD FULTON JUNIOR HG SCHOOL (7477 KESTER AVE in VAN NUYS, CA)
STATE MASTER (California - Hazardous Waste Tracking) - HAZARDOU WASTE PROGRAM
Small Quantity Generators, between 100 kg and 1000 kg of hazardous waste/month (Resource Conservation and Recovery Act (tracking hazardous waste)) - notification
Organizations: LOS ANGELES UNIFIED SCHOOL DISTRICT (CONTACT/OWNER)
Alternative names: LAUSD/ FULTON JH
- INTERNATIONAL AUTO SPECIALIST (8011 SEPULVEDA BLVD in VAN NUYS, CA)
STATE MASTER (California - Hazardous Waste Tracking) - HAZARDOU WASTE PROGRAM
Small Quantity Generators, between 100 kg and 1000 kg of hazardous waste/month (Resource Conservation and Recovery Act (tracking hazardous waste))
Business NAICS classification: GENERAL AUTOMOTIVE REPAIR.
- AAMCO TRANSMISSIONS (7012 VAN NUYS BLVD in VAN NUYS, CA)
STATE MASTER (California - Hazardous Waste Tracking) - HAZARDOU WASTE PROGRAM
Small Quantity Generators, between 100 kg and 1000 kg of hazardous waste/month (Resource Conservation and Recovery Act (tracking hazardous waste)) - notification
Business NAICS classification: AUTOMOTIVE TRANSMISSION REPAIR.
Organizations: ESPERANZA RODRIGUEZ (CONTACT/OWNER)
- ALLSTAR U S A PARTS (6959 VAN NUYS BLVD in VAN NUYS, CA)
STATE MASTER (California - Hazardous Waste Tracking) - HAZARDOU WASTE PROGRAM
Small Quantity Generators, between 100 kg and 1000 kg of hazardous waste/month (Resource Conservation and Recovery Act (tracking hazardous waste)) - notification
Alternative names: ALLSTAR USA PARTS
- EQUILON ENTERPRISES (13700 SHERMAN WAY in VAN NUYS, CA) . Federal Facility
STATE MASTER (California - Hazardous Waste Tracking) - HAZARDOU WASTE PROGRAM
Small Quantity Generators, between 100 kg and 1000 kg of hazardous waste/month (Resource Conservation and Recovery Act (tracking hazardous waste)) - notification
Organizations: EQUILON ENTERPRISES, LLC (CONTACT/OWNER)
Alternative names: SHELL OIL CO
- EQUILON ENTERPRISES (7162 SEPULVEDA in VAN NUYS, CA) . Federal Facility
STATE MASTER (California - Hazardous Waste Tracking) - HAZARDOU WASTE PROGRAM
Small Quantity Generators, between 100 kg and 1000 kg of hazardous waste/month (Resource Conservation and Recovery Act (tracking hazardous waste)) - notification
Organizations: EQUILON ENTERPRISES, LLC (CONTACT/OWNER)
Alternative names: SHELL OIL CO
- CHEVRON STATION 91319 (15255 SHERMAN WAY in VAN NUYS, CA)
STATE MASTER (California - Hazardous Waste Tracking) - HAZARDOU WASTE PROGRAM
Small Quantity Generators, between 100 kg and 1000 kg of hazardous waste/month (Resource Conservation and Recovery Act (tracking hazardous waste)) - notification
Organizations: CHEVRON PRODUCTS CO (CONTACT/OWNER)
Alternative names: CHEVRON STATION #91319
![Zip code 91405 marital status for males]()
![Zip code 91405 marital status for females]()
Housing units lacking complete plumbing facilities: 1.2%
Housing units lacking complete kitchen facilities: 5.6%

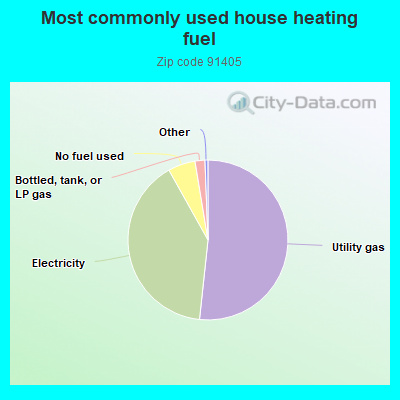
- 51.7%Utility gas
- 40.2%Electricity
- 5.5%No fuel used
- 2.0%Bottled, tank, or LP gas
Population in 1990: 39,669. Population change in the 1990s: +11,675 (+29.4%).
Place of birth for U.S.-born residents:
- This state: 23,605
- Northeast: 1,595
- Midwest: 1,274
- South: 1,195
- West: 834
43% of the 91405 zip code residents lived in the same house 5 years ago.
Out of people who lived in different houses, 90% lived in this county.
Out of people who lived in different counties, 50% lived in California.
90% of the 91405 zip code residents lived in the same house 1 year ago.
Out of people who lived in different houses, 80% moved from this county.
Out of people who lived in different houses, 5% moved from different county within same state.
Out of people who lived in different houses, 8% moved from different state.
Out of people who lived in different houses, 5% moved from abroad.
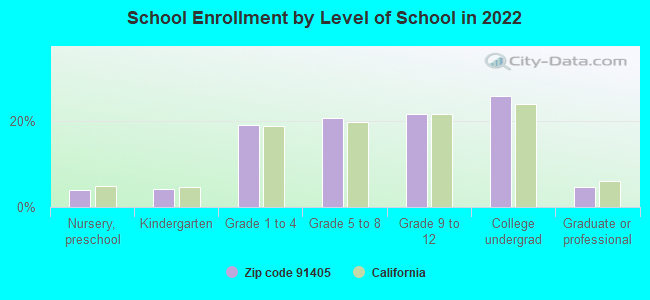
Private vs. public school enrollment:
Students in private schools in grades 1 to 8 (elementary and middle school): 366
| Here: | 6.7% |
| California: | 10.5% |
159
Students in private undergraduate colleges: 674
| Here: | 18.8% |
| California: | 15.9% |

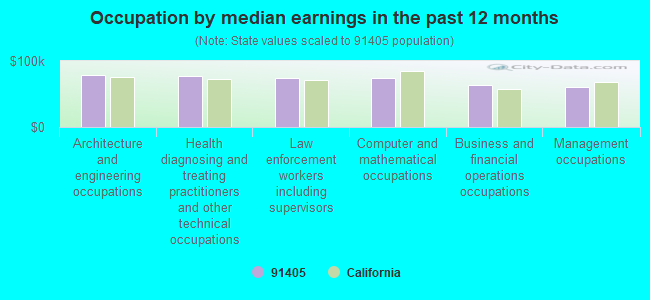
- Occupation by median earnings in the past 12 months ($)
- 79,344Architecture and engineering occupations
- 76,725Health diagnosing and treating practitioners and other technical occupations
- 74,279Law enforcement workers including supervisors
- 74,261Computer and mathematical occupations
- 62,956Business and financial operations occupations
- 60,537Management occupations
Companies with federal contracts located in this zip code (VAN NUYS, CA):
- LEES MAINTENANCE SERVICE, INC. (14740 KESWICK ST; small business) : $18,068,208 in 80 contracts from 1999 to 2005
Contracts for Custodial Janitorial Services, Water Pollution -- Advanced Development (R&D) by Navy, NATIONAL ARCHIVES AND RECORDS ADMINISTRATION
Signed by year: 2000: $3,647,272; 2001: $2,643,291; 2002: $2,768,231; 2003: $5,100,408; 2004: $1,344,960; 2005: $172,693; 2006: $0.
Biggest contracts:
$2,550,013 with Navy for Custodial Janitorial Services. Signed on 2002-10-15. Completion date: 2003-10-16.
$2,495,683, same as above. Signed on 2003-10-15. Completion date: 2004-10-14.
$2,495,683, same as above. Signed on 2003-10-15. Completion date: 2004-10-14.
$2,433,129, same as above. Signed on 2001-10-15. Completion date: 2002-10-14.
- CRAIG PACKAGING PRODUCTS (7561 WOODMAN PL; small business) : $151,533 in 4 contracts from 2000 to 2005
$56,306 with Army for Drafting, Surveying, and Mapping Instruments. Signed on 2003-10-10. Completion date: 2003-11-30.
$48,096, same as above. Signed on 2005-10-31. Completion date: 2006-01-30.
$33,193, same as above. Signed on 2000-03-15. Completion date: 2000-04-28.
$13,938, same as above. Signed on 2003-02-07. Completion date: 2003-03-30.
- ONYX TECHNOLOGIES (6741 VAN NUYS BLVD; small business)
$9,948 with Army for Office Supplies. Taking place in GA. Signed on 2004-06-04. Completion date: 2004-06-04.
- BURTREE INC (13513 SHERMAN WAY; small business)
750 employees, $0 revenue. Woman Owned Business
$5,424 with Defense Logistics Agency for Radar Equipment, Airborne. Signed on 2006-01-07. Completion date: 2006-02-21.
- CAPITAL DATA PRODUCTS (15030 KESWICK STREET; small business)
$3,876 with Army for Children's and Infants' Apparel and Accessories. Signed on 2004-04-21. Completion date: 2004-04-30.
- NIGEL B INC (14141 COVELLO STREET UNIT; small business)
$3,100 with Department of Defense for Miscellaneous Furniture and Fixtures. Signed on 2002-06-10. Completion date: 2002-07-19.
Top industries in this zip code by the number of employees in 2005:
- Health Care and Social Assistance: General Medical and Surgical Hospitals (over 1000 employees: 1 establishment, 500-999 employees: 1 establishment)
- Health Care and Social Assistance: Offices of Physicians (except Mental Health Specialists) (100-249: 1, 50-99: 3, 20-49: 5, 10-19: 8, 5-9: 21, 1-4: 68)
- Health Care and Social Assistance: Medical Laboratories (500-999: 1, 10-19: 1, 5-9: 2, 1-4: 1)
- Information: Wired Telecommunications Carriers (250-499: 1, 50-99: 1, 20-49: 1, 10-19: 1, 5-9: 1, 1-4: 1)
- Accommodation and Food Services: Limited-Service Restaurants (50-99: 1, 20-49: 6, 10-19: 9, 5-9: 1, 1-4: 14)
- Administrative and Support and Waste Management and Remediation Services: Janitorial Services (250-499: 1, 10-19: 1, 1-4: 3)
- Other Services (except Public Administration): Religious Organizations (100-249: 1, 20-49: 2, 5-9: 2, 1-4: 1)
- Construction: Plumbing, Heating, and Air-Conditioning Contractors (50-99: 1, 20-49: 2, 10-19: 1, 5-9: 6, 1-4: 7)
- Health Care and Social Assistance: Child and Youth Services (100-249: 1, 20-49: 1, 1-4: 1)
People in group quarters in 2010:
- 276 people in nursing facilities/skilled-nursing facilities
- 117 people in workers' group living quarters and job corps centers
- 101 people in group homes intended for adults
- 72 people in other noninstitutional facilities
- 30 people in group homes for juveniles (non-correctional)
- 10 people in local jails and other municipal confinement facilities
- 6 people in correctional facilities intended for juveniles
People in group quarters in 2000:
- 315 people in nursing homes
- 136 people in other noninstitutional group quarters
- 28 people in unknown juvenile institutions
- 7 people in other group homes
- 7 people in religious group quarters
- 6 people in homes or halfway houses for drug/alcohol abuse
Fatal accident statistics in 2014:
- Fatal accident count: 3
- Vehicles involved in fatal accidents: 4
- Fatal accidents caused by drunken drivers: 0
- Fatalities: 3
- Persons involved in fatal accidents: 5
- Pedestrians involved in fatal accidents: 2
Fatal accident statistics in 2013:
- Fatal accident count: 2
- Vehicles involved in fatal accidents: 2
- Fatal accidents caused by drunken drivers: 0
- Fatalities: 2
- Persons involved in fatal accidents: 2
- Pedestrians involved in fatal accidents: 2
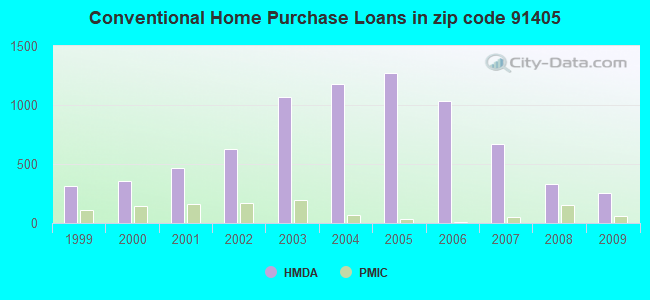
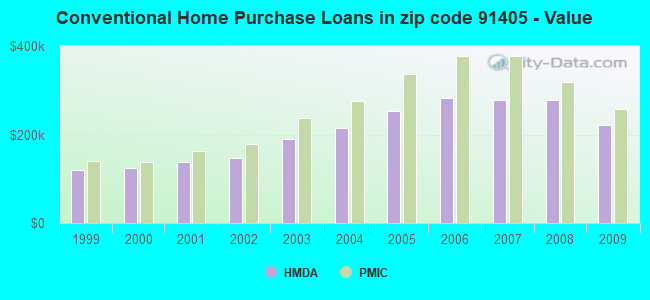
Home Mortgage Disclosure Act Aggregated Statistics For Year 2009
(Based on 11 full and 8 partial tracts)
|
| A) FHA, FSA/RHS & VA
Home Purchase Loans | B) Conventional
Home Purchase Loans | C) Refinancings
| D) Home Improvement Loans
| E) Loans on Dwellings For 5+ Families
| F) Non-occupant Loans on
< 5 Family Dwellings (A B C & D) | G) Loans On Manufactured
Home Dwelling (A B C & D) |
|---|
| Number | Average Value | Number | Average Value | Number | Average Value | Number | Average Value | Number | Average Value | Number | Average Value | Number | Average Value |
|---|
| LOANS ORIGINATED | 122 | $255,683 | 255 | $220,352 | 391 | $232,087 | 27 | $177,477 | 20 | $1,582,280 | 68 | $185,935 | 2 | $73,680 |
| APPLICATIONS APPROVED, NOT ACCEPTED | 20 | $249,180 | 57 | $221,818 | 70 | $255,032 | 2 | $35,500 | 2 | $599,760 | 8 | $229,838 | 6 | $66,475 |
| APPLICATIONS DENIED | 55 | $248,540 | 83 | $229,077 | 264 | $277,096 | 24 | $98,797 | 6 | $1,436,540 | 35 | $200,353 | 6 | $76,033 |
| APPLICATIONS WITHDRAWN | 32 | $260,255 | 60 | $240,388 | 113 | $246,104 | 16 | $154,518 | 3 | $990,113 | 24 | $214,185 | 0 | $0 |
| FILES CLOSED FOR INCOMPLETENESS | 9 | $262,167 | 21 | $238,478 | 33 | $283,763 | 2 | $19,650 | 0 | $0 | 4 | $127,352 | 0 | $0 |
Aggregated Statistics For Year 2008
(Based on 11 full and 8 partial tracts)
|
| A) FHA, FSA/RHS & VA
Home Purchase Loans | B) Conventional
Home Purchase Loans | C) Refinancings
| D) Home Improvement Loans
| E) Loans on Dwellings For 5+ Families
| F) Non-occupant Loans on
< 5 Family Dwellings (A B C & D) | G) Loans On Manufactured
Home Dwelling (A B C & D) |
|---|
| Number | Average Value | Number | Average Value | Number | Average Value | Number | Average Value | Number | Average Value | Number | Average Value | Number | Average Value |
|---|
| LOANS ORIGINATED | 47 | $286,135 | 328 | $277,198 | 325 | $260,813 | 33 | $148,719 | 42 | $1,868,627 | 103 | $243,469 | 8 | $72,055 |
| APPLICATIONS APPROVED, NOT ACCEPTED | 4 | $342,538 | 50 | $275,781 | 100 | $281,754 | 8 | $126,530 | 3 | $4,005,667 | 19 | $224,088 | 3 | $75,893 |
| APPLICATIONS DENIED | 23 | $283,252 | 165 | $292,704 | 350 | $308,490 | 57 | $171,901 | 3 | $1,098,533 | 70 | $292,459 | 13 | $76,665 |
| APPLICATIONS WITHDRAWN | 13 | $221,478 | 82 | $292,352 | 139 | $310,504 | 15 | $148,866 | 2 | $1,474,400 | 21 | $295,114 | 0 | $0 |
| FILES CLOSED FOR INCOMPLETENESS | 4 | $246,585 | 33 | $343,284 | 51 | $346,675 | 7 | $286,124 | 0 | $0 | 14 | $303,412 | 0 | $0 |
Aggregated Statistics For Year 2007
(Based on 11 full and 8 partial tracts)
|
| A) FHA, FSA/RHS & VA
Home Purchase Loans | B) Conventional
Home Purchase Loans | C) Refinancings
| D) Home Improvement Loans
| E) Loans on Dwellings For 5+ Families
| F) Non-occupant Loans on
< 5 Family Dwellings (A B C & D) | G) Loans On Manufactured
Home Dwelling (A B C & D) |
|---|
| Number | Average Value | Number | Average Value | Number | Average Value | Number | Average Value | Number | Average Value | Number | Average Value | Number | Average Value |
|---|
| LOANS ORIGINATED | 1 | $198,850 | 666 | $278,612 | 928 | $318,263 | 129 | $241,302 | 74 | $1,577,136 | 111 | $327,643 | 12 | $91,811 |
| APPLICATIONS APPROVED, NOT ACCEPTED | 1 | $201,340 | 202 | $303,789 | 257 | $330,556 | 39 | $237,195 | 3 | $1,453,450 | 25 | $344,122 | 13 | $123,326 |
| APPLICATIONS DENIED | 0 | $0 | 409 | $316,362 | 764 | $360,461 | 80 | $253,674 | 8 | $692,682 | 69 | $377,223 | 21 | $86,490 |
| APPLICATIONS WITHDRAWN | 0 | $0 | 150 | $304,246 | 278 | $349,089 | 31 | $276,030 | 4 | $512,630 | 25 | $345,450 | 0 | $0 |
| FILES CLOSED FOR INCOMPLETENESS | 0 | $0 | 51 | $330,910 | 109 | $355,522 | 16 | $175,326 | 0 | $0 | 11 | $340,956 | 0 | $0 |
Aggregated Statistics For Year 2006
(Based on 11 full and 8 partial tracts)
|
| A) FHA, FSA/RHS & VA
Home Purchase Loans | B) Conventional
Home Purchase Loans | C) Refinancings
| D) Home Improvement Loans
| E) Loans on Dwellings For 5+ Families
| F) Non-occupant Loans on
< 5 Family Dwellings (A B C & D) | G) Loans On Manufactured
Home Dwelling (A B C & D) |
|---|
| Number | Average Value | Number | Average Value | Number | Average Value | Number | Average Value | Number | Average Value | Number | Average Value | Number | Average Value |
|---|
| LOANS ORIGINATED | 1 | $267,000 | 1,037 | $282,093 | 1,385 | $325,160 | 179 | $264,815 | 98 | $1,437,836 | 179 | $323,023 | 12 | $51,837 |
| APPLICATIONS APPROVED, NOT ACCEPTED | 0 | $0 | 194 | $285,138 | 304 | $325,087 | 38 | $193,540 | 3 | $1,999,620 | 55 | $351,775 | 2 | $101,960 |
| APPLICATIONS DENIED | 2 | $204,065 | 425 | $290,957 | 673 | $350,361 | 96 | $300,084 | 4 | $882,495 | 68 | $412,179 | 10 | $65,976 |
| APPLICATIONS WITHDRAWN | 1 | $273,770 | 230 | $306,194 | 553 | $334,428 | 45 | $211,750 | 3 | $671,300 | 41 | $423,044 | 0 | $0 |
| FILES CLOSED FOR INCOMPLETENESS | 0 | $0 | 51 | $298,194 | 134 | $349,971 | 21 | $271,490 | 2 | $741,750 | 8 | $317,419 | 0 | $0 |
Aggregated Statistics For Year 2005
(Based on 11 full and 8 partial tracts)
|
| A) FHA, FSA/RHS & VA
Home Purchase Loans | B) Conventional
Home Purchase Loans | C) Refinancings
| D) Home Improvement Loans
| E) Loans on Dwellings For 5+ Families
| F) Non-occupant Loans on
< 5 Family Dwellings (A B C & D) | G) Loans On Manufactured
Home Dwelling (A B C & D) |
|---|
| Number | Average Value | Number | Average Value | Number | Average Value | Number | Average Value | Number | Average Value | Number | Average Value | Number | Average Value |
|---|
| LOANS ORIGINATED | 0 | $0 | 1,275 | $253,141 | 1,707 | $278,526 | 194 | $221,344 | 115 | $1,448,199 | 179 | $277,820 | 26 | $68,642 |
| APPLICATIONS APPROVED, NOT ACCEPTED | 0 | $0 | 223 | $258,127 | 319 | $278,323 | 35 | $242,523 | 2 | $1,404,870 | 45 | $318,332 | 6 | $79,460 |
| APPLICATIONS DENIED | 4 | $81,098 | 537 | $255,658 | 708 | $294,656 | 92 | $187,161 | 8 | $815,140 | 51 | $326,021 | 17 | $69,856 |
| APPLICATIONS WITHDRAWN | 0 | $0 | 219 | $238,946 | 597 | $280,233 | 52 | $223,667 | 1 | $994,440 | 42 | $297,420 | 6 | $69,662 |
| FILES CLOSED FOR INCOMPLETENESS | 0 | $0 | 41 | $256,137 | 182 | $336,125 | 14 | $205,934 | 1 | $907,520 | 11 | $260,484 | 0 | $0 |
Aggregated Statistics For Year 2004
(Based on 11 full and 8 partial tracts)
|
| A) FHA, FSA/RHS & VA
Home Purchase Loans | B) Conventional
Home Purchase Loans | C) Refinancings
| D) Home Improvement Loans
| E) Loans on Dwellings For 5+ Families
| F) Non-occupant Loans on
< 5 Family Dwellings (A B C & D) | G) Loans On Manufactured
Home Dwelling (A B C & D) |
|---|
| Number | Average Value | Number | Average Value | Number | Average Value | Number | Average Value | Number | Average Value | Number | Average Value | Number | Average Value |
|---|
| LOANS ORIGINATED | 1 | $88,680 | 1,179 | $215,167 | 1,947 | $222,664 | 155 | $201,402 | 109 | $1,218,737 | 192 | $222,540 | 6 | $40,025 |
| APPLICATIONS APPROVED, NOT ACCEPTED | 0 | $0 | 214 | $234,358 | 358 | $242,439 | 35 | $135,145 | 5 | $1,139,648 | 18 | $206,135 | 2 | $41,260 |
| APPLICATIONS DENIED | 0 | $0 | 371 | $209,339 | 671 | $233,107 | 164 | $131,432 | 9 | $669,270 | 79 | $231,557 | 16 | $54,934 |
| APPLICATIONS WITHDRAWN | 1 | $239,940 | 200 | $220,083 | 525 | $239,234 | 44 | $160,932 | 3 | $736,730 | 24 | $235,910 | 5 | $76,416 |
| FILES CLOSED FOR INCOMPLETENESS | 0 | $0 | 52 | $191,340 | 183 | $235,186 | 14 | $72,723 | 2 | $764,380 | 4 | $194,918 | 2 | $35,605 |
Aggregated Statistics For Year 2003
(Based on 11 full and 8 partial tracts)
|
| A) FHA, FSA/RHS & VA
Home Purchase Loans | B) Conventional
Home Purchase Loans | C) Refinancings
| D) Home Improvement Loans
| E) Loans on Dwellings For 5+ Families
| F) Non-occupant Loans on
< 5 Family Dwellings (A B C & D) |
|---|
| Number | Average Value | Number | Average Value | Number | Average Value | Number | Average Value | Number | Average Value | Number | Average Value |
|---|
| LOANS ORIGINATED | 35 | $176,539 | 1,066 | $190,600 | 2,825 | $174,978 | 47 | $57,714 | 160 | $985,289 | 227 | $167,376 |
| APPLICATIONS APPROVED, NOT ACCEPTED | 6 | $186,863 | 185 | $208,534 | 460 | $177,835 | 19 | $73,311 | 0 | $0 | 40 | $172,936 |
| APPLICATIONS DENIED | 1 | $267,940 | 233 | $177,790 | 783 | $182,329 | 59 | $66,071 | 11 | $1,216,499 | 62 | $172,078 |
| APPLICATIONS WITHDRAWN | 11 | $158,161 | 126 | $205,159 | 658 | $182,991 | 21 | $60,820 | 4 | $1,142,858 | 35 | $174,149 |
| FILES CLOSED FOR INCOMPLETENESS | 1 | $264,650 | 37 | $194,305 | 170 | $171,872 | 2 | $26,400 | 0 | $0 | 6 | $135,957 |
Aggregated Statistics For Year 2002
(Based on 6 full and 6 partial tracts)
|
| A) FHA, FSA/RHS & VA
Home Purchase Loans | B) Conventional
Home Purchase Loans | C) Refinancings
| D) Home Improvement Loans
| E) Loans on Dwellings For 5+ Families
| F) Non-occupant Loans on
< 5 Family Dwellings (A B C & D) |
|---|
| Number | Average Value | Number | Average Value | Number | Average Value | Number | Average Value | Number | Average Value | Number | Average Value |
|---|
| LOANS ORIGINATED | 86 | $153,349 | 628 | $147,097 | 1,159 | $157,010 | 29 | $43,863 | 78 | $1,220,302 | 91 | $133,271 |
| APPLICATIONS APPROVED, NOT ACCEPTED | 10 | $154,752 | 91 | $138,495 | 229 | $159,573 | 8 | $25,079 | 2 | $899,640 | 17 | $107,975 |
| APPLICATIONS DENIED | 7 | $182,166 | 155 | $140,525 | 326 | $146,858 | 42 | $35,736 | 9 | $908,189 | 34 | $125,864 |
| APPLICATIONS WITHDRAWN | 6 | $172,878 | 93 | $157,025 | 303 | $167,319 | 18 | $47,388 | 13 | $730,528 | 13 | $123,146 |
| FILES CLOSED FOR INCOMPLETENESS | 2 | $99,890 | 29 | $171,336 | 71 | $149,233 | 1 | $16,640 | 9 | $1,479,297 | 2 | $151,800 |
Aggregated Statistics For Year 2001
(Based on 6 full and 6 partial tracts)
|
| A) FHA, FSA/RHS & VA
Home Purchase Loans | B) Conventional
Home Purchase Loans | C) Refinancings
| D) Home Improvement Loans
| E) Loans on Dwellings For 5+ Families
| F) Non-occupant Loans on
< 5 Family Dwellings (A B C & D) |
|---|
| Number | Average Value | Number | Average Value | Number | Average Value | Number | Average Value | Number | Average Value | Number | Average Value |
|---|
| LOANS ORIGINATED | 123 | $144,636 | 464 | $137,417 | 850 | $143,242 | 49 | $32,596 | 54 | $956,171 | 75 | $130,315 |
| APPLICATIONS APPROVED, NOT ACCEPTED | 20 | $175,990 | 56 | $135,040 | 138 | $146,444 | 5 | $45,196 | 1 | $420,990 | 7 | $139,277 |
| APPLICATIONS DENIED | 24 | $145,778 | 127 | $113,393 | 323 | $133,317 | 64 | $38,459 | 3 | $420,573 | 20 | $96,598 |
| APPLICATIONS WITHDRAWN | 22 | $152,789 | 82 | $127,648 | 249 | $141,274 | 25 | $38,526 | 11 | $1,243,104 | 22 | $154,717 |
| FILES CLOSED FOR INCOMPLETENESS | 1 | $271,500 | 20 | $142,131 | 73 | $174,231 | 3 | $40,570 | 14 | $1,356,393 | 2 | $273,000 |
Aggregated Statistics For Year 2000
(Based on 6 full and 6 partial tracts)
|
| A) FHA, FSA/RHS & VA
Home Purchase Loans | B) Conventional
Home Purchase Loans | C) Refinancings
| D) Home Improvement Loans
| E) Loans on Dwellings For 5+ Families
| F) Non-occupant Loans on
< 5 Family Dwellings (A B C & D) |
|---|
| Number | Average Value | Number | Average Value | Number | Average Value | Number | Average Value | Number | Average Value | Number | Average Value |
|---|
| LOANS ORIGINATED | 91 | $128,609 | 354 | $123,775 | 216 | $124,794 | 28 | $24,581 | 45 | $641,991 | 34 | $100,873 |
| APPLICATIONS APPROVED, NOT ACCEPTED | 11 | $119,020 | 41 | $144,926 | 64 | $138,466 | 25 | $24,564 | 0 | $0 | 8 | $117,558 |
| APPLICATIONS DENIED | 17 | $154,766 | 108 | $117,295 | 206 | $109,416 | 49 | $19,552 | 6 | $1,175,857 | 17 | $68,246 |
| APPLICATIONS WITHDRAWN | 11 | $109,992 | 53 | $124,910 | 145 | $109,400 | 9 | $47,730 | 7 | $756,073 | 13 | $110,523 |
| FILES CLOSED FOR INCOMPLETENESS | 11 | $188,805 | 12 | $74,542 | 48 | $131,271 | 2 | $54,125 | 7 | $1,081,639 | 5 | $106,372 |
Aggregated Statistics For Year 1999
(Based on 4 full and 6 partial tracts)
|
| A) FHA, FSA/RHS & VA
Home Purchase Loans | B) Conventional
Home Purchase Loans | C) Refinancings
| D) Home Improvement Loans
| E) Loans on Dwellings For 5+ Families
| F) Non-occupant Loans on
< 5 Family Dwellings (A B C & D) |
|---|
| Number | Average Value | Number | Average Value | Number | Average Value | Number | Average Value | Number | Average Value | Number | Average Value |
|---|
| LOANS ORIGINATED | 121 | $125,460 | 311 | $120,750 | 441 | $121,555 | 63 | $16,589 | 35 | $539,323 | 61 | $89,683 |
| APPLICATIONS APPROVED, NOT ACCEPTED | 8 | $143,980 | 39 | $126,084 | 96 | $117,700 | 36 | $25,628 | 0 | $0 | 12 | $99,937 |
| APPLICATIONS DENIED | 22 | $117,316 | 67 | $107,649 | 227 | $112,141 | 50 | $24,033 | 5 | $853,332 | 14 | $102,557 |
| APPLICATIONS WITHDRAWN | 13 | $125,673 | 65 | $126,095 | 173 | $121,666 | 4 | $49,330 | 2 | $255,280 | 6 | $106,860 |
| FILES CLOSED FOR INCOMPLETENESS | 6 | $142,353 | 13 | $142,555 | 54 | $136,546 | 1 | $18,000 | 11 | $953,355 | 6 | $146,048 |
Private Mortgage Insurance Companies Aggregated Statistics For Year 2009
(Based on 11 full and 8 partial tracts)
|
| A) Conventional
Home Purchase Loans | B) Refinancings
| C) Non-occupant Loans on
< 5 Family Dwellings (A & B) |
|---|
| Number | Average Value | Number | Average Value | Number | Average Value |
|---|
| LOANS ORIGINATED | 56 | $258,099 | 8 | $311,188 | 1 | $294,080 |
| APPLICATIONS APPROVED, NOT ACCEPTED | 47 | $276,734 | 3 | $383,770 | 2 | $277,745 |
| APPLICATIONS DENIED | 10 | $217,555 | 2 | $339,455 | 0 | $0 |
| APPLICATIONS WITHDRAWN | 7 | $282,683 | 2 | $302,580 | 0 | $0 |
| FILES CLOSED FOR INCOMPLETENESS | 2 | $364,265 | 0 | $0 | 1 | $294,080 |
Aggregated Statistics For Year 2008
(Based on 11 full and 8 partial tracts)
|
| A) Conventional
Home Purchase Loans | B) Refinancings
| C) Non-occupant Loans on
< 5 Family Dwellings (A & B) |
|---|
| Number | Average Value | Number | Average Value | Number | Average Value |
|---|
| LOANS ORIGINATED | 151 | $319,294 | 12 | $395,745 | 2 | $381,220 |
| APPLICATIONS APPROVED, NOT ACCEPTED | 47 | $352,563 | 21 | $350,258 | 3 | $394,390 |
| APPLICATIONS DENIED | 21 | $312,469 | 8 | $341,680 | 6 | $333,178 |
| APPLICATIONS WITHDRAWN | 14 | $316,179 | 7 | $316,503 | 8 | $278,670 |
| FILES CLOSED FOR INCOMPLETENESS | 0 | $0 | 1 | $617,340 | 0 | $0 |
Aggregated Statistics For Year 2007
(Based on 11 full and 8 partial tracts)
|
| A) Conventional
Home Purchase Loans | B) Refinancings
| C) Non-occupant Loans on
< 5 Family Dwellings (A & B) |
|---|
| Number | Average Value | Number | Average Value | Number | Average Value |
|---|
| LOANS ORIGINATED | 51 | $378,040 | 17 | $379,570 | 5 | $247,650 |
| APPLICATIONS APPROVED, NOT ACCEPTED | 5 | $366,986 | 4 | $413,625 | 2 | $358,575 |
| APPLICATIONS DENIED | 3 | $637,027 | 4 | $450,975 | 2 | $575,685 |
| APPLICATIONS WITHDRAWN | 5 | $296,236 | 7 | $429,800 | 3 | $211,010 |
| FILES CLOSED FOR INCOMPLETENESS | 0 | $0 | 2 | $286,475 | 0 | $0 |
Aggregated Statistics For Year 2006
(Based on 10 full and 6 partial tracts)
|
| A) Conventional
Home Purchase Loans | B) Refinancings
|
|---|
| Number | Average Value | Number | Average Value |
|---|
| LOANS ORIGINATED | 6 | $377,527 | 14 | $380,978 |
| APPLICATIONS APPROVED, NOT ACCEPTED | 3 | $382,887 | 7 | $416,630 |
| APPLICATIONS DENIED | 0 | $0 | 1 | $812,670 |
| APPLICATIONS WITHDRAWN | 0 | $0 | 0 | $0 |
| FILES CLOSED FOR INCOMPLETENESS | 0 | $0 | 0 | $0 |
Aggregated Statistics For Year 2005
(Based on 10 full and 8 partial tracts)
|
| A) Conventional
Home Purchase Loans | B) Refinancings
| C) Non-occupant Loans on
< 5 Family Dwellings (A & B) |
|---|
| Number | Average Value | Number | Average Value | Number | Average Value |
|---|
| LOANS ORIGINATED | 33 | $335,874 | 14 | $319,167 | 1 | $420,000 |
| APPLICATIONS APPROVED, NOT ACCEPTED | 5 | $321,216 | 9 | $271,103 | 0 | $0 |
| APPLICATIONS DENIED | 2 | $421,505 | 3 | $578,070 | 1 | $706,110 |
| APPLICATIONS WITHDRAWN | 4 | $301,108 | 3 | $366,830 | 2 | $202,375 |
| FILES CLOSED FOR INCOMPLETENESS | 1 | $291,670 | 0 | $0 | 0 | $0 |
Aggregated Statistics For Year 2004
(Based on 11 full and 8 partial tracts)
|
| A) Conventional
Home Purchase Loans | B) Refinancings
| C) Non-occupant Loans on
< 5 Family Dwellings (A & B) |
|---|
| Number | Average Value | Number | Average Value | Number | Average Value |
|---|
| LOANS ORIGINATED | 65 | $275,271 | 19 | $312,664 | 6 | $279,863 |
| APPLICATIONS APPROVED, NOT ACCEPTED | 24 | $271,992 | 8 | $258,894 | 2 | $212,005 |
| APPLICATIONS DENIED | 2 | $361,525 | 0 | $0 | 0 | $0 |
| APPLICATIONS WITHDRAWN | 7 | $182,799 | 0 | $0 | 0 | $0 |
| FILES CLOSED FOR INCOMPLETENESS | 2 | $320,295 | 0 | $0 | 0 | $0 |
Aggregated Statistics For Year 2003
(Based on 11 full and 8 partial tracts)
|
| A) Conventional
Home Purchase Loans | B) Refinancings
| C) Non-occupant Loans on
< 5 Family Dwellings (A & B) |
|---|
| Number | Average Value | Number | Average Value | Number | Average Value |
|---|
| LOANS ORIGINATED | 193 | $237,921 | 80 | $206,310 | 12 | $231,033 |
| APPLICATIONS APPROVED, NOT ACCEPTED | 42 | $246,627 | 25 | $206,504 | 3 | $229,807 |
| APPLICATIONS DENIED | 3 | $191,677 | 0 | $0 | 1 | $254,590 |
| APPLICATIONS WITHDRAWN | 8 | $271,212 | 6 | $237,070 | 1 | $210,060 |
| FILES CLOSED FOR INCOMPLETENESS | 0 | $0 | 1 | $138,360 | 0 | $0 |
Aggregated Statistics For Year 2002
(Based on 6 full and 6 partial tracts)
|
| A) Conventional
Home Purchase Loans | B) Refinancings
| C) Non-occupant Loans on
< 5 Family Dwellings (A & B) |
|---|
| Number | Average Value | Number | Average Value | Number | Average Value |
|---|
| LOANS ORIGINATED | 166 | $179,237 | 67 | $186,381 | 4 | $181,625 |
| APPLICATIONS APPROVED, NOT ACCEPTED | 45 | $171,353 | 23 | $181,472 | 0 | $0 |
| APPLICATIONS DENIED | 5 | $158,864 | 2 | $221,040 | 2 | $91,365 |
| APPLICATIONS WITHDRAWN | 4 | $184,820 | 0 | $0 | 0 | $0 |
| FILES CLOSED FOR INCOMPLETENESS | 2 | $165,945 | 2 | $216,130 | 0 | $0 |
Aggregated Statistics For Year 2001
(Based on 6 full and 6 partial tracts)
|
| A) Conventional
Home Purchase Loans | B) Refinancings
| C) Non-occupant Loans on
< 5 Family Dwellings (A & B) |
|---|
| Number | Average Value | Number | Average Value | Number | Average Value |
|---|
| LOANS ORIGINATED | 165 | $163,513 | 55 | $168,366 | 15 | $145,145 |
| APPLICATIONS APPROVED, NOT ACCEPTED | 34 | $117,669 | 13 | $235,437 | 0 | $0 |
| APPLICATIONS DENIED | 16 | $110,979 | 6 | $179,668 | 4 | $83,570 |
| APPLICATIONS WITHDRAWN | 4 | $156,902 | 5 | $198,112 | 0 | $0 |
| FILES CLOSED FOR INCOMPLETENESS | 0 | $0 | 2 | $229,910 | 0 | $0 |
Aggregated Statistics For Year 2000
(Based on 6 full and 6 partial tracts)
|
| A) Conventional
Home Purchase Loans | B) Refinancings
| C) Non-occupant Loans on
< 5 Family Dwellings (A & B) |
|---|
| Number | Average Value | Number | Average Value | Number | Average Value |
|---|
| LOANS ORIGINATED | 143 | $137,168 | 34 | $161,339 | 3 | $123,757 |
| APPLICATIONS APPROVED, NOT ACCEPTED | 29 | $135,362 | 12 | $128,473 | 0 | $0 |
| APPLICATIONS DENIED | 8 | $131,501 | 2 | $116,955 | 0 | $0 |
| APPLICATIONS WITHDRAWN | 2 | $165,245 | 1 | $84,400 | 0 | $0 |
| FILES CLOSED FOR INCOMPLETENESS | 0 | $0 | 0 | $0 | 0 | $0 |
Aggregated Statistics For Year 1999
(Based on 4 full and 6 partial tracts)
|
| A) Conventional
Home Purchase Loans | B) Refinancings
| C) Non-occupant Loans on
< 5 Family Dwellings (A & B) |
|---|
| Number | Average Value | Number | Average Value | Number | Average Value |
|---|
| LOANS ORIGINATED | 107 | $139,095 | 57 | $140,357 | 4 | $108,375 |
| APPLICATIONS APPROVED, NOT ACCEPTED | 16 | $125,678 | 14 | $153,926 | 4 | $85,060 |
| APPLICATIONS DENIED | 11 | $108,171 | 5 | $160,378 | 0 | $0 |
| APPLICATIONS WITHDRAWN | 9 | $145,860 | 3 | $137,590 | 0 | $0 |
| FILES CLOSED FOR INCOMPLETENESS | 1 | $142,000 | 0 | $0 | 0 | $0 |
2005 - 2018 National Fire Incident Reporting System (NFIRS) incidents
See full 2006 National Fire Incident Reporting System statistics for zip code 91405, California
| Most common first names in zip code 91405 among deceased individuals |
| Name | Count | Lived (average) |
|---|
| John | 163 | 71.6 years |
| Mary | 132 | 80.6 years |
| William | 124 | 72.1 years |
| Robert | 116 | 72.0 years |
| Joseph | 101 | 74.8 years |
| George | 87 | 75.5 years |
| Charles | 86 | 75.8 years |
| James | 81 | 68.2 years |
| Ruth | 76 | 81.3 years |
| Frank | 74 | 78.0 years |
| Most common last names in zip code 91405 among deceased individuals |
| Last name | Count | Lived (average) |
|---|
| Johnson | 44 | 75.4 years |
| Smith | 40 | 76.9 years |
| Brown | 29 | 74.6 years |
| Miller | 28 | 79.0 years |
| Williams | 26 | 76.4 years |
| Davis | 26 | 75.4 years |
| Kim | 25 | 76.8 years |
| Wilson | 25 | 76.1 years |
| Jones | 24 | 72.3 years |
| Anderson | 22 | 78.2 years |
| Businesses in zip code 91405 |
| Name | Count | | Name | Count |
| 99 Cents Only Stores | 1 | | McDonald's | 2 |
| Arby's | 1 | | Motel 6 | 1 |
| Baskin-Robbins | 1 | | New Balance | 1 |
| Blockbuster | 1 | | Nike | 2 |
| CVS | 1 | | Papa John's Pizza | 1 |
| Carl\s Jr. | 1 | | Payless | 1 |
| DHL | 2 | | Pizza Hut | 1 |
| Dennys | 1 | | Quiznos | 1 |
| Domino's Pizza | 1 | | RadioShack | 1 |
| FedEx | 3 | | Rite Aid | 1 |
| GNC | 1 | | Studio 6 | 1 |
| H&R Block | 3 | | Subway | 2 |
| Jones New York | 2 | | T-Mobile | 2 |
| KFC | 2 | | Target | 1 |
| Kroger | 1 | | U-Haul | 1 |
| Lane Furniture | 1 | | Walgreens | 1 |
| Little Caesars Pizza | 1 | | YMCA | 1 |
| MasterBrand Cabinets | 2 | | | |