Estimated zip code population in 2022: 51,225
Zip code population in 2010: 56,343
Zip code population in 2000: 57,129
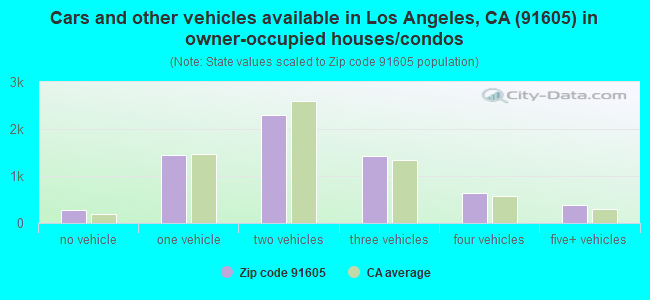
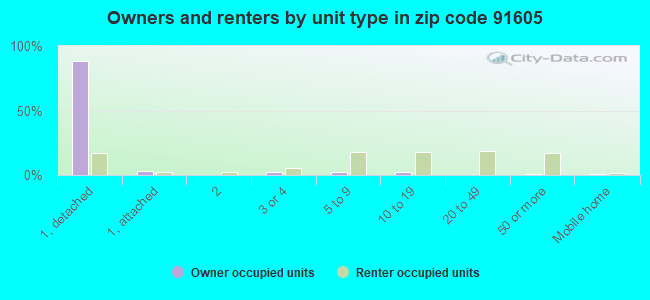
Houses and condos: 17,494
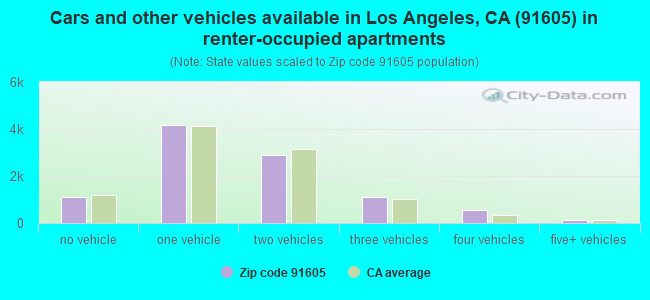
Renter-occupied apartments: 9,925
| % of renters here: | 60% |
| State: | 44% |
139.7
(high, U.S. average is 100)
Land area: 5.5
sq. mi.
Water area: 0.0
sq. mi.
| Population density: 9,375 people per square mile | | (high). |
![Age and Sex of Residents in zip code 91605]()
- OSM Map
- General Map
- Google Map
- MSN Map
- OSM Map
- General Map
- Google Map
- MSN Map
- OSM Map
- General Map
- Google Map
- MSN Map
- OSM Map
- General Map
- Google Map
- MSN Map
Please wait while loading the map...
Real estate property taxes paid for housing units in 2022:
| This zip code: | 0.6% ($4,472) |
| California: | 0.7% ($4,831) |
$5,252 (0.7%)
Median real estate property taxes paid for housing units with no mortgage in 2022: $3,222 (0.5%)

Profiles of local businesses
Business Search - 14 Million verified businesses
| Males: 25,297 |  (49.4%) (49.4%) |
| Females: 25,927 |  (50.6%) (50.6%) |
For population 25 years and over in 91605:
- High school or higher: 71.2%
- Bachelor's degree or higher: 22.4%
- Graduate or professional degree: 6.1%
- Unemployed: 7.5%
- Mean travel time to work (commute): 29.3 minutes
For population 15 years and over in 91605:
- Never married: 44.2%
- Now married: 41.2%
- Separated: 2.8%
- Widowed: 4.2%
- Divorced: 7.6%
Zip code 91605 compared to state average:
- Median household income below state average.
- Black race population percentage below state average.
- Foreign-born population percentage above state average.
- Length of stay since moving in significantly above state average.
- Percentage of population with a bachelor's degree or higher below state average.


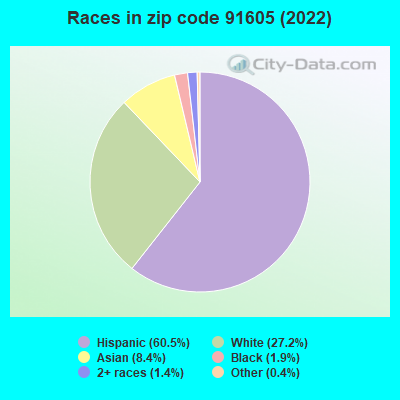
- 30,99960.5%Hispanic or Latino
- 13,95327.2%White
- 4,3028.4%Asian
- 9841.9%Black
- 7381.4%Two or more races
- 2180.4%Some other race
- 200.04%Native Hawaiian and Other
Pacific Islander
- 60.01%American Indian
Data:
100%
urban population.
Estimated median house/condo value in 2022: $740,766
| 91605: | $740,766 |
| California: | $715,900 |
According to our research of California and other state lists, there were 43 registered sex offenders living in 91605 zip code as of July 23, 2024.
The ratio of all residents to sex offenders in zip code 91605 is 1,306 to 1.
The ratio of registered sex offenders to all residents in this zip code is lower than the state average.
Median resident age:| This zip code: | 36.9 years |
| California median age: | 37.9 years |
Average household size:| This zip code: | 3.1 people |
| California: | 2.8 people |
Averages for the 2020 tax year for zip code 91605, filed in 2021:
Average Adjusted Gross Income (AGI) in 2020: $43,391 (Individual Income Tax Returns)
| Here: | $43,391 |
| State: | $95,910 |
Salary/wage: $40,806 (reported on 78.1% of returns)
| Here: | $40,806 |
| State: | $77,331 |
(% of AGI for various income ranges: 1206.9% for AGIs below $25k, 4060.0% for AGIs $25k-50k, 8079.7% for AGIs $50k-75k, 12208.9% for AGIs $75k-100k, 21745.4% for AGIs $100k-200k, 67701.1% for AGIs over 200k)
Taxable interest for individuals: $752 (reported on 18.9% of returns)
| This zip code: | $752 |
| California: | $2,294 |
(% of AGI for various income ranges: 5.5% for AGIs below $25k, 8.6% for AGIs $25k-50k, 22.6% for AGIs $50k-75k, 46.5% for AGIs $75k-100k, 101.9% for AGIs $100k-200k, 1272.2% for AGIs over 200k)
Ordinary dividends: $2,435 (reported on 6.6% of returns)
(% of AGI for various income ranges: 5.9% for AGIs below $25k, 9.9% for AGIs $25k-50k, 26.7% for AGIs $50k-75k, 36.5% for AGIs $75k-100k, 151.6% for AGIs $100k-200k, 1254.4% for AGIs over 200k)
Net capital gain/loss in AGI: +$7,790 (reported on 7.4% of returns)
| Here: | +$7,790 |
| State: | +$49,306 |
(% of AGI for various income ranges: 3.6% for AGIs below $25k, 12.8% for AGIs $25k-50k, 48.4% for AGIs $50k-75k, 181.2% for AGIs $75k-100k, 444.4% for AGIs $100k-200k, 8866.7% for AGIs over 200k)
Profit/loss from business: +$9,928 (reported on 27.7% of returns)
| Here: | +$9,928 |
| State: | +$15,671 |
(% of AGI for various income ranges: 404.2% for AGIs below $25k, 287.9% for AGIs $25k-50k, 363.8% for AGIs $50k-75k, 586.3% for AGIs $75k-100k, 952.3% for AGIs $100k-200k, 9385.6% for AGIs over 200k)
Taxable individual retirement arrangement distribution: $14,427 (reported on 2.4% of returns)
| 91605: | $14,427 |
| California: | $23,505 |
(% of AGI for various income ranges: 15.0% for AGIs below $25k, 21.5% for AGIs $25k-50k, 71.7% for AGIs $50k-75k, 161.6% for AGIs $75k-100k, 321.7% for AGIs $100k-200k, 1198.9% for AGIs over 200k)
Total itemized deductions: $32,456 (reported on 8.3% of returns)
| Here: | $32,456 |
| State: | $39,517 |
(% of AGI for various income ranges: 61.3% for AGIs below $25k, 169.2% for AGIs $25k-50k, 563.6% for AGIs $50k-75k, 1069.8% for AGIs $75k-100k, 2556.2% for AGIs $100k-200k, 15743.3% for AGIs over 200k)
Charity contributions: $4,740 (reported on 6.3% of returns)
(% of AGI for various income ranges: 2.1% for AGIs below $25k, 13.0% for AGIs $25k-50k, 51.5% for AGIs $50k-75k, 131.9% for AGIs $75k-100k, 339.5% for AGIs $100k-200k, 2167.8% for AGIs over 200k)
Taxes paid: $7,989 (reported on 8.3% of returns)
(% of AGI for various income ranges: 14.8% for AGIs below $25k, 42.3% for AGIs $25k-50k, 156.1% for AGIs $50k-75k, 314.5% for AGIs $75k-100k, 734.6% for AGIs $100k-200k, 1970.0% for AGIs over 200k)
Earned income credit: $2,003 (reported on 22.0% of returns)
(% of AGI for various income ranges: 111.0% for AGIs below $25k, 75.5% for AGIs $25k-50k, 1.3% for AGIs $50k-75k)
Percentage of individuals using paid preparers for their 2020 taxes: 91.4%
(% for various income ranges: 89.2% for AGIs below $25k, 93.0% for AGIs $25k-50k, 93.1% for AGIs $50k-75k, 93.0% for AGIs $75k-100k, 92.4% for AGIs $100k-200k, 91.4% for AGIs over 200k)
Averages for the 2012 tax year for zip code 91605, filed in 2013:
Average Adjusted Gross Income (AGI) in 2012: $33,488 (Individual Income Tax Returns)
| Here: | $33,488 |
| State: | $72,726 |
Salary/wage: $32,431 (reported on 83.0% of returns)
| Here: | $32,431 |
| State: | $59,079 |
(% of AGI for various income ranges: 75.0% for AGIs below $25k, 86.9% for AGIs $25k-50k, 85.2% for AGIs $50k-75k, 84.4% for AGIs $75k-100k, 80.3% for AGIs $100k-200k, 44.7% for AGIs over 200k)
Taxable interest for individuals: $664 (reported on 18.9% of returns)
| This zip code: | $664 |
| California: | $2,146 |
(% of AGI for various income ranges: 0.3% for AGIs below $25k, 0.3% for AGIs $25k-50k, 0.3% for AGIs $50k-75k, 0.3% for AGIs $75k-100k, 0.5% for AGIs $100k-200k, 1.2% for AGIs over 200k)
Ordinary dividends: $2,694 (reported on 5.3% of returns)
(% of AGI for various income ranges: 0.4% for AGIs below $25k, 0.2% for AGIs $25k-50k, 0.4% for AGIs $50k-75k, 0.7% for AGIs $75k-100k, 0.7% for AGIs $100k-200k, 0.8% for AGIs over 200k)
Net capital gain/loss in AGI: +$5,742 (reported on 4.5% of returns)
| Here: | +$5,742 |
| State: | +$30,460 |
(% of AGI for various income ranges: 0.3% for AGIs $75k-100k, 0.8% for AGIs $100k-200k, 11.3% for AGIs over 200k)
Profit/loss from business: +$9,969 (reported on 24.6% of returns)
| Here: | +$9,969 |
| State: | +$17,064 |
(% of AGI for various income ranges: 18.3% for AGIs below $25k, 6.2% for AGIs $25k-50k, 3.6% for AGIs $50k-75k, 2.8% for AGIs $75k-100k, 2.7% for AGIs $100k-200k, 4.9% for AGIs over 200k)
Taxable individual retirement arrangement distribution: $10,703 (reported on 2.9% of returns)
| 91605: | $10,703 |
| California: | $19,557 |
(% of AGI for various income ranges: 0.7% for AGIs below $25k, 0.7% for AGIs $25k-50k, 1.1% for AGIs $50k-75k, 1.1% for AGIs $75k-100k, 1.8% for AGIs $100k-200k)
Self-employment retirement plans: $14,200 (reported on 0.1% of returns)
| 91605: | $14,200 |
| California: | $24,530 |
Total itemized deductions: $21,931 (31% of AGI, reported on 21.8% of returns)
| Here: | $21,931 |
| State: | $34,004 |
| Here: | 31.5% of AGI |
| State: | 22.7% of AGI |
(% of AGI for various income ranges: 6.7% for AGIs below $25k, 11.8% for AGIs $25k-50k, 17.8% for AGIs $50k-75k, 19.1% for AGIs $75k-100k, 20.5% for AGIs $100k-200k, 17.8% for AGIs over 200k)
Charity contributions: $2,219 (reported on 15.8% of returns)
(% of AGI for various income ranges: 0.2% for AGIs below $25k, 0.7% for AGIs $25k-50k, 1.3% for AGIs $50k-75k, 1.6% for AGIs $75k-100k, 2.1% for AGIs $100k-200k, 1.0% for AGIs over 200k)
Taxes paid: $6,433 (reported on 21.7% of returns)
| 91605: | $6,433 |
| State: | $14,448 |
(% of AGI for various income ranges: 1.3% for AGIs below $25k, 2.7% for AGIs $25k-50k, 4.8% for AGIs $50k-75k, 5.9% for AGIs $75k-100k, 7.2% for AGIs $100k-200k, 8.8% for AGIs over 200k)
Earned income credit: $2,407 (reported on 31.1% of returns)
(% of AGI for various income ranges: 8.4% for AGIs below $25k, 1.6% for AGIs $25k-50k)
Percentage of individuals using paid preparers for their 2012 taxes: 77.5%
(% for various income ranges: 77.6% for AGIs below $25k, 77.8% for AGIs $25k-50k, 75.9% for AGIs $50k-75k, 77.4% for AGIs $75k-100k, 77.7% for AGIs $100k-200k, 83.3% for AGIs over 200k)
Averages for the 2004 tax year for zip code 91605, filed in 2005:
Average Adjusted Gross Income (AGI) in 2004: $29,808 (Individual Income Tax Returns)
| Here: | $29,808 |
| State: | $58,600 |
Salary/wage: $29,162 (reported on 85.4% of returns)
| Here: | $29,162 |
| State: | $49,455 |
(% of AGI for various income ranges: 119.4% for AGIs below $10k, 82.5% for AGIs $10k-25k, 88.5% for AGIs $25k-50k, 87.4% for AGIs $50k-75k, 85.5% for AGIs $75k-100k, 65.8% for AGIs over 100k)
Taxable interest for individuals: $1,061 (reported on 26.8% of returns)
| This zip code: | $1,061 |
| California: | $2,365 |
(% of AGI for various income ranges: 2.8% for AGIs below $10k, 0.7% for AGIs $10k-25k, 0.8% for AGIs $25k-50k, 0.8% for AGIs $50k-75k, 0.9% for AGIs $75k-100k, 1.5% for AGIs over 100k)
Taxable dividends: $1,567 (reported on 7.4% of returns)
(% of AGI for various income ranges: 0.9% for AGIs below $10k, 0.3% for AGIs $10k-25k, 0.4% for AGIs $25k-50k, 0.3% for AGIs $50k-75k, 0.4% for AGIs $75k-100k, 0.5% for AGIs over 100k)
Net capital gain/loss: +$5,489 (reported on 6.3% of returns)
| Here: | +$5,489 |
| State: | +$23,418 |
(% of AGI for various income ranges: -0.4% for AGIs below $10k, -0.1% for AGIs $10k-25k, 0.2% for AGIs $25k-50k, 0.5% for AGIs $50k-75k, 0.5% for AGIs $75k-100k, 5.7% for AGIs over 100k)
Profit/loss from business: +$9,035 (reported on 21.3% of returns)
| Here: | +$9,035 |
| State: | +$16,826 |
(% of AGI for various income ranges: 27.4% for AGIs below $10k, 12.2% for AGIs $10k-25k, 5.0% for AGIs $25k-50k, 3.7% for AGIs $50k-75k, 3.4% for AGIs $75k-100k, 3.8% for AGIs over 100k)
IRA payment deduction: $2,794 (reported on 1.6% of returns)
| 91605: | $2,794 |
| California: | $3,192 |
(% of AGI for various income ranges: 0.1% for AGIs below $10k, 0.1% for AGIs $10k-25k, 0.1% for AGIs $25k-50k, 0.2% for AGIs $50k-75k, 0.2% for AGIs $75k-100k, 0.1% for AGIs over 100k)
Self-employed pension: $13,065 (reported on 0.2% of returns)
| Here: | $13,065 |
| California: | $17,688 |
Total itemized deductions: $19,752 (33% of AGI, reported on 25.3% of returns)
| Here: | $19,752 |
| State: | $28,113 |
| Here: | 32.9% of AGI |
| State: | 25.3% of AGI |
(% of AGI for various income ranges: 11.9% for AGIs below $10k, 8.9% for AGIs $10k-25k, 16.2% for AGIs $25k-50k, 21.4% for AGIs $50k-75k, 23.2% for AGIs $75k-100k, 19.7% for AGIs over 100k)
Charity contributions deductions: $2,281 (3% of AGI, reported on 20.2% of returns)
| Here: | 3.4% of AGI |
| State: | 3.3% of AGI |
(% of AGI for various income ranges: 0.3% for AGIs below $10k, 0.4% for AGIs $10k-25k, 1.2% for AGIs $25k-50k, 2.2% for AGIs $50k-75k, 2.5% for AGIs $75k-100k, 2.4% for AGIs over 100k)
Total tax: $3,662 (reported on 65.4% of returns)
| 91605: | $3,662 |
| State: | $10,761 |
(% of AGI for various income ranges: 7.4% for AGIs below $10k, 3.9% for AGIs $10k-25k, 5.2% for AGIs $25k-50k, 7.6% for AGIs $50k-75k, 9.6% for AGIs $75k-100k, 17.7% for AGIs over 100k)
Earned income credit: $1,938 (reported on 30.8% of returns)
Percentage of individuals using paid preparers for their 2004 taxes: 80.2%
(% for various income ranges: 75.0% for AGIs below $10k, 82.5% for AGIs $10k-25k, 80.7% for AGIs $25k-50k, 80.8% for AGIs $50k-75k, 80.1% for AGIs $75k-100k, 80.9% for AGIs over 100k)
Estimated median household income in 2022: | This zip code: | $60,796 |
| California: | $91,551 |
![Los Angeles, CA (91605) map]() Nearest zip codes: 91606
Nearest zip codes: 91606,
91352,
91607,
91401,
91601,
91402.
Los Angeles Zip Code Map
Percentage of family households:| This zip code: | 49.7% |
| California: | 46.8% |
Percentage of households with unmarried partners:| This zip code: | 4.8% |
| California: | 48.1% |
Likely homosexual households (counted as self-reported same-sex unmarried-partner households)
- Lesbian couples: 0.0% of all households
- Gay men: 0.1% of all households
Household received Food Stamps/SNAP in the past 12 months: 3,713
Household did not receive Food Stamps/SNAP in the past 12 months: 13,061
Women who had a birth in the past 12 months: 417 (217 now married, 201 unmarried)
Women who did not have a birth in the past 12 months: 13,112 (4,356 now married, 8,791 unmarried)
Housing units in zip code 91605 with a mortgage: 4,370 (333
second mortgage, 10
home equity loan, 206
both second mortgage and home equity loan)
Houses without a mortgage: 85
Median monthly owner costs for units with a mortgage: $2,680
Median monthly owner costs for units without a mortgage: $765
Residents with income below the poverty level in 2022:
| This zip code: | 17.7% |
| Whole state: | 12.2% |
| This zip code: | 10.1% |
| Whole state: | 6.2% |
Median number of rooms in houses and condos:
Median number of rooms in apartments:
Notable locations in this zip code not listed on our city pages
- Click to draw/clear zip code borders
Notable locations in zip code 91605: Valley Plaza Branch Los Angeles Public Library (A), PRN Medical Transportation Services Panorama City (B), Impulse Ambulance (C), Firstmed Ambulance Service (D), City of Los Angeles Fire Department Station 89 (E). Display/hide their locations on the map
Churches in zip code 91605 include: Calvary Temple Pentecostal Church (A), Church of Jesus Christ of Latter Day Saints (B), Church of the Nazarene (C), Evangelical Free Church (D), Filipino-American Southern Baptist Church (E), Iglesia Pentecostes Juan 14:6 (F), Saint Paul Assyrian Chalden Church (G), Grace Community Church (H). Display/hide their locations on the map
Parks in zip code 91605 include: Slavin Park (1), Strathern Park West (2), Strathern Playground (3). Display/hide their locations on the map


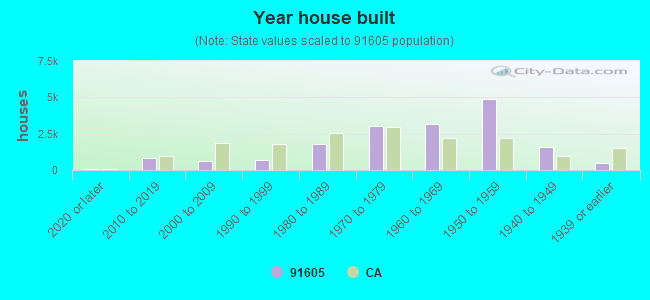
- Year house built (houses)
- 512020 or later
- 8332010 to 2019
- 6232000 to 2009
- 7061990 to 1999
- 1,7821980 to 1989
- 3,0141970 to 1979
- 3,1841960 to 1969
- 4,8571950 to 1959
- 1,5721940 to 1949
- 4931939 or earlier
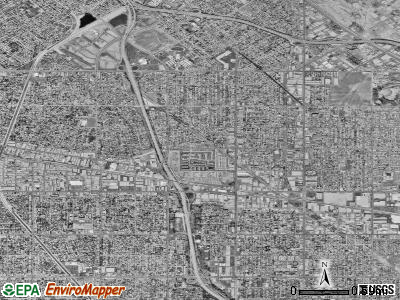
![Zip code 91605 satellite photo by USGS]()
Zip code 91605 household income distribution in 2022
![Zip code 91605 household income distribution in 2022]()
- 1,057Less than $10,000
- 1,115$10,000 to $14,999
- 610$15,000 to $19,999
- 628$20,000 to $24,999
- 826$25,000 to $29,999
- 695$30,000 to $34,999
- 620$35,000 to $39,999
- 566$40,000 to $44,999
- 541$45,000 to $49,999
- 1,344$50,000 to $59,999
- 1,594$60,000 to $74,999
- 1,898$75,000 to $99,999
- 1,629$100,000 to $124,999
- 1,046$125,000 to $149,999
- 914$150,000 to $199,999
- 1,319$200,000 or more
Estimate of home value of owner-occupied houses/condos in 2022 in zip code 91605
![Estimate of home value of owner-occupied houses/condos in 2022 in zip code 91605]()
- 58Less than $10,000
- 19$10,000 to $14,999
- 8$50,000 to $59,999
- 31$60,000 to $69,999
- 2$70,000 to $79,999
- 36$80,000 to $89,999
- 37$90,000 to $99,999
- 34$100,000 to $124,999
- 5$150,000 to $174,999
- 28$175,000 to $199,999
- 31$200,000 to $249,999
- 19$250,000 to $299,999
- 208$300,000 to $399,999
- 431$400,000 to $499,999
- 2,943$500,000 to $749,999
- 2,343$750,000 to $999,999
- 273$1,000,000 to $1,499,999
- 77$1,500,000 to $1,999,999
- 20$2,000,000 or more
Rent paid by renters in 2022 in zip code 91605
![Rent paid by renters in 2022 in zip code 91605]()
- 50Less than $100
- 39$100 to $149
- 28$150 to $199
- 83$200 to $249
- 83$250 to $299
- 40$300 to $349
- 52$350 to $399
- 17$400 to $449
- 39$500 to $549
- 50$550 to $599
- 39$600 to $649
- 19$650 to $699
- 95$700 to $749
- 31$750 to $799
- 252$800 to $899
- 361$900 to $999
- 1,642$1,000 to $1,249
- 1,906$1,250 to $1,499
- 3,222$1,500 to $1,999
- 932$2,000 to $2,499
- 331$2,500 to $2,999
- 126$3,000 to $3,499
- 121$3,500 or more
- 273No cash rent
Median gross rent in 2022: $1,674.
Median price asked for vacant for-sale houses and condos in 2022: $724,580.
Estimated median house (or condo) value in 2022 for:
- White Non-Hispanic householders: $764,191
- Black or African American householders: $747,395
- American Indian or Alaska Native householders: $560,436
- Asian householders: $764,633
- Native Hawaiian and other Pacific Islander householders: $828,720
- Some other race householders: $696,567
- Two or more races householders: $791,594
- Hispanic or Latino householders: $717,340
Estimated median house or condo value in 2022: $740,766
| 91605: | $740,766 |
| California: | $715,900 |
$603,739 - $924,150
Mean price in 2022:
Detached houses: $1,324,769| Here: | $1,324,769 |
| State: | $988,808 |
Townhouses or other attached units: $832,477| Here: | $832,477 |
| State: | $838,546 |
In 2-unit structures: $1,127,961| Here: | $1,127,961 |
| State: | $1,138,100 |
In 3-to-4-unit structures: $930,211| Here: | $930,211 |
| State: | $824,253 |
In 5-or-more-unit structures: $784,826| Here: | $784,826 |
| State: | $730,996 |
Mobile homes: $255,082| Here: | $255,082 |
| State: | $184,506 |
Occupied boats, RVs, vans, etc.: $63,014| Here: | $63,014 |
| State: | $204,957 |
Housing units in structures:
- One, detached: 7,756
- One, attached: 494
- Two: 225
- 3 or 4: 714
- 5 to 9: 1,923
- 10 to 19: 1,932
- 20 to 49: 2,052
- 50 or more: 2,126
- Mobile homes: 204
- Boats, RVs, vans, etc.: 13
Unemployment: 7.5%
Means of transportation to work in zip code 91605
![Means of transportation to work in zip code 91605]()
- 65.3%16,464Drove a car alone
- 13.6%3,424Carpooled
- 3.6%912Bus or trolley bus
- 0.4%96Streetcar or trolley car
- 0.7%182Ferryboat
- 0.6%140Taxi
- 0.1%29Motorcycle
- 0.4%109Bicycle
- 1.5%366Walked
- 1.3%323Other means
- 10.8%2,733Worked at home
Travel time to work (commute) in zip code 91605
![Travel time to work (commute) in zip code 91605]()
- 280Less than 5 minutes
- 1,0155 to 9 minutes
- 1,94610 to 14 minutes
- 3,71215 to 19 minutes
- 3,13020 to 24 minutes
- 1,38325 to 29 minutes
- 3,95130 to 34 minutes
- 52135 to 39 minutes
- 1,02440 to 44 minutes
- 2,39845 to 59 minutes
- 2,04660 to 89 minutes
- 67490 or more minutes
Percentage of zip code residents living and working in this county: 97.8%
Household type by relationship:
Households: 51,225
- Male householders: 8,391 (1,543 living alone), Female householders: 8,038 (2,045 living alone)
6,898 spouses (6,815 opposite-sex spouses), 1,338 unmarried partners, (1,318 opposite-sex unmarried partners), 15,902 children (15,299 natural, 128 adopted, 474 stepchildren), 1,240 grandchildren, 1,895 brothers or sisters, 2,235 parents, 21 foster children, 1,943 other relatives, 2,421 non-relatives
- In group quarters: 802 (-1 institutionalized population)
Size of family households: 2,811 2-persons, 3,129 3-persons, 2,869 4-persons, 1,500 5-persons, 733 6-persons, 419 7-or-more-persons
Size of nonfamily households: 3,590 1-person, 875 2-persons, 195 3-persons, 207 4-persons, 29 5-persons, 3 6-persons
5,211 married couples with children.
3,164 single-parent households (803 men, 2,361 women).
22.0% of residents of 91605 zip code speak English at home.
54.7% of residents speak Spanish at home (56% very well, 21% well, 15% not well, 7% not at all).
17.9% of residents speak other Indo-European language at home (47% very well, 28% well, 18% not well, 6% not at all).
5.9% of residents speak Asian or Pacific Island language at home (50% very well, 32% well, 15% not well, 3% not at all).
0.5% of residents speak other language at home (62% very well, 18% well, 13% not well, 6% not at all).
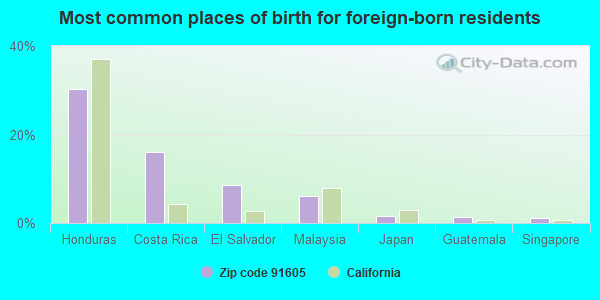
Foreign born population: 24,491 (47.8%)
(58.6%
of them are naturalized citizens)
| This zip code: | 47.8% |
| Whole state: | 26.7% |


- 30%Honduras
- 16%Costa Rica
- 9%El Salvador
- 6%Malaysia
- 2%Japan
- 1%Guatemala
- 1%Singapore

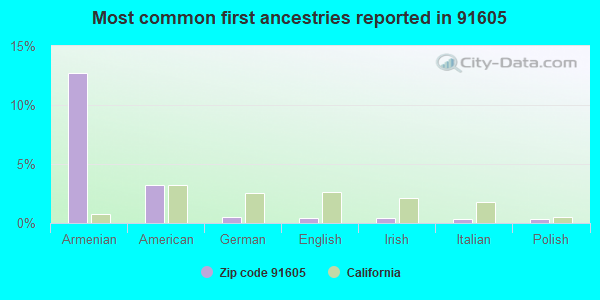
- 13%Armenian
- 3%American
- 0%German
- 0%English
- 0%Irish
- 0%Italian
- 0%Polish

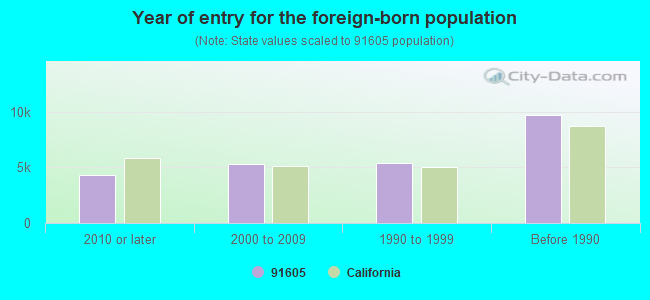
- Year of entry for the foreign-born population
- 4,3272010 or later
- 5,3032000 to 2009
- 5,3841990 to 1999
- 9,721Before 1990
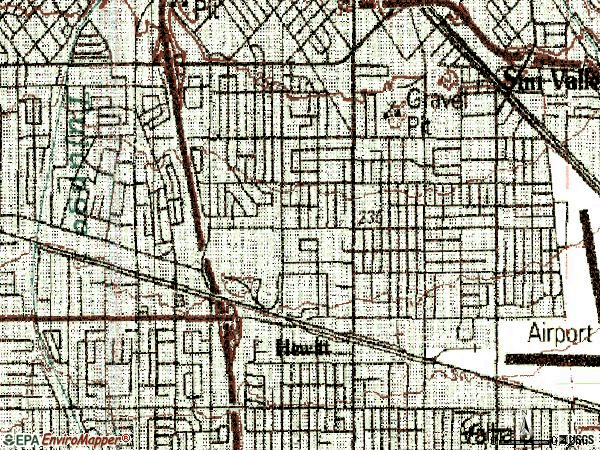
![Zip code 91605 topographic map]()
Major facilities with environmental interests located in this zip code:
- METAL IMPROVEMENT COMPANY INCORPORATED E/M COATING SERVICES DIVISION (6940 FARMDALE AVENUE in NORTH HOLLYWOOD, CA)

AIR MAJOR (AIRS/AFS)
AIR MINOR (AIRS/AFS)
STATE MASTER (California - Hazardous Waste Tracking) - HAZARDOU WASTE PROGRAM
(Integrated Compliance Information System) - ICIS-09-1993-0010, FORMAL ENFORCEMENT ACTION
CRITERIA AND HAZARDOUS AIR POLLUTANT INVENTORY (Inventory of air pollution sources)
HAZARDOUS WASTE BIENNIAL REPORTER (Resource Conservation and Recovery Act (tracking hazardous waste))
Large Quantity Generators, more that 1000 kg of hazardous waste/month (Resource Conservation and Recovery Act (tracking hazardous waste)) - notification
TRI REPORTER (Tracking of toxic chemicals releasing facilities)
Business SIC classification: LUBRICATING OILS AND GREASES; ELECTROPLATING, PLATING, POLISHING, ANODIZING, AND COLORING; COATING, ENGRAVING, AND ALLIED SERVICES; FABRICATED METAL PRODUCTS
Business NAICS classification: METAL COATING, ENGRAVING (EXCEPT JEWELRY AND SILVERWARE), AND ALLIED SERVICES TO MANUFACTURERS.; ELECTROPLATING, PLATING, POLISHING, ANODIZING, AND COLORING.
Organizations: J&S MANAGEMENT (CONTACT/OWNER)
Alternative names: E M CORP, E/M CORP, GREAT LAKES CHEMICAL, E/M, A DIV OF MORGAN CHEMICAL PROD INC, MORGAN CHEMICAL PRODS. INC. E/M DIV.
- FOREIGN AUTO SALVAGE (12537 SHERMAN WAY in N HOLLYWOOD, CA)
(Integrated Compliance Information System) - ICIS-09-2002-0095, FORMAL ENFORCEMENT ACTION
Small Quantity Generators, between 100 kg and 1000 kg of hazardous waste/month (Resource Conservation and Recovery Act (tracking hazardous waste)) - notification - ICIS-09-2002-0095, FORMAL ENFORCEMENT ACTION
Organizations: HONG SUN & MARTIN JUAN (CONTACT/OWNER)
- KAISER PERMANENTE REGIONAL REFERENCE LAB (11668 SHERMAN WAY in NORTH HOLLYWOOD, CA)
STATE MASTER (California - Hazardous Waste Tracking) - HAZARDOU WASTE PROGRAM
HAZARDOUS WASTE BIENNIAL REPORTER (Resource Conservation and Recovery Act (tracking hazardous waste))
Large Quantity Generators, more that 1000 kg of hazardous waste/month (Resource Conservation and Recovery Act (tracking hazardous waste)) - notification
Business NAICS classification: MEDICAL LABORATORIES.
Organizations: RON NEWQUIST (CONTACT/OPERATOR)
, CALIFORNIA PARMANENTE MEDICAL GROUP (CONTACT/OWNER)
Alternative names: KAISER PERMANENTE REGIONAL LAB
- HONEYWELL NORTH HOLLYWOOD (11668 1/2 SHERMAN WAY in N HOLLYWOOD, CA)
STATE MASTER (California - Hazardous Waste Tracking) - HAZARDOU WASTE PROGRAM
Large Quantity Generators, more that 1000 kg of hazardous waste/month (Resource Conservation and Recovery Act (tracking hazardous waste)) - notification
Organizations: HONEYWELL INTERNATIONAL INC. (CONTACT/OPERATOR)
, KAISER (CONTACT/OWNER)
- ELECTROMATIC INCORPORATED (7351 RADFORD AVE. in N HOLLYWOOD, CA)
STATE MASTER (California - Hazardous Waste Tracking) - HAZARDOU WASTE PROGRAM
HAZARDOUS WASTE BIENNIAL REPORTER (Resource Conservation and Recovery Act (tracking hazardous waste))
Small Quantity Generators, between 100 kg and 1000 kg of hazardous waste/month (Resource Conservation and Recovery Act (tracking hazardous waste))
TRI REPORTER (Tracking of toxic chemicals releasing facilities)
Business SIC and NAICS classification: ELECTROPLATING, PLATING, POLISHING, ANODIZING, AND COLORING
Organizations: ELECTROMATIC, INC (CONTACT/OPERATOR)
, MARY F WILK (CONTACT/OWNER)
- HOME DEPOT USA INC HD 6613 (11600 SHERMAN WAY in N HOLLYWOOD, CA)
STATE MASTER (California - Hazardous Waste Tracking) - HAZARDOU WASTE PROGRAM
HAZARDOUS WASTE BIENNIAL REPORTER (Resource Conservation and Recovery Act (tracking hazardous waste))
Small Quantity Generators, between 100 kg and 1000 kg of hazardous waste/month (Resource Conservation and Recovery Act (tracking hazardous waste))
Alternative names: HONEYWELL INTERNATIONAL INC
- LA USD CAMELLIA ELEM (7451 CAMELLIA AVE in N HOLLYWOOD, CA)
STATE MASTER (California - Hazardous Waste Tracking) - HAZARDOU WASTE PROGRAM
COMPLIANCE ACTIVITY (Tracking inspections of insecticide, fungicide, and rodenticide, and toxic substances)
Small Quantity Generators, between 100 kg and 1000 kg of hazardous waste/month (Resource Conservation and Recovery Act (tracking hazardous waste)) - notification
Alternative names: CAMELLIA AVENUE ELEMENTARY, CAMELLIA AVENUE ELEMENTRAY SCHOOL, LAUSD/ CAMELLIA AVE ELEM
- H S ENAMELING CO (7324 ATOLL AVE in N HOLLYWOOD, CA) . Federal Facility
STATE MASTER (California - Hazardous Waste Tracking) - HAZARDOU WASTE PROGRAM
CRITERIA AND HAZARDOUS AIR POLLUTANT INVENTORY (Inventory of air pollution sources)
Small Quantity Generators, between 100 kg and 1000 kg of hazardous waste/month (Resource Conservation and Recovery Act (tracking hazardous waste)) - notification
Business SIC classification: COATING, ENGRAVING, AND ALLIED SERVICES
Organizations: KATHRINE RICHARD (CONTACT/OWNER)
Alternative names: RONAN ENGINEERING CO/HS ENAMEL, SUPERIOR ENAMELING CO
- A & B AUTO BODY (7919 LANKERSHIM BLVD in NORTH HOLLYWOOD, CA)
(Resource Conservation and Recovery Act (tracking hazardous waste))
Organizations: SAM SLYAPICH (CONTACT/OWNER)
Alternative names: A-B AUTO WORKS
- G AND C ACOSTA TRUCKING (7748 HINDS AVE in N HOLLYWOOD, CA)
STATE MASTER (California - Hazardous Waste Tracking) - HAZARDOU WASTE PROGRAM
TRANSPORTER (Resource Conservation and Recovery Act (tracking hazardous waste))
Business NAICS classification: SOLID WASTE COLLECTION.; HAZARDOUS WASTE COLLECTION.
Organizations: GILBERT ACOSTA SR (CONTACT/OPERATOR)
- ANMAR PRECISION COMPONENTS, INC (7424 GREENBUSH AVE in N HOLLYWOOD, CA)
STATE MASTER (California - Hazardous Waste Tracking) - HAZARDOU WASTE PROGRAM
Small Quantity Generators, between 100 kg and 1000 kg of hazardous waste/month (Resource Conservation and Recovery Act (tracking hazardous waste)) - notification
Business NAICS classification: OTHER AIRCRAFT PARTS AND AUXILIARY EQUIPMENT MANUFACTURING.
- FASTENER TECHNOLOGY CORP (7415 FULTON AVENUE in N HOLLYWOOD, CA)
STATE MASTER (California - Hazardous Waste Tracking) - HAZARDOU WASTE PROGRAM
Small Quantity Generators, between 100 kg and 1000 kg of hazardous waste/month (Resource Conservation and Recovery Act (tracking hazardous waste)) - notification
Business NAICS classification: FASTENER, BUTTON, NEEDLE, AND PIN MANUFACTURING.
Organizations: BULENT GULISTAN (CONTACT/OWNER)
- ARCHITECTURAL PLYWOOD INC (7104 CASE AVE in N HOLLYWOOD, CA)
STATE MASTER (California - Hazardous Waste Tracking) - HAZARDOU WASTE PROGRAM
CRITERIA AND HAZARDOUS AIR POLLUTANT INVENTORY (Inventory of air pollution sources)
Small Quantity Generators, between 100 kg and 1000 kg of hazardous waste/month (Resource Conservation and Recovery Act (tracking hazardous waste))
Business SIC and NAICS classification: HARDWOOD VENEER AND PLYWOOD
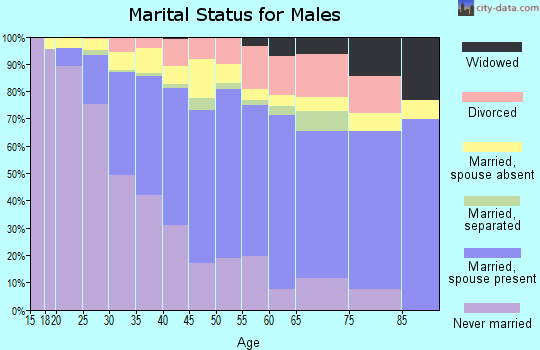
![Zip code 91605 marital status for males]()
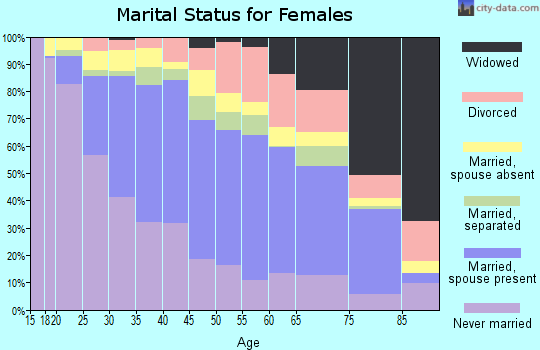
![Zip code 91605 marital status for females]()
Housing units lacking complete plumbing facilities: 0.9%
Housing units lacking complete kitchen facilities: 3.3%

- 62.3%Utility gas
- 29.2%Electricity
- 6.2%No fuel used
- 1.5%Bottled, tank, or LP gas
Population in 1990: 50,050. Population change in the 1990s: +7,079 (+14.1%).
Place of birth for U.S.-born residents:
- This state: 22,687
- Northeast: 684
- Midwest: 1,201
- South: 1,261
- West: 549
53% of the 91605 zip code residents lived in the same house 5 years ago.
Out of people who lived in different houses, 93% lived in this county.
Out of people who lived in different counties, 50% lived in California.
93% of the 91605 zip code residents lived in the same house 1 year ago.
Out of people who lived in different houses, 82% moved from this county.
Out of people who lived in different houses, 7% moved from different county within same state.
Out of people who lived in different houses, 7% moved from different state.
Out of people who lived in different houses, 6% moved from abroad.
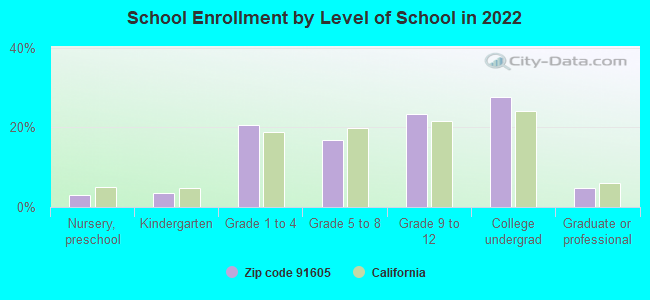
Private vs. public school enrollment:
Students in private schools in grades 1 to 8 (elementary and middle school): 397
| Here: | 8.5% |
| California: | 10.5% |
113
Students in private undergraduate colleges: 413
| Here: | 12.1% |
| California: | 15.9% |

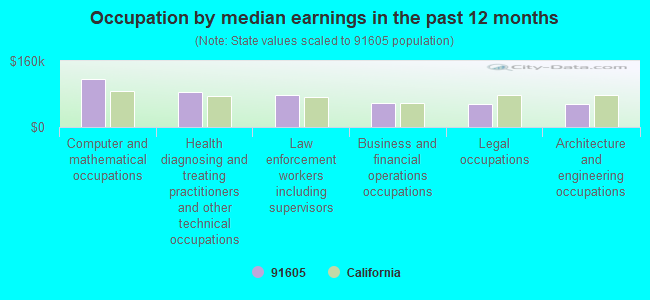
- Occupation by median earnings in the past 12 months ($)
- 115,747Computer and mathematical occupations
- 85,587Health diagnosing and treating practitioners and other technical occupations
- 77,442Law enforcement workers including supervisors
- 58,704Business and financial operations occupations
- 55,678Legal occupations
- 54,644Architecture and engineering occupations
Companies with biggest federal contracts located in this zip code (NORTH HOLLYWOO, CA):
- WHITTAKER CONTROLS INC (12838 SATICOY ST) : $103,041,935 in 898 contracts from 1999 to 2006
Contracts for Valves, Powered, Gas Turbines and Jet Engines, Aircraft; Prime Moving, and Components, Miscellaneous Aircraft Accessories and Components, Torque Converters and Speed Changers, and more by Army, Air Force, Navy, Defense Logistics Agency, and others
Signed by year: 2000: $24,308,660; 2001: $21,532,778; 2002: $20,463,140; 2003: $14,214,944; 2004: $6,357,407; 2005: $9,374,761; 2006: $4,224,212.
Biggest contracts:
$6,323,798 with Army for Valves, Powered. Signed on 2003-10-07. Completion date: 2008-09-30.
$1,810,215, same as above. Signed on 2003-09-22. Completion date: 2007-09-30.
$1,686,370 with Air Force for Valves, Powered. Signed on 2000-09-25. Completion date: 2002-04-30.
$1,549,800 with Navy for Gas Turbines and Jet Engines, Aircraft; Prime Moving, and Components. Signed on 2002-06-13. Completion date: 2003-06-13.
- SOTA CORPORATION (7055 VINELAND AVE; small business) : $20,714,968 in 39 contracts from 1999 to 2006
Contracts for Engine Fuel System Components, Aircraft and Missile Prime Movers, Airframe Structural Components, Valves, Powered, Switches, and more by Air Force, Defense Logistics Agency
Signed by year: 2000: $3,210,511; 2001: $0; 2002: $7,047,095; 2003: $2,504,957; 2004: $2,324,179; 2005: $2,326,387; 2006: $135,885.
Biggest contracts:
$3,377,733 with Air Force for Engine Fuel System Components, Aircraft and Missile Prime Movers. Signed on 2002-03-11. Completion date: 2002-06-30.
$3,210,511, same as above. Signed on 2000-12-05. Completion date: 2001-12-31.
$3,086,304, same as above. Signed on 1999-11-17. Completion date: 2000-12-31.
$2,498,560, same as above. Signed on 2002-10-24. Completion date: 2003-12-31.
- UNITED AERONAUTICAL CORPORATIO (7360 LAUREL CANYON BLVD; small business) : $6,695,381 in 125 contracts from 1999 to 2006
Contracts for Miscellaneous Items, Non-Food Items For Resale, Airframe Structural Components, Aircraft Hydraulic, Vacuum, and De-icing System Components, and more by Navy, Defense Logistics Agency, Air Force
Signed by year: 2000: $516,625; 2001: $100,000; 2002: $367,342; 2003: $3,206,297; 2004: $1,017,751; 2005: $1,260,800; 2006: $151,726.
Biggest contracts:
$1,087,338 with Navy for Miscellaneous Items. Signed on 2003-07-11. Completion date: 2003-12-31.
$1,078,946 with Navy for Non-Food Items For Resale. Signed on 2003-11-24. Completion date: 2004-11-24.
$484,000 with Defense Logistics Agency for Airframe Structural Components. Signed on 2000-05-17. Completion date: 2001-05-12.
$470,000 with Navy for Miscellaneous Items. Signed on 2003-09-25. Completion date: 2003-12-31.
- ACE TOOLS OUTLET, INC (7532 ATOLL AVE; small business) : $4,429,457 in 5 contracts in 2005
Contracts for Miscellaneous Items by Army, U.S. Army Corps of Engineers - civil program financing only, Navy
Signed by year: 2000: $0; 2001: $0; 2002: $0; 2003: $0; 2004: $0; 2005: $4,429,457; 2006: $0.
Biggest contracts:
$1,948,522 with Army for Miscellaneous Items. Taking place in AL. Signed on 2005-07-11. Completion date: 2005-07-14.
$1,948,522 with U.S. Army Corps of Engineers - civil program financing only for Miscellaneous Items. Taking place in AL. Signed on 2005-07-11. Completion date: 2005-07-14.
$263,320 with Army for Miscellaneous Items. Taking place in AL. Signed on 2005-09-22. Completion date: 2005-07-14.
$263,320 with U.S. Army Corps of Engineers - civil program financing only for Miscellaneous Items. Taking place in AL. Signed on 2005-09-22. Completion date: 2005-07-14.
- KLUNE INDUSTRIES INC (7323 COLDWATER CANYON AVE; small business) : $3,686,331 in 57 contracts from 1999 to 2006
Contracts for Electric Portable and Hand Lighting Equipment, Maintenance, Repair and Rebuilding of Equipment -- Guided Missiles, Airframe Structural Components, Gas Turbines and Jet Engines, Aircraft; Prime Moving, and Components, and more by Bureau of Prisoners/Federal Prison System, Air Force, Defense Logistics Agency, Army, and others
Signed by year: 2000: $1,855,149; 2001: $217,000; 2002: $454,456; 2003: $141,480; 2004: $19,240; 2005: $821,372; 2006: $87,115.
Biggest contracts:
$1,068,000 with Bureau of Prisoners/Federal Prison System for Electric Portable and Hand Lighting Equipment. Signed on 2000-04-15. Completion date: 2004-03-15.
$489,950 with Air Force for Maintenance, Repair and Rebuilding of Equipment -- Guided Missiles. Signed on 2005-09-30. Completion date: 2006-04-30.
$418,750 with Defense Logistics Agency for Airframe Structural Components. Signed on 2000-10-06. Completion date: 2002-03-30.
$227,000 with Bureau of Prisoners/Federal Prison System for Electric Portable and Hand Lighting Equipment. Signed on 2002-04-15. Completion date: 2004-02-15.
- ARNOLD A SEMLER INC (11347 VANOWEN ST; small business) : $3,532,468 in 19 contracts from 2000 to 2006
Contracts for Electrical Control Equipment, Radio and Television Communication Equipment, Except Airborne, Miscellaneous Communication Equipment, Telephone and Telegraph Equipment, and more by Navy, Army, Bureau of Prisoners/Federal Prison System, Defense Logistics Agency, and others
Signed by year: 2000: $228,000; 2001: $439,775; 2002: $443,270; 2003: $670,780; 2004: $964,850; 2005: $172,500; 2006: $613,293.
Biggest contracts:
$670,780 with Navy for Electrical Control Equipment. Signed on 2003-08-28. Completion date: 2003-11-26.
$469,160 with Navy for Radio and Television Communication Equipment, Except Airborne. Signed on 2004-07-28. Completion date: 2004-11-24.
$439,775 with Navy for Miscellaneous Communication Equipment. Signed on 2001-04-03. Completion date: 2001-08-01.
$381,844 with Army for Telephone and Telegraph Equipment. Signed on 2006-02-27. Completion date: 2010-12-31.
- ROOKE CORP (7230 FULTON AVENUE; small business) : $2,133,560 in 62 contracts from 2002 to 2006
Contracts for Airframe Structural Components, Radio Navigation Equipment, Airborne by Army, Defense Logistics Agency, Air Force
Signed by year: 2000: $0; 2001: $0; 2002: $270,698; 2003: $384,101; 2004: $1,248,615; 2005: $414,901; 2006: -$184,755.
Biggest contracts:
$298,630 with Army for Airframe Structural Components. Signed on 2004-10-19. Completion date: 2009-09-30.
$279,463 with Defense Logistics Agency for Airframe Structural Components. Signed on 2006-05-04. Completion date: 2006-12-04.
$270,489, same as above. Signed on 2003-10-20. Completion date: 2004-11-08.
$204,248, same as above. Signed on 2004-09-10. Completion date: 2006-06-25.
- CHRISBARRY AIRCRAFT CORPORATIO (10902 VANOWEN ST; small business)
100 employees, $0 revenue. Woman Owned Business: $1,053,628 in 121 contracts from 2000 to 2006
Contracts for Automatic Pilot Mechanisms and Airborne Gyro Components, Airframe Structural Components, Converters, Electrical, Nonrotating, Aircraft Air Conditioning, Heating, and Pressurizing Equipment, and more by Defense Logistics Agency, Navy, Air Force, U.S. Coast Guard, and others
Signed by year: 2000: $129,800; 2001: $55,800; 2002: $139,900; 2003: $153,900; 2004: $228,355; 2005: $271,023; 2006: $74,850.
Biggest contracts:
$99,900 with Defense Logistics Agency for Automatic Pilot Mechanisms and Airborne Gyro Components. Signed on 2002-08-12. Completion date: 2002-09-11.
$70,000 with Defense Logistics Agency for Airframe Structural Components. Signed on 2004-05-17. Completion date: 2004-06-17.
$60,000 with Defense Logistics Agency for Converters, Electrical, Nonrotating. Signed on 2003-11-14. Completion date: 2003-12-14.
$52,800 with Navy for Aircraft Air Conditioning, Heating, and Pressurizing Equipment. Signed on 2000-08-17. Completion date: 2000-08-25.
- FASTENER TECHNOLOGY CORP (7415 FULTON AVE; small business) : $732,614 in 99 contracts from 2002 to 2006
Contracts for Bolts, Hand Tools, Nonedged, Nonpowered, Nuts and Washers, Fastening Device, and more by Defense Logistics Agency, Army, Navy
Signed by year: 2000: $0; 2001: $0; 2002: $37,312; 2003: $16,093; 2004: $181,450; 2005: $343,813; 2006: $153,946.
Biggest contracts:
$69,410 with Defense Logistics Agency for Bolts. Signed on 2005-02-26. Completion date: 2006-02-25.
$62,012, same as above. Signed on 2004-10-13. Completion date: 2005-02-13.
$46,120, same as above. Signed on 2004-10-15. Completion date: 2005-02-02.
$41,265, same as above. Signed on 2005-05-24. Completion date: 2005-10-24.
- AEROSPACE RIVET AND BOLT (12838 RAYMER ST; small business) : $697,550 in 109 contracts from 2005 to 2006
Contracts for Rivets, Bolts, Fastening Device, Nuts and Washers, and more by Defense Logistics Agency
Signed by year: 2000: $0; 2001: $0; 2002: $0; 2003: $0; 2004: $0; 2005: $85,503; 2006: $612,047.
Biggest contracts:
$45,036 with Defense Logistics Agency for Rivets. Signed on 2006-03-31. Completion date: 2006-09-21.
$33,807 with Defense Logistics Agency for Bolts. Signed on 2006-06-23. Completion date: 2007-05-12.
$26,257 with Defense Logistics Agency for Fastening Device. Taking place in MI. Signed on 2006-03-29. Completion date: 2006-11-08.
$21,057 with Defense Logistics Agency for Nuts and Washers. Signed on 2006-03-16. Completion date: 2006-09-07.
Top industries in this zip code by the number of employees in 2005:
- Health Care and Social Assistance: Nursing Care Facilities (250-499 employees: 1 establishment, 100-249 employees: 1 establishment)
- Accommodation and Food Services: Limited-Service Restaurants (20-49: 9, 10-19: 2, 5-9: 4, 1-4: 13)
- Construction: Plumbing, Heating, and Air-Conditioning Contractors (100-249: 1, 50-99: 1, 20-49: 2, 10-19: 2, 5-9: 3, 1-4: 11)
People in group quarters in 2010:
- 495 people in emergency and transitional shelters (with sleeping facilities) for people experiencing homelessness
- 215 people in nursing facilities/skilled-nursing facilities
- 58 people in workers' group living quarters and job corps centers
- 25 people in group homes intended for adults
- 14 people in residential treatment centers for adults
- 13 people in group homes for juveniles (non-correctional)
- 9 people in other noninstitutional facilities
People in group quarters in 2000:
- 552 people in other noninstitutional group quarters
- 108 people in other nonhousehold living situations
- 86 people in nursing homes
- 9 people in other group homes
Fatal accident statistics in 2014:
- Fatal accident count: 8
- Vehicles involved in fatal accidents: 15
- Fatal accidents caused by drunken drivers: 3
- Fatalities: 8
- Persons involved in fatal accidents: 17
- Pedestrians involved in fatal accidents: 4
Fatal accident statistics in 2013:
- Fatal accident count: 3
- Vehicles involved in fatal accidents: 5
- Fatal accidents caused by drunken drivers: 0
- Fatalities: 3
- Persons involved in fatal accidents: 12
- Pedestrians involved in fatal accidents: 1
Home Mortgage Disclosure Act Aggregated Statistics For Year 2009
(Based on 6 full and 28 partial tracts)
|
| A) FHA, FSA/RHS & VA
Home Purchase Loans | B) Conventional
Home Purchase Loans | C) Refinancings
| D) Home Improvement Loans
| E) Loans on Dwellings For 5+ Families
| F) Non-occupant Loans on
< 5 Family Dwellings (A B C & D) | G) Loans On Manufactured
Home Dwelling (A B C & D) |
|---|
| Number | Average Value | Number | Average Value | Number | Average Value | Number | Average Value | Number | Average Value | Number | Average Value | Number | Average Value |
|---|
| LOANS ORIGINATED | 147 | $291,837 | 242 | $237,740 | 447 | $224,884 | 32 | $141,203 | 13 | $1,129,206 | 69 | $203,644 | 0 | $0 |
| APPLICATIONS APPROVED, NOT ACCEPTED | 17 | $274,166 | 39 | $256,908 | 63 | $238,051 | 5 | $67,124 | 1 | $286,050 | 8 | $210,751 | 0 | $0 |
| APPLICATIONS DENIED | 66 | $302,514 | 105 | $230,524 | 292 | $273,503 | 34 | $121,352 | 11 | $1,470,007 | 45 | $196,261 | 7 | $138,890 |
| APPLICATIONS WITHDRAWN | 46 | $281,411 | 64 | $256,754 | 122 | $237,832 | 15 | $150,637 | 6 | $797,662 | 24 | $232,202 | 0 | $0 |
| FILES CLOSED FOR INCOMPLETENESS | 17 | $272,789 | 17 | $301,277 | 38 | $259,397 | 4 | $140,740 | 0 | $0 | 6 | $286,630 | 0 | $0 |
Aggregated Statistics For Year 2008
(Based on 6 full and 28 partial tracts)
|
| A) FHA, FSA/RHS & VA
Home Purchase Loans | B) Conventional
Home Purchase Loans | C) Refinancings
| D) Home Improvement Loans
| E) Loans on Dwellings For 5+ Families
| F) Non-occupant Loans on
< 5 Family Dwellings (A B C & D) | G) Loans On Manufactured
Home Dwelling (A B C & D) |
|---|
| Number | Average Value | Number | Average Value | Number | Average Value | Number | Average Value | Number | Average Value | Number | Average Value | Number | Average Value |
|---|
| LOANS ORIGINATED | 49 | $321,611 | 298 | $291,926 | 424 | $276,526 | 48 | $148,569 | 39 | $1,763,076 | 59 | $264,886 | 1 | $128,000 |
| APPLICATIONS APPROVED, NOT ACCEPTED | 9 | $341,457 | 108 | $323,450 | 177 | $304,189 | 18 | $178,343 | 0 | $0 | 19 | $246,625 | 6 | $74,173 |
| APPLICATIONS DENIED | 25 | $338,475 | 168 | $311,974 | 482 | $346,931 | 82 | $171,175 | 10 | $1,433,894 | 46 | $320,027 | 11 | $116,247 |
| APPLICATIONS WITHDRAWN | 17 | $294,059 | 91 | $303,328 | 143 | $284,962 | 21 | $139,147 | 2 | $2,042,615 | 28 | $278,375 | 0 | $0 |
| FILES CLOSED FOR INCOMPLETENESS | 5 | $292,866 | 34 | $330,569 | 85 | $340,036 | 5 | $200,536 | 2 | $2,199,960 | 10 | $165,081 | 0 | $0 |
Aggregated Statistics For Year 2007
(Based on 6 full and 28 partial tracts)
|
| A) FHA, FSA/RHS & VA
Home Purchase Loans | B) Conventional
Home Purchase Loans | C) Refinancings
| D) Home Improvement Loans
| E) Loans on Dwellings For 5+ Families
| F) Non-occupant Loans on
< 5 Family Dwellings (A B C & D) | G) Loans On Manufactured
Home Dwelling (A B C & D) |
|---|
| Number | Average Value | Number | Average Value | Number | Average Value | Number | Average Value | Number | Average Value | Number | Average Value | Number | Average Value |
|---|
| LOANS ORIGINATED | 0 | $0 | 574 | $329,400 | 1,366 | $337,105 | 192 | $226,701 | 97 | $1,078,846 | 138 | $330,772 | 5 | $47,016 |
| APPLICATIONS APPROVED, NOT ACCEPTED | 2 | $313,305 | 249 | $321,125 | 402 | $355,508 | 54 | $299,397 | 0 | $0 | 32 | $330,229 | 6 | $99,390 |
| APPLICATIONS DENIED | 0 | $0 | 541 | $364,281 | 1,125 | $384,325 | 185 | $248,082 | 10 | $394,450 | 117 | $412,985 | 12 | $80,286 |
| APPLICATIONS WITHDRAWN | 0 | $0 | 150 | $318,356 | 342 | $341,190 | 39 | $229,111 | 7 | $1,139,180 | 36 | $405,764 | 0 | $0 |
| FILES CLOSED FOR INCOMPLETENESS | 1 | $130,570 | 57 | $375,953 | 177 | $403,067 | 15 | $312,451 | 2 | $310,250 | 13 | $395,932 | 0 | $0 |
Aggregated Statistics For Year 2006
(Based on 6 full and 28 partial tracts)
|
| B) Conventional
Home Purchase Loans | C) Refinancings
| D) Home Improvement Loans
| E) Loans on Dwellings For 5+ Families
| F) Non-occupant Loans on
< 5 Family Dwellings (A B C & D) | G) Loans On Manufactured
Home Dwelling (A B C & D) |
|---|
| Number | Average Value | Number | Average Value | Number | Average Value | Number | Average Value | Number | Average Value | Number | Average Value |
|---|
| LOANS ORIGINATED | 1,280 | $301,618 | 2,007 | $337,464 | 261 | $261,821 | 99 | $1,333,883 | 213 | $328,756 | 2 | $81,480 |
| APPLICATIONS APPROVED, NOT ACCEPTED | 257 | $299,797 | 479 | $329,184 | 60 | $230,639 | 2 | $431,550 | 52 | $335,444 | 3 | $72,640 |
| APPLICATIONS DENIED | 671 | $319,014 | 985 | $355,617 | 186 | $241,707 | 8 | $2,229,682 | 107 | $403,906 | 5 | $65,540 |
| APPLICATIONS WITHDRAWN | 266 | $337,521 | 743 | $341,626 | 85 | $219,521 | 5 | $1,183,990 | 59 | $417,166 | 0 | $0 |
| FILES CLOSED FOR INCOMPLETENESS | 64 | $290,569 | 180 | $334,085 | 11 | $351,469 | 2 | $472,925 | 13 | $486,742 | 0 | $0 |
Aggregated Statistics For Year 2005
(Based on 6 full and 28 partial tracts)
|
| A) FHA, FSA/RHS & VA
Home Purchase Loans | B) Conventional
Home Purchase Loans | C) Refinancings
| D) Home Improvement Loans
| E) Loans on Dwellings For 5+ Families
| F) Non-occupant Loans on
< 5 Family Dwellings (A B C & D) | G) Loans On Manufactured
Home Dwelling (A B C & D) |
|---|
| Number | Average Value | Number | Average Value | Number | Average Value | Number | Average Value | Number | Average Value | Number | Average Value | Number | Average Value |
|---|
| LOANS ORIGINATED | 2 | $179,255 | 1,312 | $280,775 | 2,344 | $287,958 | 266 | $228,841 | 104 | $1,025,303 | 201 | $278,619 | 0 | $0 |
| APPLICATIONS APPROVED, NOT ACCEPTED | 0 | $0 | 262 | $254,817 | 520 | $276,398 | 61 | $198,339 | 1 | $143,030 | 36 | $289,934 | 6 | $55,982 |
| APPLICATIONS DENIED | 1 | $219,000 | 542 | $278,409 | 1,094 | $300,515 | 179 | $195,224 | 7 | $668,286 | 85 | $322,366 | 8 | $71,476 |
| APPLICATIONS WITHDRAWN | 0 | $0 | 268 | $266,043 | 826 | $298,064 | 74 | $179,104 | 5 | $1,064,794 | 58 | $297,021 | 1 | $53,460 |
| FILES CLOSED FOR INCOMPLETENESS | 0 | $0 | 46 | $313,736 | 271 | $298,848 | 13 | $179,067 | 0 | $0 | 10 | $275,614 | 0 | $0 |
Aggregated Statistics For Year 2004
(Based on 6 full and 28 partial tracts)
|
| A) FHA, FSA/RHS & VA
Home Purchase Loans | B) Conventional
Home Purchase Loans | C) Refinancings
| D) Home Improvement Loans
| E) Loans on Dwellings For 5+ Families
| F) Non-occupant Loans on
< 5 Family Dwellings (A B C & D) | G) Loans On Manufactured
Home Dwelling (A B C & D) |
|---|
| Number | Average Value | Number | Average Value | Number | Average Value | Number | Average Value | Number | Average Value | Number | Average Value | Number | Average Value |
|---|
| LOANS ORIGINATED | 2 | $238,215 | 1,237 | $231,975 | 2,569 | $232,379 | 264 | $183,690 | 112 | $792,067 | 209 | $212,104 | 2 | $3,325,455 |
| APPLICATIONS APPROVED, NOT ACCEPTED | 0 | $0 | 231 | $242,813 | 550 | $228,149 | 33 | $164,187 | 2 | $599,360 | 32 | $226,357 | 0 | $0 |
| APPLICATIONS DENIED | 3 | $193,943 | 353 | $220,643 | 925 | $237,963 | 196 | $125,635 | 12 | $1,148,891 | 80 | $209,087 | 4 | $54,622 |
| APPLICATIONS WITHDRAWN | 1 | $200,000 | 190 | $231,148 | 792 | $239,152 | 81 | $125,389 | 2 | $197,065 | 35 | $204,768 | 7 | $1,006,441 |
| FILES CLOSED FOR INCOMPLETENESS | 0 | $0 | 42 | $252,712 | 196 | $241,835 | 11 | $144,615 | 1 | $1,045,500 | 12 | $258,194 | 0 | $0 |
Aggregated Statistics For Year 2003
(Based on 6 full and 28 partial tracts)
|
| A) FHA, FSA/RHS & VA
Home Purchase Loans | B) Conventional
Home Purchase Loans | C) Refinancings
| D) Home Improvement Loans
| E) Loans on Dwellings For 5+ Families
| F) Non-occupant Loans on
< 5 Family Dwellings (A B C & D) |
|---|
| Number | Average Value | Number | Average Value | Number | Average Value | Number | Average Value | Number | Average Value | Number | Average Value |
|---|
| LOANS ORIGINATED | 37 | $233,156 | 986 | $194,921 | 3,849 | $171,798 | 70 | $51,615 | 125 | $746,003 | 268 | $172,182 |
| APPLICATIONS APPROVED, NOT ACCEPTED | 8 | $205,028 | 191 | $195,837 | 666 | $178,793 | 14 | $73,717 | 4 | $888,090 | 64 | $192,295 |
| APPLICATIONS DENIED | 2 | $200,830 | 258 | $192,118 | 1,062 | $179,596 | 114 | $59,920 | 15 | $447,321 | 72 | $175,561 |
| APPLICATIONS WITHDRAWN | 3 | $209,880 | 157 | $200,488 | 963 | $181,009 | 66 | $64,012 | 5 | $359,742 | 35 | $192,397 |
| FILES CLOSED FOR INCOMPLETENESS | 1 | $146,170 | 30 | $214,348 | 205 | $165,051 | 10 | $110,713 | 1 | $945,360 | 7 | $158,534 |
Aggregated Statistics For Year 2002
(Based on 1 full and 8 partial tracts)
|
| A) FHA, FSA/RHS & VA
Home Purchase Loans | B) Conventional
Home Purchase Loans | C) Refinancings
| D) Home Improvement Loans
| E) Loans on Dwellings For 5+ Families
| F) Non-occupant Loans on
< 5 Family Dwellings (A B C & D) |
|---|
| Number | Average Value | Number | Average Value | Number | Average Value | Number | Average Value | Number | Average Value | Number | Average Value |
|---|
| LOANS ORIGINATED | 38 | $210,889 | 390 | $167,280 | 1,313 | $156,360 | 30 | $26,624 | 19 | $736,240 | 88 | $156,770 |
| APPLICATIONS APPROVED, NOT ACCEPTED | 11 | $198,685 | 77 | $176,236 | 257 | $153,589 | 19 | $32,582 | 0 | $0 | 14 | $144,457 |
| APPLICATIONS DENIED | 6 | $217,430 | 121 | $156,097 | 404 | $158,191 | 61 | $55,585 | 5 | $320,684 | 28 | $131,911 |
| APPLICATIONS WITHDRAWN | 10 | $185,633 | 66 | $169,905 | 366 | $160,496 | 30 | $84,621 | 0 | $0 | 15 | $135,959 |
| FILES CLOSED FOR INCOMPLETENESS | 2 | $169,550 | 12 | $185,963 | 97 | $152,934 | 5 | $25,386 | 0 | $0 | 9 | $108,116 |
Aggregated Statistics For Year 2001
(Based on 1 full and 8 partial tracts)
|
| A) FHA, FSA/RHS & VA
Home Purchase Loans | B) Conventional
Home Purchase Loans | C) Refinancings
| D) Home Improvement Loans
| E) Loans on Dwellings For 5+ Families
| F) Non-occupant Loans on
< 5 Family Dwellings (A B C & D) |
|---|
| Number | Average Value | Number | Average Value | Number | Average Value | Number | Average Value | Number | Average Value | Number | Average Value |
|---|
| LOANS ORIGINATED | 87 | $180,791 | 337 | $143,751 | 913 | $142,674 | 51 | $33,080 | 10 | $1,783,953 | 74 | $122,436 |
| APPLICATIONS APPROVED, NOT ACCEPTED | 6 | $187,373 | 43 | $138,847 | 153 | $151,053 | 12 | $69,985 | 2 | $361,250 | 19 | $132,139 |
| APPLICATIONS DENIED | 8 | $167,454 | 92 | $153,947 | 425 | $137,969 | 78 | $26,612 | 2 | $172,105 | 16 | $123,028 |
| APPLICATIONS WITHDRAWN | 12 | $163,022 | 57 | $135,422 | 282 | $144,959 | 41 | $44,190 | 5 | $417,698 | 14 | $117,359 |
| FILES CLOSED FOR INCOMPLETENESS | 4 | $194,830 | 24 | $150,936 | 68 | $142,266 | 9 | $50,194 | 0 | $0 | 1 | $219,780 |
Aggregated Statistics For Year 2000
(Based on 1 full and 8 partial tracts)
|
| A) FHA, FSA/RHS & VA
Home Purchase Loans | B) Conventional
Home Purchase Loans | C) Refinancings
| D) Home Improvement Loans
| E) Loans on Dwellings For 5+ Families
| F) Non-occupant Loans on
< 5 Family Dwellings (A B C & D) |
|---|
| Number | Average Value | Number | Average Value | Number | Average Value | Number | Average Value | Number | Average Value | Number | Average Value |
|---|
| LOANS ORIGINATED | 115 | $163,320 | 297 | $125,092 | 240 | $116,249 | 51 | $28,958 | 3 | $695,297 | 16 | $117,067 |
| APPLICATIONS APPROVED, NOT ACCEPTED | 9 | $151,570 | 26 | $142,715 | 68 | $102,142 | 31 | $25,685 | 0 | $0 | 13 | $99,058 |
| APPLICATIONS DENIED | 13 | $152,961 | 103 | $125,676 | 258 | $102,413 | 59 | $31,189 | 0 | $0 | 21 | $86,082 |
| APPLICATIONS WITHDRAWN | 15 | $161,851 | 62 | $101,835 | 136 | $102,403 | 16 | $38,193 | 0 | $0 | 8 | $142,149 |
| FILES CLOSED FOR INCOMPLETENESS | 7 | $131,379 | 18 | $133,026 | 93 | $143,369 | 2 | $11,075 | 0 | $0 | 6 | $94,802 |
Aggregated Statistics For Year 1999
(Based on 2 full and 10 partial tracts)
|
| A) FHA, FSA/RHS & VA
Home Purchase Loans | B) Conventional
Home Purchase Loans | C) Refinancings
| D) Home Improvement Loans
| E) Loans on Dwellings For 5+ Families
| F) Non-occupant Loans on
< 5 Family Dwellings (A B C & D) |
|---|
| Number | Average Value | Number | Average Value | Number | Average Value | Number | Average Value | Number | Average Value | Number | Average Value |
|---|
| LOANS ORIGINATED | 160 | $145,330 | 310 | $115,859 | 496 | $113,733 | 79 | $19,473 | 20 | $470,034 | 58 | $109,348 |
| APPLICATIONS APPROVED, NOT ACCEPTED | 9 | $156,170 | 47 | $126,692 | 123 | $110,529 | 40 | $25,713 | 1 | $138,750 | 10 | $104,318 |
| APPLICATIONS DENIED | 17 | $146,601 | 75 | $120,001 | 300 | $102,896 | 89 | $22,820 | 6 | $579,847 | 27 | $87,734 |
| APPLICATIONS WITHDRAWN | 16 | $153,099 | 51 | $106,933 | 189 | $108,665 | 15 | $31,201 | 2 | $506,775 | 9 | $111,681 |
| FILES CLOSED FOR INCOMPLETENESS | 4 | $133,165 | 10 | $96,839 | 85 | $113,896 | 5 | $21,820 | 2 | $476,210 | 7 | $107,059 |
Private Mortgage Insurance Companies Aggregated Statistics For Year 2009
(Based on 6 full and 22 partial tracts)
|
| A) Conventional
Home Purchase Loans | B) Refinancings
| C) Non-occupant Loans on
< 5 Family Dwellings (A & B) |
|---|
| Number | Average Value | Number | Average Value | Number | Average Value |
|---|
| LOANS ORIGINATED | 47 | $282,284 | 3 | $413,950 | 1 | $253,000 |
| APPLICATIONS APPROVED, NOT ACCEPTED | 42 | $306,829 | 11 | $343,343 | 0 | $0 |
| APPLICATIONS DENIED | 25 | $298,658 | 0 | $0 | 0 | $0 |
| APPLICATIONS WITHDRAWN | 2 | $253,045 | 4 | $325,525 | 0 | $0 |
| FILES CLOSED FOR INCOMPLETENESS | 2 | $268,080 | 0 | $0 | 0 | $0 |
Aggregated Statistics For Year 2008
(Based on 6 full and 28 partial tracts)
|
| A) Conventional
Home Purchase Loans | B) Refinancings
| C) Non-occupant Loans on
< 5 Family Dwellings (A & B) |
|---|
| Number | Average Value | Number | Average Value | Number | Average Value |
|---|
| LOANS ORIGINATED | 159 | $330,374 | 21 | $402,407 | 2 | $306,270 |
| APPLICATIONS APPROVED, NOT ACCEPTED | 66 | $376,004 | 27 | $445,583 | 2 | $416,630 |
| APPLICATIONS DENIED | 51 | $318,394 | 5 | $404,144 | 5 | $352,632 |
| APPLICATIONS WITHDRAWN | 15 | $293,392 | 2 | $335,850 | 0 | $0 |
| FILES CLOSED FOR INCOMPLETENESS | 3 | $427,357 | 0 | $0 | 1 | $451,590 |
Aggregated Statistics For Year 2007
(Based on 6 full and 28 partial tracts)
|
| A) Conventional
Home Purchase Loans | B) Refinancings
| C) Non-occupant Loans on
< 5 Family Dwellings (A & B) |
|---|
| Number | Average Value | Number | Average Value | Number | Average Value |
|---|
| LOANS ORIGINATED | 44 | $394,804 | 24 | $557,397 | 2 | $306,720 |
| APPLICATIONS APPROVED, NOT ACCEPTED | 6 | $431,003 | 8 | $460,245 | 2 | $416,630 |
| APPLICATIONS DENIED | 2 | $325,920 | 13 | $627,046 | 3 | $533,197 |
| APPLICATIONS WITHDRAWN | 2 | $409,190 | 1 | $540,000 | 1 | $540,000 |
| FILES CLOSED FOR INCOMPLETENESS | 0 | $0 | 0 | $0 | 0 | $0 |
Aggregated Statistics For Year 2006
(Based on 4 full and 22 partial tracts)
|
| A) Conventional
Home Purchase Loans | B) Refinancings
| C) Non-occupant Loans on
< 5 Family Dwellings (A & B) |
|---|
| Number | Average Value | Number | Average Value | Number | Average Value |
|---|
| LOANS ORIGINATED | 12 | $360,340 | 13 | $500,792 | 0 | $0 |
| APPLICATIONS APPROVED, NOT ACCEPTED | 4 | $395,315 | 5 | $386,612 | 0 | $0 |
| APPLICATIONS DENIED | 0 | $0 | 7 | $551,239 | 2 | $461,990 |
| APPLICATIONS WITHDRAWN | 0 | $0 | 3 | $456,327 | 0 | $0 |
| FILES CLOSED FOR INCOMPLETENESS | 0 | $0 | 2 | $461,990 | 0 | $0 |
Aggregated Statistics For Year 2005
(Based on 6 full and 22 partial tracts)
|
| A) Conventional
Home Purchase Loans | B) Refinancings
| C) Non-occupant Loans on
< 5 Family Dwellings (A & B) |
|---|
| Number | Average Value | Number | Average Value | Number | Average Value |
|---|
| LOANS ORIGINATED | 25 | $346,751 | 12 | $376,310 | 3 | $435,037 |
| APPLICATIONS APPROVED, NOT ACCEPTED | 8 | $395,194 | 10 | $326,865 | 1 | $548,260 |
| APPLICATIONS DENIED | 0 | $0 | 0 | $0 | 0 | $0 |
| APPLICATIONS WITHDRAWN | 3 | $300,963 | 5 | $417,180 | 0 | $0 |
| FILES CLOSED FOR INCOMPLETENESS | 0 | $0 | 0 | $0 | 0 | $0 |
Aggregated Statistics For Year 2004
(Based on 5 full and 28 partial tracts)
|
| A) Conventional
Home Purchase Loans | B) Refinancings
| C) Non-occupant Loans on
< 5 Family Dwellings (A & B) |
|---|
| Number | Average Value | Number | Average Value | Number | Average Value |
|---|
| LOANS ORIGINATED | 53 | $309,739 | 35 | $300,052 | 3 | $302,673 |
| APPLICATIONS APPROVED, NOT ACCEPTED | 27 | $266,984 | 19 | $262,375 | 0 | $0 |
| APPLICATIONS DENIED | 1 | $451,440 | 0 | $0 | 1 | $451,440 |
| APPLICATIONS WITHDRAWN | 14 | $318,895 | 3 | $324,630 | 0 | $0 |
| FILES CLOSED FOR INCOMPLETENESS | 0 | $0 | 0 | $0 | 0 | $0 |
Aggregated Statistics For Year 2003
(Based on 6 full and 28 partial tracts)
|
| A) Conventional
Home Purchase Loans | B) Refinancings
| C) Non-occupant Loans on
< 5 Family Dwellings (A & B) |
|---|
| Number | Average Value | Number | Average Value | Number | Average Value |
|---|
| LOANS ORIGINATED | 212 | $252,481 | 73 | $242,419 | 8 | $236,584 |
| APPLICATIONS APPROVED, NOT ACCEPTED | 39 | $255,012 | 45 | $218,684 | 0 | $0 |
| APPLICATIONS DENIED | 7 | $297,827 | 0 | $0 | 1 | $280,810 |
| APPLICATIONS WITHDRAWN | 13 | $233,500 | 1 | $399,470 | 2 | $133,625 |
| FILES CLOSED FOR INCOMPLETENESS | 3 | $184,903 | 0 | $0 | 0 | $0 |
Aggregated Statistics For Year 2002
(Based on 1 full and 8 partial tracts)
|
| A) Conventional
Home Purchase Loans | B) Refinancings
| C) Non-occupant Loans on
< 5 Family Dwellings (A & B) |
|---|
| Number | Average Value | Number | Average Value | Number | Average Value |
|---|
| LOANS ORIGINATED | 142 | $205,923 | 73 | $209,461 | 7 | $99,094 |
| APPLICATIONS APPROVED, NOT ACCEPTED | 31 | $207,092 | 37 | $193,630 | 1 | $171,000 |
| APPLICATIONS DENIED | 4 | $254,968 | 1 | $334,130 | 0 | $0 |
| APPLICATIONS WITHDRAWN | 12 | $200,707 | 10 | $201,395 | 3 | $234,663 |
| FILES CLOSED FOR INCOMPLETENESS | 5 | $209,500 | 2 | $213,850 | 0 | $0 |
Aggregated Statistics For Year 2001
(Based on 1 full and 8 partial tracts)
|
| A) Conventional
Home Purchase Loans | B) Refinancings
| C) Non-occupant Loans on
< 5 Family Dwellings (A & B) |
|---|
| Number | Average Value | Number | Average Value | Number | Average Value |
|---|
| LOANS ORIGINATED | 114 | $177,539 | 75 | $187,286 | 3 | $138,143 |
| APPLICATIONS APPROVED, NOT ACCEPTED | 27 | $173,192 | 38 | $168,000 | 1 | $207,900 |
| APPLICATIONS DENIED | 6 | $241,313 | 8 | $194,741 | 0 | $0 |
| APPLICATIONS WITHDRAWN | 6 | $185,130 | 5 | $213,304 | 0 | $0 |
| FILES CLOSED FOR INCOMPLETENESS | 1 | $353,430 | 0 | $0 | 0 | $0 |
Aggregated Statistics For Year 2000
(Based on 1 full and 8 partial tracts)
|
| A) Conventional
Home Purchase Loans | B) Refinancings
|
|---|
| Number | Average Value | Number | Average Value |
|---|
| LOANS ORIGINATED | 111 | $154,376 | 21 | $161,247 |
| APPLICATIONS APPROVED, NOT ACCEPTED | 11 | $167,324 | 4 | $191,595 |
| APPLICATIONS DENIED | 6 | $167,583 | 4 | $193,562 |
| APPLICATIONS WITHDRAWN | 3 | $122,640 | 1 | $316,310 |
| FILES CLOSED FOR INCOMPLETENESS | 0 | $0 | 0 | $0 |
Aggregated Statistics For Year 1999
(Based on 2 full and 10 partial tracts)
|
| A) Conventional
Home Purchase Loans | B) Refinancings
| C) Non-occupant Loans on
< 5 Family Dwellings (A & B) |
|---|
| Number | Average Value | Number | Average Value | Number | Average Value |
|---|
| LOANS ORIGINATED | 114 | $139,532 | 82 | $141,772 | 2 | $145,410 |
| APPLICATIONS APPROVED, NOT ACCEPTED | 14 | $141,726 | 23 | $146,140 | 1 | $120,200 |
| APPLICATIONS DENIED | 9 | $145,340 | 5 | $126,956 | 0 | $0 |
| APPLICATIONS WITHDRAWN | 3 | $155,633 | 4 | $126,808 | 0 | $0 |
| FILES CLOSED FOR INCOMPLETENESS | 5 | $114,050 | 2 | $152,980 | 0 | $0 |
2005 - 2018 National Fire Incident Reporting System (NFIRS) incidents
See full 2006 National Fire Incident Reporting System statistics for zip code 91605, California
| Most common first names in zip code 91605 among deceased individuals |
| Name | Count | Lived (average) |
|---|
| John | 136 | 71.9 years |
| Mary | 128 | 78.1 years |
| William | 117 | 70.1 years |
| Robert | 99 | 66.3 years |
| James | 95 | 73.1 years |
| Maria | 89 | 78.7 years |
| George | 83 | 74.7 years |
| Joseph | 74 | 74.6 years |
| Charles | 69 | 74.2 years |
| Margaret | 68 | 78.2 years |
| Most common last names in zip code 91605 among deceased individuals |
| Last name | Count | Lived (average) |
|---|
| Smith | 44 | 68.1 years |
| Johnson | 31 | 72.8 years |
| Perez | 29 | 71.1 years |
| Martinez | 24 | 70.5 years |
| Rodriguez | 24 | 68.7 years |
| Garcia | 24 | 66.8 years |
| Miller | 23 | 76.8 years |
| Wilson | 23 | 71.8 years |
| Cohen | 22 | 78.3 years |
| Davis | 22 | 73.1 years |
| Businesses in zip code 91605 |
| Name | Count | | Name | Count |
| 7-Eleven | 2 | | Lane Furniture | 1 |
| 99 Cents Only Stores | 1 | | MasterBrand Cabinets | 10 |
| AutoZone | 2 | | McDonald's | 3 |
| Best Western | 1 | | Nike | 1 |
| Burger King | 1 | | Pizza Hut | 1 |
| Carl\s Jr. | 1 | | Quiznos | 1 |
| Decora Cabinetry | 1 | | Sears | 2 |
| Dennys | 1 | | Staples | 1 |
| El Pollo Loco | 1 | | Starbucks | 1 |
| FedEx | 2 | | Subway | 3 |
| Home Depot | 1 | | Super 8 | 1 |
| Jones New York | 1 | | T-Mobile | 1 |
| KFC | 1 | | Taco Bell | 2 |
| Kmart | 1 | | U-Haul | 1 |
| Kroger | 1 | | UPS | 1 |