Estimated zip code population in 2022: 18,747
Zip code population in 2010: 14,396
Zip code population in 2000: 9,786
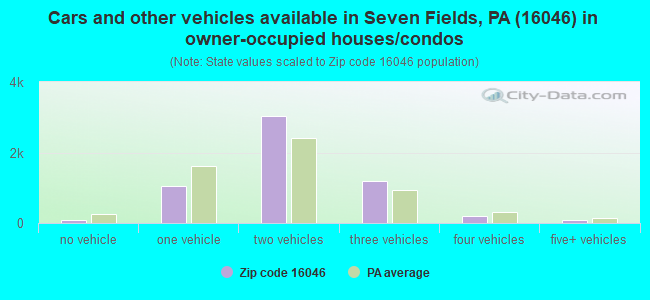
Houses and condos: 7,360
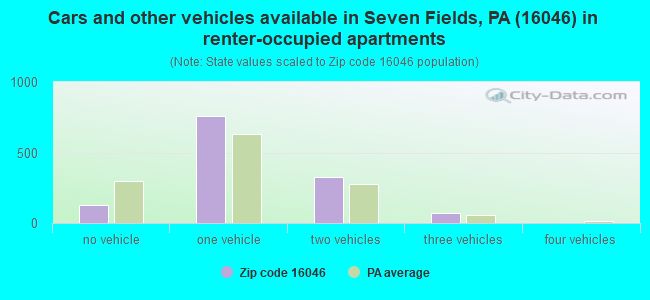
Renter-occupied apartments: 1,279
| % of renters here: | 18% |
| State: | 31% |
92.9
(less than average, U.S. average is 100)
Land area: 22.7
sq. mi.
Water area: 0.0
sq. mi.
| Population density: 824 people per square mile | | (low). |
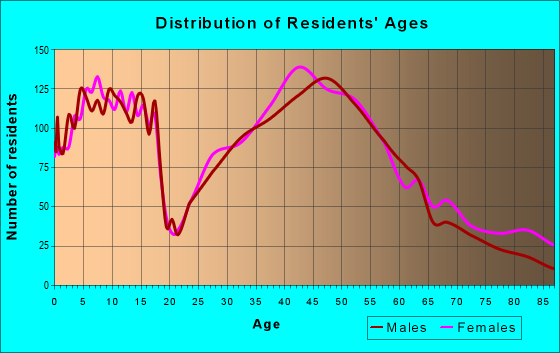
![Age and Sex of Residents in zip code 16046]()
- OSM Map
- General Map
- Google Map
- MSN Map
- OSM Map
- General Map
- Google Map
- MSN Map
- OSM Map
- General Map
- Google Map
- MSN Map
- OSM Map
- General Map
- Google Map
- MSN Map
Please wait while loading the map...
Real estate property taxes paid for housing units in 2022:
| This zip code: | 0.9% ($4,482) |
| Pennsylvania: | 1.3% ($3,094) |
$4,609 (0.9%)
Median real estate property taxes paid for housing units with no mortgage in 2022: $4,040 (0.9%)

Profiles of local businesses
Business Search - 14 Million verified businesses
| Males: 9,213 |  (49.1%) (49.1%) |
| Females: 9,533 |  (50.9%) (50.9%) |
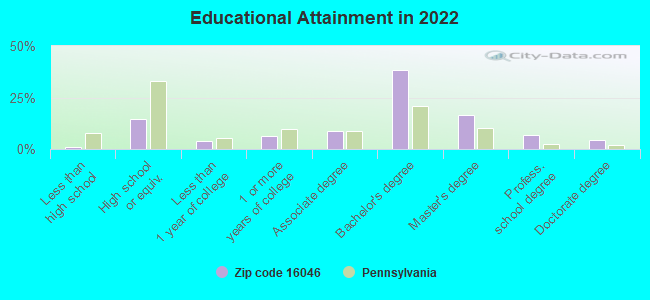
For population 25 years and over in 16046:
- High school or higher: 101.1%
- Bachelor's degree or higher: 67.0%
- Graduate or professional degree: 27.9%
- Unemployed: 3.7%
- Mean travel time to work (commute): 29.9 minutes
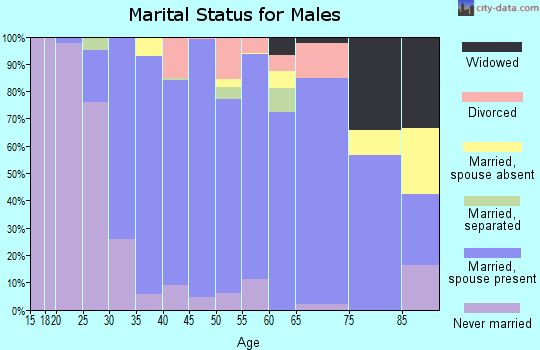
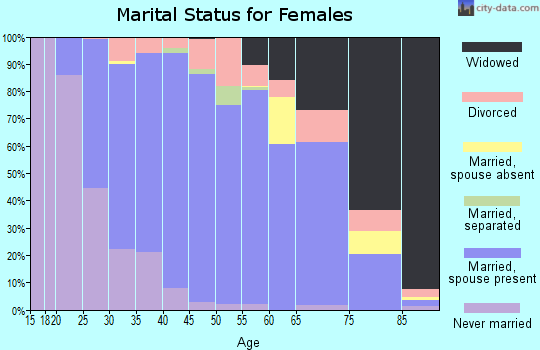
For population 15 years and over in 16046:
- Never married: 22.1%
- Now married: 65.1%
- Separated: 1.0%
- Widowed: 4.6%
- Divorced: 7.2%
Zip code 16046 compared to state average:
- Median household income above state average.
- Median house value above state average.
- Black race population percentage significantly below state average.
- Hispanic race population percentage significantly below state average.
- Renting percentage below state average.
- Number of rooms per house above state average.
- House age significantly below state average.
- Number of college students below state average.
- Percentage of population with a bachelor's degree or higher above state average.


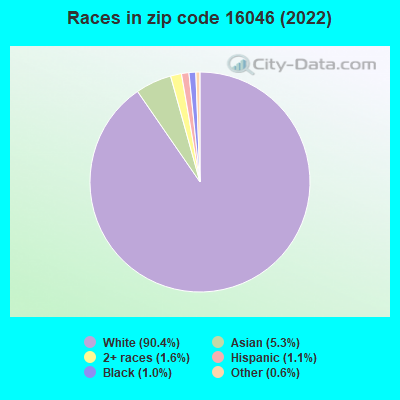
- 16,95090.4%White
- 9975.3%Asian
- 2951.6%Two or more races
- 2021.1%Hispanic or Latino
- 1951.0%Black
- 1040.6%Some other race
Data:
Urban population: 13,111
Rural population: 5,635
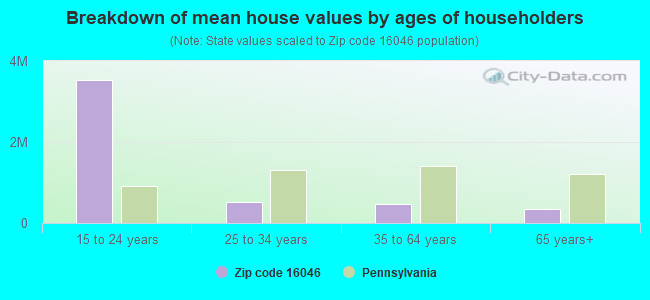
Estimated median house/condo value in 2022: $492,954
| 16046: | $492,954 |
| Pennsylvania: | $245,500 |
According to our research of Pennsylvania and other state lists, there were 10 registered sex offenders living in 16046 zip code as of July 23, 2024.
The ratio of all residents to sex offenders in zip code 16046 is 1,585 to 1.
The ratio of registered sex offenders to all residents in this zip code is much lower than the state average.
Median resident age:| This zip code: | 40.3 years |
| Pennsylvania median age: | 40.9 years |
Average household size:| This zip code: | 2.7 people |
| Pennsylvania: | 2.4 people |
Averages for the 2020 tax year for zip code 16046, filed in 2021:
Average Adjusted Gross Income (AGI) in 2020: $148,610 (Individual Income Tax Returns)
| Here: | $148,610 |
| State: | $75,707 |
Salary/wage: $129,282 (reported on 83.3% of returns)
| Here: | $129,282 |
| State: | $62,806 |
(% of AGI for various income ranges: 1110.5% for AGIs below $25k, 3493.2% for AGIs $25k-50k, 6137.0% for AGIs $50k-75k, 9072.4% for AGIs $75k-100k, 18149.0% for AGIs $100k-200k, 89049.4% for AGIs over 200k)
Taxable interest for individuals: $1,844 (reported on 48.4% of returns)
| This zip code: | $1,844 |
| Pennsylvania: | $1,633 |
(% of AGI for various income ranges: 26.9% for AGIs below $25k, 33.6% for AGIs $25k-50k, 69.1% for AGIs $50k-75k, 103.7% for AGIs $75k-100k, 165.7% for AGIs $100k-200k, 634.5% for AGIs over 200k)
Ordinary dividends: $6,477 (reported on 41.8% of returns)
(% of AGI for various income ranges: 76.4% for AGIs below $25k, 101.8% for AGIs $25k-50k, 177.2% for AGIs $50k-75k, 202.9% for AGIs $75k-100k, 400.4% for AGIs $100k-200k, 2251.5% for AGIs over 200k)
Net capital gain/loss in AGI: +$16,978 (reported on 38.0% of returns)
| Here: | +$16,978 |
| State: | +$23,522 |
(% of AGI for various income ranges: 37.6% for AGIs below $25k, 104.2% for AGIs $25k-50k, 129.1% for AGIs $50k-75k, 293.9% for AGIs $75k-100k, 507.9% for AGIs $100k-200k, 7042.8% for AGIs over 200k)
Profit/loss from business: +$26,176 (reported on 16.1% of returns)
| Here: | +$26,176 |
| State: | +$16,274 |
(% of AGI for various income ranges: 126.4% for AGIs below $25k, 226.1% for AGIs $25k-50k, 297.1% for AGIs $50k-75k, 463.2% for AGIs $75k-100k, 681.0% for AGIs $100k-200k, 3164.2% for AGIs over 200k)
Taxable individual retirement arrangement distribution: $27,119 (reported on 12.6% of returns)
| 16046: | $27,119 |
| Pennsylvania: | $18,583 |
(% of AGI for various income ranges: 106.9% for AGIs below $25k, 241.7% for AGIs $25k-50k, 426.4% for AGIs $50k-75k, 621.4% for AGIs $75k-100k, 888.1% for AGIs $100k-200k, 1468.0% for AGIs over 200k)
Self-employed (Keogh) retirement plans: $27,486 (reported on 1.5% of returns)
| 16046: | $27,486 |
| Pennsylvania: | $25,407 |
(% of AGI for various income ranges: 45.5% for AGIs $100k-200k, 456.1% for AGIs over 200k)
Total itemized deductions: $35,394 (reported on 18.2% of returns)
| Here: | $35,394 |
| State: | $34,850 |
(% of AGI for various income ranges: 99.1% for AGIs below $25k, 180.3% for AGIs $25k-50k, 254.3% for AGIs $50k-75k, 565.1% for AGIs $75k-100k, 993.1% for AGIs $100k-200k, 5552.8% for AGIs over 200k)
Charity contributions: $10,353 (reported on 15.0% of returns)
| Here: | $10,353 |
| State: | $12,392 |
(% of AGI for various income ranges: 5.6% for AGIs below $25k, 20.2% for AGIs $25k-50k, 30.3% for AGIs $50k-75k, 81.9% for AGIs $75k-100k, 172.9% for AGIs $100k-200k, 1598.0% for AGIs over 200k)
Taxes paid: $8,972 (reported on 18.2% of returns)
(% of AGI for various income ranges: 16.9% for AGIs below $25k, 29.8% for AGIs $25k-50k, 74.5% for AGIs $50k-75k, 163.7% for AGIs $75k-100k, 316.9% for AGIs $100k-200k, 1290.7% for AGIs over 200k)
Earned income credit: $1,607 (reported on 3.2% of returns)
(% of AGI for various income ranges: 23.6% for AGIs below $25k, 25.0% for AGIs $25k-50k)
Percentage of individuals using paid preparers for their 2020 taxes: 91.7%
(% for various income ranges: 88.2% for AGIs below $25k, 90.3% for AGIs $25k-50k, 91.9% for AGIs $50k-75k, 92.0% for AGIs $75k-100k, 92.8% for AGIs $100k-200k, 94.9% for AGIs over 200k)
Averages for the 2012 tax year for zip code 16046, filed in 2013:
Average Adjusted Gross Income (AGI) in 2012: $116,593 (Individual Income Tax Returns)
| Here: | $116,593 |
| State: | $61,346 |
Salary/wage: $99,844 (reported on 86.5% of returns)
| Here: | $99,844 |
| State: | $51,902 |
(% of AGI for various income ranges: 71.8% for AGIs below $25k, 74.5% for AGIs $25k-50k, 77.2% for AGIs $50k-75k, 79.6% for AGIs $75k-100k, 84.0% for AGIs $100k-200k, 67.3% for AGIs over 200k)
Taxable interest for individuals: $1,735 (reported on 49.6% of returns)
| This zip code: | $1,735 |
| Pennsylvania: | $1,588 |
(% of AGI for various income ranges: 1.7% for AGIs below $25k, 0.9% for AGIs $25k-50k, 0.7% for AGIs $50k-75k, 0.5% for AGIs $75k-100k, 0.5% for AGIs $100k-200k, 0.9% for AGIs over 200k)
Ordinary dividends: $5,341 (reported on 38.3% of returns)
(% of AGI for various income ranges: 3.1% for AGIs below $25k, 2.1% for AGIs $25k-50k, 1.5% for AGIs $50k-75k, 1.2% for AGIs $75k-100k, 1.2% for AGIs $100k-200k, 2.1% for AGIs over 200k)
Net capital gain/loss in AGI: +$13,642 (reported on 29.7% of returns)
| Here: | +$13,642 |
| State: | +$14,495 |
(% of AGI for various income ranges: 0.7% for AGIs $25k-50k, 0.4% for AGIs $50k-75k, 1.0% for AGIs $75k-100k, 1.0% for AGIs $100k-200k, 6.1% for AGIs over 200k)
Profit/loss from business: +$25,041 (reported on 15.3% of returns)
| Here: | +$25,041 |
| State: | +$16,268 |
(% of AGI for various income ranges: 5.4% for AGIs below $25k, 5.5% for AGIs $25k-50k, 3.6% for AGIs $50k-75k, 3.7% for AGIs $75k-100k, 3.6% for AGIs $100k-200k, 2.7% for AGIs over 200k)
Taxable individual retirement arrangement distribution: $20,262 (reported on 12.4% of returns)
| 16046: | $20,262 |
| Pennsylvania: | $14,550 |
(% of AGI for various income ranges: 5.2% for AGIs below $25k, 3.6% for AGIs $25k-50k, 3.4% for AGIs $50k-75k, 3.7% for AGIs $75k-100k, 2.2% for AGIs $100k-200k, 1.5% for AGIs over 200k)
Self-employment retirement plans: $18,555 (reported on 1.5% of returns)
| 16046: | $18,555 |
| Pennsylvania: | $20,922 |
(% of AGI for various income ranges: 0.4% for AGIs $25k-50k, 0.2% for AGIs $100k-200k, 0.3% for AGIs over 200k)
Total itemized deductions: $27,817 (15% of AGI, reported on 51.5% of returns)
| Here: | $27,817 |
| State: | $23,538 |
| Here: | 14.5% of AGI |
| State: | 18.4% of AGI |
(% of AGI for various income ranges: 12.8% for AGIs below $25k, 9.9% for AGIs $25k-50k, 12.4% for AGIs $50k-75k, 14.6% for AGIs $75k-100k, 14.9% for AGIs $100k-200k, 10.7% for AGIs over 200k)
Charity contributions: $4,478 (reported on 44.3% of returns)
(% of AGI for various income ranges: 0.8% for AGIs below $25k, 0.8% for AGIs $25k-50k, 1.3% for AGIs $50k-75k, 1.6% for AGIs $75k-100k, 1.7% for AGIs $100k-200k, 1.9% for AGIs over 200k)
Taxes paid: $12,856 (reported on 51.4% of returns)
| 16046: | $12,856 |
| State: | $9,982 |
(% of AGI for various income ranges: 2.7% for AGIs below $25k, 2.9% for AGIs $25k-50k, 4.4% for AGIs $50k-75k, 5.7% for AGIs $75k-100k, 6.6% for AGIs $100k-200k, 5.6% for AGIs over 200k)
Earned income credit: $1,711 (reported on 4.9% of returns)
(% of AGI for various income ranges: 2.5% for AGIs below $25k, 0.4% for AGIs $25k-50k)
Percentage of individuals using paid preparers for their 2012 taxes: 51.5%
(% for various income ranges: 43.0% for AGIs below $25k, 51.5% for AGIs $25k-50k, 52.8% for AGIs $50k-75k, 52.6% for AGIs $75k-100k, 52.0% for AGIs $100k-200k, 66.0% for AGIs over 200k)
Averages for the 2004 tax year for zip code 16046, filed in 2005:
Average Adjusted Gross Income (AGI) in 2004: $79,864 (Individual Income Tax Returns)
| Here: | $79,864 |
| State: | $48,049 |
Salary/wage: $73,818 (reported on 85.1% of returns)
| Here: | $73,818 |
| State: | $42,646 |
(% of AGI for various income ranges: 79.7% for AGIs below $10k, 69.1% for AGIs $10k-25k, 77.7% for AGIs $25k-50k, 82.8% for AGIs $50k-75k, 85.9% for AGIs $75k-100k, 76.9% for AGIs over 100k)
Taxable interest for individuals: $1,492 (reported on 64.4% of returns)
| This zip code: | $1,492 |
| Pennsylvania: | $1,657 |
(% of AGI for various income ranges: 4.9% for AGIs below $10k, 4.0% for AGIs $10k-25k, 1.4% for AGIs $25k-50k, 1.2% for AGIs $50k-75k, 1.3% for AGIs $75k-100k, 1.0% for AGIs over 100k)
Taxable dividends: $2,716 (reported on 42.1% of returns)
(% of AGI for various income ranges: 5.8% for AGIs below $10k, 3.1% for AGIs $10k-25k, 1.5% for AGIs $25k-50k, 1.4% for AGIs $50k-75k, 1.1% for AGIs $75k-100k, 1.4% for AGIs over 100k)
Net capital gain/loss: +$5,653 (reported on 32.9% of returns)
| Here: | +$5,653 |
| State: | +$9,716 |
(% of AGI for various income ranges: -2.2% for AGIs below $10k, 0.1% for AGIs $10k-25k, 0.1% for AGIs $25k-50k, 0.4% for AGIs $50k-75k, 1.2% for AGIs $75k-100k, 3.3% for AGIs over 100k)
Profit/loss from business: +$18,492 (reported on 16.4% of returns)
| Here: | +$18,492 |
| State: | +$14,267 |
(% of AGI for various income ranges: 6.0% for AGIs below $10k, 5.8% for AGIs $10k-25k, 5.4% for AGIs $25k-50k, 4.0% for AGIs $50k-75k, 2.9% for AGIs $75k-100k, 3.6% for AGIs over 100k)
IRA payment deduction: $3,196 (reported on 3.4% of returns)
| 16046: | $3,196 |
| Pennsylvania: | $2,903 |
(% of AGI for various income ranges: 0.5% for AGIs $10k-25k, 0.3% for AGIs $25k-50k, 0.3% for AGIs $50k-75k, 0.2% for AGIs $75k-100k, 0.1% for AGIs over 100k)
Self-employed pension: $12,121 (reported on 1.7% of returns)
| Here: | $12,121 |
| Pennsylvania: | $14,674 |
(% of AGI for various income ranges: 0.7% for AGIs $10k-25k, 0.3% for AGIs $50k-75k, 0.1% for AGIs $75k-100k, 0.3% for AGIs over 100k)
Total itemized deductions: $21,874 (17% of AGI, reported on 51.9% of returns)
| Here: | $21,874 |
| State: | $18,804 |
| Here: | 17.2% of AGI |
| State: | 19.5% of AGI |
(% of AGI for various income ranges: 10.9% for AGIs below $10k, 11.7% for AGIs $10k-25k, 12.7% for AGIs $25k-50k, 15.7% for AGIs $50k-75k, 18.0% for AGIs $75k-100k, 13.5% for AGIs over 100k)
Charity contributions deductions: $3,315 (3% of AGI, reported on 47.9% of returns)
| Here: | 2.5% of AGI |
| State: | 3.3% of AGI |
(% of AGI for various income ranges: 0.3% for AGIs below $10k, 1.7% for AGIs $10k-25k, 1.2% for AGIs $25k-50k, 1.8% for AGIs $50k-75k, 2.1% for AGIs $75k-100k, 2.1% for AGIs over 100k)
Total tax: $15,098 (reported on 83.2% of returns)
| 16046: | $15,098 |
| State: | $8,008 |
(% of AGI for various income ranges: 2.4% for AGIs below $10k, 5.0% for AGIs $10k-25k, 8.2% for AGIs $25k-50k, 9.4% for AGIs $50k-75k, 10.1% for AGIs $75k-100k, 19.6% for AGIs over 100k)
Earned income credit: $1,336 (reported on 4.3% of returns)
Percentage of individuals using paid preparers for their 2004 taxes: 51.8%
(% for various income ranges: 43.3% for AGIs below $10k, 51.1% for AGIs $10k-25k, 49.0% for AGIs $25k-50k, 57.2% for AGIs $50k-75k, 50.0% for AGIs $75k-100k, 58.3% for AGIs over 100k)
Estimated median household income in 2022: | This zip code: | $133,259 |
| Pennsylvania: | $71,798 |
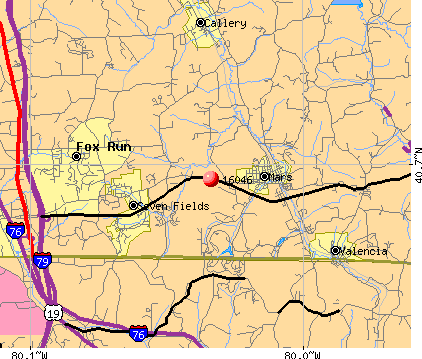
![Seven Fields, PA (16046) map]() Nearest zip codes: 16024
Nearest zip codes: 16024,
16066,
16033,
15015,
15086,
15090.
Seven Fields Zip Code Map
Percentage of family households:| This zip code: | 55.7% |
| Pennsylvania: | 42.6% |
Percentage of households with unmarried partners:| This zip code: | 2.8% |
| Pennsylvania: | 46.5% |
No gay or lesbian households reported
Household received Food Stamps/SNAP in the past 12 months: 167
Household did not receive Food Stamps/SNAP in the past 12 months: 6,752
Women who had a birth in the past 12 months: 267 (259 now married, 20 unmarried)
Women who did not have a birth in the past 12 months: 3,722 (2,254 now married, 1,441 unmarried)
Housing units in zip code 16046 with a mortgage: 4,059 (735
second mortgage, 710
both second mortgage and home equity loan)
Houses without a mortgage: 170
Median monthly owner costs for units with a mortgage: $2,319
Median monthly owner costs for units without a mortgage: $849
Residents with income below the poverty level in 2022:
| This zip code: | 2.8% |
| Whole state: | 11.8% |
| This zip code: | 0.4% |
| Whole state: | 6.1% |
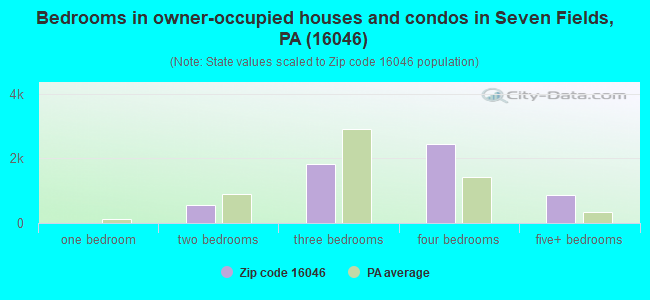
Median number of rooms in houses and condos:
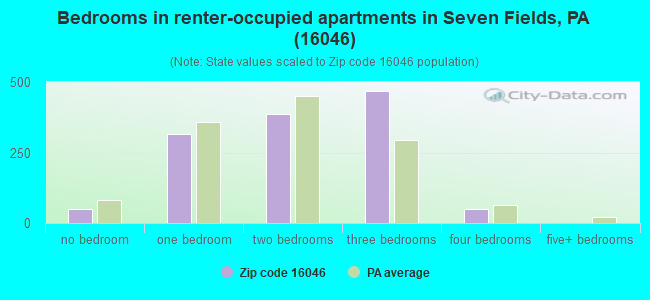
Median number of rooms in apartments:
Notable locations in this zip code not listed on our city pages
- Click to draw/clear zip code borders
Notable locations in zip code 16046: Venango Trail Golf Course (A), Family Resources Center (B), Mars Volunteer Fire Company (C), Fresh Air Home (D). Display/hide their locations on the map
Churches in zip code 16046 include: The Mars Alliance Church (A), Fountain Park Church (B), Mount Pleasant Church (C), Old Union Church (D). Display/hide their locations on the map
Cemeteries: Mount Pleasant Cemetery (1), Mount Olive Cemetery (2), Mars Cemetery (3). Display/hide their locations on the map
Streams, rivers, and creeks: Kaufman Run (A), Glade Run (B). Display/hide their locations on the map


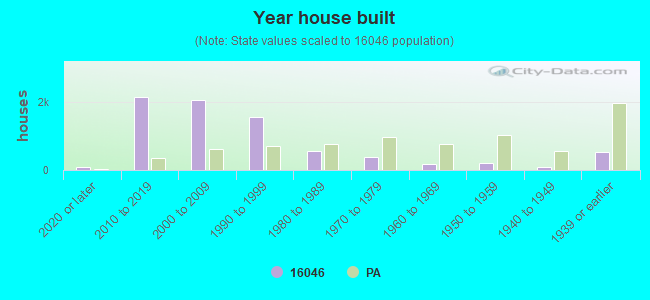
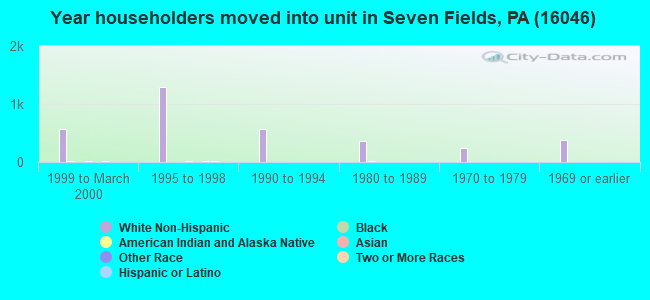
- Year house built (houses)
- 782020 or later
- 2,1262010 to 2019
- 2,0512000 to 2009
- 1,5481990 to 1999
- 5441980 to 1989
- 3721970 to 1979
- 1621960 to 1969
- 1991950 to 1959
- 971940 to 1949
- 5331939 or earlier
![Zip code 16046 satellite photo by USGS]()
Zip code 16046 household income distribution in 2022
![Zip code 16046 household income distribution in 2022]()
- 177Less than $10,000
- 54$10,000 to $14,999
- 108$15,000 to $19,999
- 28$20,000 to $24,999
- 102$25,000 to $29,999
- 129$30,000 to $34,999
- 79$35,000 to $39,999
- 111$40,000 to $44,999
- 131$45,000 to $49,999
- 162$50,000 to $59,999
- 518$60,000 to $74,999
- 639$75,000 to $99,999
- 1,029$100,000 to $124,999
- 752$125,000 to $149,999
- 880$150,000 to $199,999
- 2,044$200,000 or more
Estimate of home value of owner-occupied houses/condos in 2022 in zip code 16046
![Estimate of home value of owner-occupied houses/condos in 2022 in zip code 16046]()
- 19Less than $10,000
- 15$20,000 to $24,999
- 12$60,000 to $69,999
- 15$90,000 to $99,999
- 28$100,000 to $124,999
- 26$125,000 to $149,999
- 116$150,000 to $174,999
- 81$175,000 to $199,999
- 249$200,000 to $249,999
- 639$250,000 to $299,999
- 1,047$300,000 to $399,999
- 1,375$400,000 to $499,999
- 1,735$500,000 to $749,999
- 508$750,000 to $999,999
- 403$1,000,000 to $1,499,999
- 48$1,500,000 to $1,999,999
- 30$2,000,000 or more
Rent paid by renters in 2022 in zip code 16046
![Rent paid by renters in 2022 in zip code 16046]()
- 4$200 to $249
- 5$250 to $299
- 8$300 to $349
- 22$350 to $399
- 5$400 to $449
- 12$450 to $499
- 33$500 to $549
- 18$550 to $599
- 72$600 to $649
- 13$650 to $699
- 63$700 to $749
- 28$750 to $799
- 28$800 to $899
- 32$900 to $999
- 121$1,000 to $1,249
- 153$1,250 to $1,499
- 351$1,500 to $1,999
- 192$2,000 to $2,499
- 30$2,500 to $2,999
- 52$3,000 to $3,499
- 43No cash rent
Median gross rent in 2022: $1,650.
Median price asked for vacant for-sale houses and condos in 2022: $432,643.
Estimated median house (or condo) value in 2022 for:
- White Non-Hispanic householders: $502,444
- Black or African American householders: $181,438
- American Indian or Alaska Native householders: $125,611
- Asian householders: $404,746
- Two or more races householders: $497,140
- Hispanic or Latino householders: $383,811
Estimated median house or condo value in 2022: $492,954
| 16046: | $492,954 |
| Pennsylvania: | $245,500 |
$352,997 - $698,447
Mean price in 2022:
Detached houses: $481,466| Here: | $481,466 |
| State: | $317,202 |
Townhouses or other attached units: $241,898| Here: | $241,898 |
| State: | $254,369 |
In 3-to-4-unit structures: $575,920| Here: | $575,920 |
| State: | $297,446 |
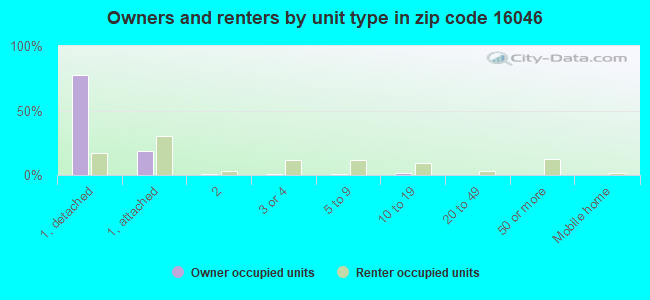
Housing units in structures:
- One, detached: 4,735
- One, attached: 1,528
- Two: 87
- 3 or 4: 231
- 5 to 9: 298
- 10 to 19: 205
- 20 to 49: 40
- 50 or more: 177
- Mobile homes: 37
Unemployment: 3.7%
Means of transportation to work in zip code 16046
![Means of transportation to work in zip code 16046]()
- 67.2%6,247Drove a car alone
- 5.1%473Carpooled
- 1.9%175Walked
- 0.8%74Other means
- 29.0%2,691Worked at home
Travel time to work (commute) in zip code 16046
![Travel time to work (commute) in zip code 16046]()
- 303Less than 5 minutes
- 5425 to 9 minutes
- 81910 to 14 minutes
- 66015 to 19 minutes
- 83520 to 24 minutes
- 32125 to 29 minutes
- 1,11930 to 34 minutes
- 38035 to 39 minutes
- 36540 to 44 minutes
- 1,03045 to 59 minutes
- 37260 to 89 minutes
- 17090 or more minutes
Percentage of zip code residents living and working in this county: 56.5%
Household type by relationship:
Households: 18,747
- Male householders: 3,652 (567 living alone), Female householders: 3,314 (954 living alone)
4,448 spouses (4,413 opposite-sex spouses), 300 unmarried partners, (259 opposite-sex unmarried partners), 6,063 children (5,836 natural, 162 adopted, 66 stepchildren), 174 grandchildren, 83 brothers or sisters, 324 parents, 0 foster children, 34 other relatives, 146 non-relatives
- In group quarters: 172 (-1 institutionalized population)
Size of family households: 1,812 2-persons, 1,230 3-persons, 1,303 4-persons, 380 5-persons, 173 6-persons, 152 7-or-more-persons
Size of nonfamily households: 1,520 1-person, 326 2-persons, 16 4-persons
4,642 married couples with children.
353 single-parent households (161 men, 192 women).
91.3% of residents of 16046 zip code speak English at home.
0.8% of residents speak Spanish at home (77% very well, 3% well, 20% not well).
3.6% of residents speak other Indo-European language at home (82% very well, 16% well, 2% not at all).
2.7% of residents speak Asian or Pacific Island language at home (82% very well, 12% well, 6% not well).
0.8% of residents speak other language at home (85% very well, 15% not well).
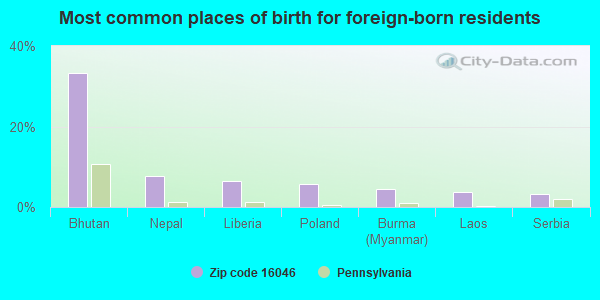
Foreign born population: 1,220 (6.5%)
(59.4%
of them are naturalized citizens)
| This zip code: | 6.5% |
| Whole state: | 7.5% |


- 33%Bhutan
- 8%Nepal
- 7%Liberia
- 6%Poland
- 5%Burma (Myanmar)
- 4%Laos
- 3%Serbia

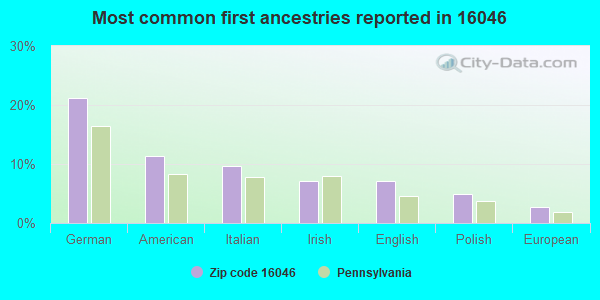
- 21%German
- 11%American
- 10%Italian
- 7%Irish
- 7%English
- 5%Polish
- 3%European

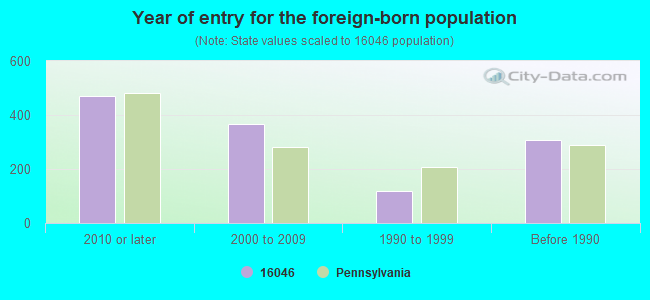
- Year of entry for the foreign-born population
- 4702010 or later
- 3652000 to 2009
- 1171990 to 1999
- 309Before 1990
![Zip code 16046 topographic map]()
Facilities with environmental interests located in this zip code:
- ADAMS EL SCH ( in MARS, PA)

(National Center for Education Statistics) - STATE ID-1155
Organizations: MARS AREA SD (SCHOOL DISTRICT)
- BASILON DRY CLEANERS (IRVINE ST in MARS, PA)
AIR MINOR (AIRS/AFS)
Small Quantity Generators, between 100 kg and 1000 kg of hazardous waste/month (Resource Conservation and Recovery Act (tracking hazardous waste)) - notification
Business SIC classification: DRYCLEANING PLANTS, EXCEPT RUG CLEANING
Organizations: OPERNAME (CONTACT/OPERATOR)
, BASILON, GEORGE (CONTACT/OWNER)
Alternative names: BASILON CLEANERS
- A CUBED CORP (CONCAST METAL in MARS, PA)
National Pollutant Discharge Elimination System NON-MAJOR (Tracking pollutant discharge elimination systems) - permit
Business SIC classification: SECONDARY SMELTING AND REFINING OF NONFERROUS METALS
Housing units lacking complete kitchen facilities: 1.2%

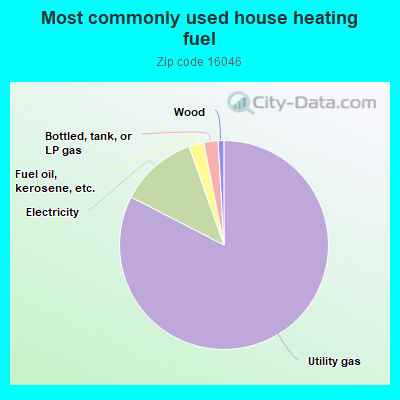
- 82.5%Utility gas
- 12.0%Electricity
- 2.3%Fuel oil, kerosene, etc.
- 2.2%Bottled, tank, or LP gas
- 0.9%Wood
Population in 1990: 10,192.
Place of birth for U.S.-born residents:
- This state: 12,631
- Northeast: 1,393
- Midwest: 1,816
- South: 1,339
- West: 328
51% of the 16046 zip code residents lived in the same house 5 years ago.
Out of people who lived in different houses, 37% lived in this county.
Out of people who lived in different counties, 50% lived in Pennsylvania.
89% of the 16046 zip code residents lived in the same house 1 year ago.
Out of people who lived in different houses, 57% moved from this county.
Out of people who lived in different houses, 22% moved from different county within same state.
Out of people who lived in different houses, 13% moved from different state.
Out of people who lived in different houses, 6% moved from abroad.
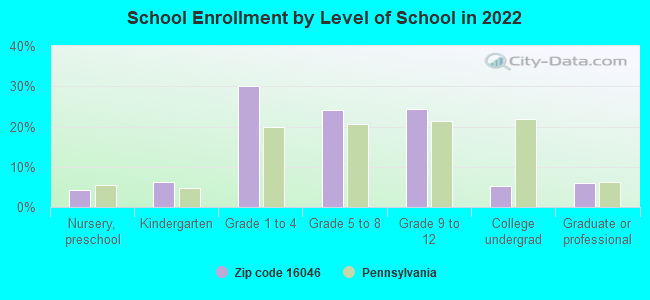
Private vs. public school enrollment:
Students in private schools in grades 1 to 8 (elementary and middle school): 246
| Here: | 9.2% |
| Pennsylvania: | 15.7% |
196
| Here: | 16.2% |
| Pennsylvania: | 13.4% |
154
| Here: | 60.1% |
| Pennsylvania: | 39.8% |

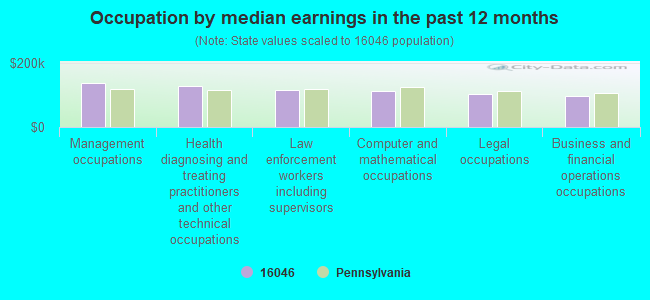
- Occupation by median earnings in the past 12 months ($)
- 138,428Management occupations
- 130,336Health diagnosing and treating practitioners and other technical occupations
- 115,623Law enforcement workers including supervisors
- 112,713Computer and mathematical occupations
- 103,014Legal occupations
- 97,627Business and financial operations occupations
Companies with federal contracts located in this zip code (MARS, PA):
- AMERICAN METALS CO (311 CLARK ST) : $194,280 in 14 contracts from 2004 to 2005
Contracts for Bushings, Rings, Shims, and Spacers, Motors, Electrical, Bearings, Plain, Unmounted by Defense Logistics Agency
Signed by year: 2000: $0; 2001: $0; 2002: $0; 2003: $0; 2004: $98,111; 2005: $96,169; 2006: $0.
Biggest contracts:
$54,714 with Defense Logistics Agency for Bushings, Rings, Shims, and Spacers. Signed on 2005-02-11. Completion date: 2005-06-11.
$29,198 with Defense Logistics Agency for Motors, Electrical. Signed on 2004-02-17. Completion date: 2004-08-05.
$21,434 with Defense Logistics Agency for Bushings, Rings, Shims, and Spacers. Signed on 2004-10-25. Completion date: 2005-04-27.
$20,860, same as above. Signed on 2004-11-10. Completion date: 2005-04-08.
- AIRGROUP AMERICA, INC (612 SHADY OAK COURT; small business)
50 employees, $0 revenue. : $96,500 in 3 contracts from 2002 to 2004
$62,000 with Defense Logistics Agency for Bearings, Antifriction, Unmounted. Signed on 2004-07-26. Completion date: 2005-03-07.
$59,750 with Air Force for Bearings, Antifriction, Unmounted. Signed on 2002-10-07. Completion date: 2002-10-18.
-$25,250, same as above. Signed on 2002-10-07. Completion date: 2002-10-18.
- JAMES AUSTIN COMPANY (115 DOWNIEVILLE RD; small business)
200 employees, $42000000 revenue.
$28,000 with Federal Supply Service for Chemicals. Taking place in FL. Signed on 1999-11-15. Completion date: 1999-12-15.
- ALLIANCE FIRE SYSTEMS INC (109 GRAND AVE; small business)
15 employees, $2700000 revenue.
$9,000 with Public Buildings Service for Maintenance, Repair or Alteration of Real Property -- Office Buildings. Signed on 2000-06-15. Completion date: 2001-06-15.
- INDUSTRIAL BRAKE COMPANY, INC (300 CLAY AVENUE; small business)
$2,992 with Army for Motors, Electrical. Taking place in KY. Signed on 2005-09-15. Completion date: 2005-09-12.
Top industries in this zip code by the number of employees in 2005:
- Accommodation and Food Services: Full-Service Restaurants (100-249 employees: 1 establishment, 50-99 employees: 7 establishments, 20-49 employees: 3 establishments, 10-19 employees: 2 establishments)
- Health Care and Social Assistance: Nursing Care Facilities (250-499: 1, 1-4: 1)
- Accommodation and Food Services: Limited-Service Restaurants (100-249: 1, 20-49: 2, 10-19: 1, 5-9: 1, 1-4: 5)
- Construction: Plumbing, Heating, and Air-Conditioning Contractors (100-249: 1, 10-19: 1, 5-9: 2, 1-4: 5)
- Accommodation and Food Services: Hotels (except Casino Hotels) and Motels (100-249: 1, 10-19: 2, 1-4: 1)
- Health Care and Social Assistance: Home Health Care Services (100-249: 1, 10-19: 1)
- Professional, Scientific, and Technical Services: Computer Systems Design Services (100-249: 1, 5-9: 1, 1-4: 1)
People in group quarters in 2010:
- 256 people in nursing facilities/skilled-nursing facilities
- 59 people in group homes for juveniles (non-correctional)
People in group quarters in 2000:
- 304 people in nursing homes
- 45 people in other noninstitutional group quarters
Fatal accident statistics in 2014:
- Fatal accident count: 2
- Vehicles involved in fatal accidents: 2
- Fatal accidents caused by drunken drivers: 1
- Fatalities: 2
- Persons involved in fatal accidents: 2
- Pedestrians involved in fatal accidents: 1
Fatal accident statistics in 2012:
- Fatal accident count: 2
- Vehicles involved in fatal accidents: 7
- Fatal accidents caused by drunken drivers: 1
- Fatalities: 2
- Persons involved in fatal accidents: 6
- Pedestrians involved in fatal accidents: 0
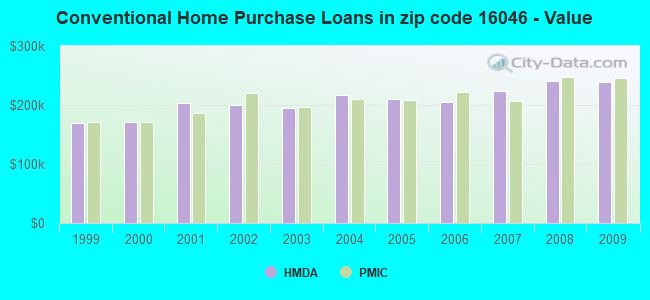
Home Mortgage Disclosure Act Aggregated Statistics For Year 2009
(Based on 4 partial tracts)
|
| A) FHA, FSA/RHS & VA
Home Purchase Loans | B) Conventional
Home Purchase Loans | C) Refinancings
| D) Home Improvement Loans
| F) Non-occupant Loans on
< 5 Family Dwellings (A B C & D) | G) Loans On Manufactured
Home Dwelling (A B C & D) |
|---|
| Number | Average Value | Number | Average Value | Number | Average Value | Number | Average Value | Number | Average Value | Number | Average Value |
|---|
| LOANS ORIGINATED | 53 | $208,393 | 311 | $239,636 | 759 | $251,075 | 43 | $54,229 | 27 | $197,180 | 3 | $42,850 |
| APPLICATIONS APPROVED, NOT ACCEPTED | 4 | $190,785 | 21 | $222,848 | 66 | $242,225 | 2 | $305,440 | 3 | $121,680 | 1 | $47,610 |
| APPLICATIONS DENIED | 11 | $218,109 | 35 | $186,377 | 154 | $254,468 | 23 | $96,020 | 6 | $146,000 | 11 | $48,816 |
| APPLICATIONS WITHDRAWN | 10 | $175,727 | 25 | $265,428 | 110 | $239,820 | 15 | $62,604 | 0 | $0 | 0 | $0 |
| FILES CLOSED FOR INCOMPLETENESS | 0 | $0 | 3 | $245,563 | 27 | $227,962 | 0 | $0 | 0 | $0 | 0 | $0 |
Aggregated Statistics For Year 2008
(Based on 4 partial tracts)
|
| A) FHA, FSA/RHS & VA
Home Purchase Loans | B) Conventional
Home Purchase Loans | C) Refinancings
| D) Home Improvement Loans
| E) Loans on Dwellings For 5+ Families
| F) Non-occupant Loans on
< 5 Family Dwellings (A B C & D) | G) Loans On Manufactured
Home Dwelling (A B C & D) |
|---|
| Number | Average Value | Number | Average Value | Number | Average Value | Number | Average Value | Number | Average Value | Number | Average Value | Number | Average Value |
|---|
| LOANS ORIGINATED | 49 | $221,288 | 435 | $240,621 | 276 | $244,747 | 54 | $102,709 | 1 | $505,230 | 31 | $249,779 | 7 | $74,633 |
| APPLICATIONS APPROVED, NOT ACCEPTED | 0 | $0 | 32 | $265,626 | 46 | $231,284 | 5 | $37,298 | 0 | $0 | 2 | $480,565 | 0 | $0 |
| APPLICATIONS DENIED | 2 | $183,860 | 29 | $215,959 | 165 | $230,095 | 40 | $88,506 | 0 | $0 | 7 | $118,116 | 5 | $109,512 |
| APPLICATIONS WITHDRAWN | 3 | $173,700 | 37 | $168,802 | 68 | $252,877 | 6 | $20,365 | 0 | $0 | 5 | $281,714 | 1 | $59,520 |
| FILES CLOSED FOR INCOMPLETENESS | 1 | $346,520 | 6 | $174,267 | 15 | $165,312 | 3 | $56,130 | 0 | $0 | 1 | $203,680 | 0 | $0 |
Aggregated Statistics For Year 2007
(Based on 4 partial tracts)
|
| A) FHA, FSA/RHS & VA
Home Purchase Loans | B) Conventional
Home Purchase Loans | C) Refinancings
| D) Home Improvement Loans
| E) Loans on Dwellings For 5+ Families
| F) Non-occupant Loans on
< 5 Family Dwellings (A B C & D) | G) Loans On Manufactured
Home Dwelling (A B C & D) |
|---|
| Number | Average Value | Number | Average Value | Number | Average Value | Number | Average Value | Number | Average Value | Number | Average Value | Number | Average Value |
|---|
| LOANS ORIGINATED | 11 | $157,315 | 629 | $222,928 | 260 | $198,455 | 67 | $53,580 | 1 | $1,157,280 | 34 | $144,679 | 5 | $61,104 |
| APPLICATIONS APPROVED, NOT ACCEPTED | 0 | $0 | 51 | $207,845 | 58 | $190,373 | 17 | $46,894 | 0 | $0 | 7 | $129,237 | 4 | $30,090 |
| APPLICATIONS DENIED | 1 | $215,580 | 38 | $291,494 | 188 | $180,151 | 33 | $77,830 | 0 | $0 | 9 | $246,456 | 4 | $83,655 |
| APPLICATIONS WITHDRAWN | 1 | $44,970 | 43 | $196,894 | 60 | $222,334 | 9 | $50,910 | 0 | $0 | 3 | $238,353 | 1 | $214,260 |
| FILES CLOSED FOR INCOMPLETENESS | 0 | $0 | 11 | $128,724 | 24 | $238,840 | 2 | $40,450 | 0 | $0 | 1 | $396,780 | 0 | $0 |
Aggregated Statistics For Year 2006
(Based on 4 partial tracts)
|
| A) FHA, FSA/RHS & VA
Home Purchase Loans | B) Conventional
Home Purchase Loans | C) Refinancings
| D) Home Improvement Loans
| F) Non-occupant Loans on
< 5 Family Dwellings (A B C & D) | G) Loans On Manufactured
Home Dwelling (A B C & D) |
|---|
| Number | Average Value | Number | Average Value | Number | Average Value | Number | Average Value | Number | Average Value | Number | Average Value |
|---|
| LOANS ORIGINATED | 11 | $160,510 | 644 | $204,857 | 265 | $166,632 | 93 | $52,755 | 35 | $176,935 | 7 | $24,184 |
| APPLICATIONS APPROVED, NOT ACCEPTED | 0 | $0 | 52 | $177,804 | 77 | $146,155 | 15 | $54,011 | 0 | $0 | 3 | $45,410 |
| APPLICATIONS DENIED | 0 | $0 | 78 | $203,090 | 201 | $164,858 | 43 | $51,244 | 6 | $190,167 | 11 | $85,728 |
| APPLICATIONS WITHDRAWN | 1 | $249,970 | 66 | $207,405 | 95 | $193,815 | 6 | $87,140 | 8 | $233,109 | 0 | $0 |
| FILES CLOSED FOR INCOMPLETENESS | 0 | $0 | 7 | $95,523 | 31 | $165,430 | 3 | $18,517 | 0 | $0 | 0 | $0 |
Aggregated Statistics For Year 2005
(Based on 4 partial tracts)
|
| A) FHA, FSA/RHS & VA
Home Purchase Loans | B) Conventional
Home Purchase Loans | C) Refinancings
| D) Home Improvement Loans
| E) Loans on Dwellings For 5+ Families
| F) Non-occupant Loans on
< 5 Family Dwellings (A B C & D) | G) Loans On Manufactured
Home Dwelling (A B C & D) |
|---|
| Number | Average Value | Number | Average Value | Number | Average Value | Number | Average Value | Number | Average Value | Number | Average Value | Number | Average Value |
|---|
| LOANS ORIGINATED | 3 | $156,947 | 646 | $209,535 | 335 | $195,322 | 91 | $47,839 | 0 | $0 | 26 | $208,443 | 9 | $69,918 |
| APPLICATIONS APPROVED, NOT ACCEPTED | 0 | $0 | 39 | $226,305 | 52 | $183,914 | 7 | $133,450 | 0 | $0 | 3 | $166,100 | 3 | $78,917 |
| APPLICATIONS DENIED | 1 | $230,130 | 66 | $160,178 | 180 | $191,191 | 44 | $68,685 | 0 | $0 | 11 | $92,684 | 15 | $57,964 |
| APPLICATIONS WITHDRAWN | 0 | $0 | 51 | $218,945 | 139 | $194,872 | 13 | $49,635 | 1 | $170,620 | 7 | $145,517 | 3 | $191,777 |
| FILES CLOSED FOR INCOMPLETENESS | 0 | $0 | 13 | $231,576 | 32 | $189,383 | 1 | $119,030 | 0 | $0 | 0 | $0 | 0 | $0 |
Aggregated Statistics For Year 2004
(Based on 4 partial tracts)
|
| A) FHA, FSA/RHS & VA
Home Purchase Loans | B) Conventional
Home Purchase Loans | C) Refinancings
| D) Home Improvement Loans
| F) Non-occupant Loans on
< 5 Family Dwellings (A B C & D) | G) Loans On Manufactured
Home Dwelling (A B C & D) |
|---|
| Number | Average Value | Number | Average Value | Number | Average Value | Number | Average Value | Number | Average Value | Number | Average Value |
|---|
| LOANS ORIGINATED | 11 | $150,017 | 520 | $217,075 | 456 | $197,653 | 101 | $41,058 | 32 | $138,472 | 5 | $35,182 |
| APPLICATIONS APPROVED, NOT ACCEPTED | 1 | $174,580 | 55 | $229,285 | 66 | $191,792 | 8 | $49,792 | 2 | $57,275 | 0 | $0 |
| APPLICATIONS DENIED | 1 | $95,230 | 52 | $172,162 | 163 | $204,950 | 37 | $37,916 | 11 | $83,268 | 9 | $80,384 |
| APPLICATIONS WITHDRAWN | 0 | $0 | 43 | $218,147 | 101 | $223,796 | 4 | $141,518 | 2 | $172,095 | 0 | $0 |
| FILES CLOSED FOR INCOMPLETENESS | 0 | $0 | 5 | $401,542 | 60 | $189,066 | 3 | $22,043 | 0 | $0 | 0 | $0 |
Aggregated Statistics For Year 2003
(Based on 4 partial tracts)
|
| A) FHA, FSA/RHS & VA
Home Purchase Loans | B) Conventional
Home Purchase Loans | C) Refinancings
| D) Home Improvement Loans
| F) Non-occupant Loans on
< 5 Family Dwellings (A B C & D) |
|---|
| Number | Average Value | Number | Average Value | Number | Average Value | Number | Average Value | Number | Average Value |
|---|
| LOANS ORIGINATED | 7 | $134,710 | 542 | $195,109 | 1,191 | $191,476 | 81 | $57,004 | 32 | $110,534 |
| APPLICATIONS APPROVED, NOT ACCEPTED | 0 | $0 | 33 | $112,560 | 149 | $182,247 | 23 | $77,504 | 4 | $43,315 |
| APPLICATIONS DENIED | 0 | $0 | 45 | $91,332 | 247 | $176,793 | 30 | $47,326 | 6 | $123,935 |
| APPLICATIONS WITHDRAWN | 1 | $158,710 | 45 | $176,017 | 127 | $167,278 | 3 | $27,877 | 7 | $100,517 |
| FILES CLOSED FOR INCOMPLETENESS | 0 | $0 | 13 | $163,735 | 28 | $226,909 | 4 | $26,612 | 4 | $101,180 |
Aggregated Statistics For Year 2002
(Based on 4 partial tracts)
|
| A) FHA, FSA/RHS & VA
Home Purchase Loans | B) Conventional
Home Purchase Loans | C) Refinancings
| D) Home Improvement Loans
| F) Non-occupant Loans on
< 5 Family Dwellings (A B C & D) |
|---|
| Number | Average Value | Number | Average Value | Number | Average Value | Number | Average Value | Number | Average Value |
|---|
| LOANS ORIGINATED | 7 | $111,666 | 401 | $200,519 | 731 | $192,628 | 78 | $46,252 | 11 | $94,701 |
| APPLICATIONS APPROVED, NOT ACCEPTED | 0 | $0 | 32 | $170,995 | 99 | $134,617 | 12 | $34,475 | 0 | $0 |
| APPLICATIONS DENIED | 0 | $0 | 44 | $107,577 | 172 | $176,280 | 16 | $68,512 | 6 | $53,380 |
| APPLICATIONS WITHDRAWN | 0 | $0 | 46 | $170,482 | 104 | $191,500 | 8 | $63,939 | 4 | $33,622 |
| FILES CLOSED FOR INCOMPLETENESS | 0 | $0 | 8 | $271,696 | 50 | $199,319 | 1 | $171,940 | 0 | $0 |
Aggregated Statistics For Year 2001
(Based on 4 partial tracts)
|
| A) FHA, FSA/RHS & VA
Home Purchase Loans | B) Conventional
Home Purchase Loans | C) Refinancings
| D) Home Improvement Loans
| F) Non-occupant Loans on
< 5 Family Dwellings (A B C & D) |
|---|
| Number | Average Value | Number | Average Value | Number | Average Value | Number | Average Value | Number | Average Value |
|---|
| LOANS ORIGINATED | 6 | $104,418 | 289 | $203,342 | 473 | $169,091 | 125 | $27,221 | 11 | $89,767 |
| APPLICATIONS APPROVED, NOT ACCEPTED | 0 | $0 | 32 | $118,239 | 77 | $105,459 | 24 | $36,583 | 4 | $136,558 |
| APPLICATIONS DENIED | 0 | $0 | 52 | $96,999 | 183 | $124,628 | 30 | $16,138 | 2 | $52,925 |
| APPLICATIONS WITHDRAWN | 0 | $0 | 21 | $163,448 | 141 | $140,302 | 17 | $34,284 | 3 | $145,047 |
| FILES CLOSED FOR INCOMPLETENESS | 0 | $0 | 3 | $371,497 | 24 | $173,222 | 1 | $66,130 | 0 | $0 |
Aggregated Statistics For Year 2000
(Based on 4 partial tracts)
|
| A) FHA, FSA/RHS & VA
Home Purchase Loans | B) Conventional
Home Purchase Loans | C) Refinancings
| D) Home Improvement Loans
| E) Loans on Dwellings For 5+ Families
| F) Non-occupant Loans on
< 5 Family Dwellings (A B C & D) |
|---|
| Number | Average Value | Number | Average Value | Number | Average Value | Number | Average Value | Number | Average Value | Number | Average Value |
|---|
| LOANS ORIGINATED | 11 | $105,985 | 372 | $170,766 | 152 | $99,230 | 94 | $25,895 | 1 | $145,490 | 15 | $189,059 |
| APPLICATIONS APPROVED, NOT ACCEPTED | 0 | $0 | 28 | $131,812 | 42 | $96,504 | 6 | $34,068 | 0 | $0 | 3 | $70,540 |
| APPLICATIONS DENIED | 0 | $0 | 41 | $67,254 | 116 | $104,234 | 21 | $34,273 | 0 | $0 | 5 | $106,672 |
| APPLICATIONS WITHDRAWN | 3 | $67,013 | 28 | $138,993 | 47 | $107,777 | 9 | $52,430 | 0 | $0 | 1 | $144,160 |
| FILES CLOSED FOR INCOMPLETENESS | 1 | $145,490 | 3 | $79,797 | 23 | $122,888 | 1 | $19,040 | 0 | $0 | 0 | $0 |
Aggregated Statistics For Year 1999
(Based on 2 partial tracts)
|
| A) FHA, FSA/RHS & VA
Home Purchase Loans | B) Conventional
Home Purchase Loans | C) Refinancings
| D) Home Improvement Loans
| F) Non-occupant Loans on
< 5 Family Dwellings (A B C & D) |
|---|
| Number | Average Value | Number | Average Value | Number | Average Value | Number | Average Value | Number | Average Value |
|---|
| LOANS ORIGINATED | 4 | $101,305 | 219 | $170,302 | 136 | $118,297 | 45 | $26,941 | 12 | $192,662 |
| APPLICATIONS APPROVED, NOT ACCEPTED | 0 | $0 | 12 | $119,786 | 26 | $102,350 | 6 | $23,640 | 1 | $46,200 |
| APPLICATIONS DENIED | 2 | $110,920 | 28 | $142,580 | 55 | $99,535 | 9 | $23,251 | 1 | $149,850 |
| APPLICATIONS WITHDRAWN | 1 | $82,500 | 14 | $170,253 | 35 | $110,655 | 4 | $90,542 | 2 | $48,180 |
| FILES CLOSED FOR INCOMPLETENESS | 0 | $0 | 2 | $168,255 | 9 | $128,294 | 1 | $1,320 | 0 | $0 |
,
9124.00
Private Mortgage Insurance Companies Aggregated Statistics For Year 2009
(Based on 4 partial tracts)
|
| A) Conventional
Home Purchase Loans | B) Refinancings
|
|---|
| Number | Average Value | Number | Average Value |
|---|
| LOANS ORIGINATED | 51 | $245,911 | 20 | $283,385 |
| APPLICATIONS APPROVED, NOT ACCEPTED | 5 | $226,436 | 13 | $329,515 |
| APPLICATIONS DENIED | 7 | $190,741 | 1 | $142,840 |
| APPLICATIONS WITHDRAWN | 0 | $0 | 0 | $0 |
| FILES CLOSED FOR INCOMPLETENESS | 0 | $0 | 0 | $0 |
Aggregated Statistics For Year 2008
(Based on 4 partial tracts)
|
| A) Conventional
Home Purchase Loans | B) Refinancings
| C) Non-occupant Loans on
< 5 Family Dwellings (A & B) | D) Loans On Manufactured
Home Dwelling (A & B) |
|---|
| Number | Average Value | Number | Average Value | Number | Average Value | Number | Average Value |
|---|
| LOANS ORIGINATED | 107 | $247,431 | 16 | $225,365 | 4 | $236,745 | 1 | $126,970 |
| APPLICATIONS APPROVED, NOT ACCEPTED | 28 | $277,662 | 12 | $176,632 | 0 | $0 | 1 | $126,970 |
| APPLICATIONS DENIED | 7 | $122,813 | 1 | $191,780 | 3 | $151,657 | 1 | $126,970 |
| APPLICATIONS WITHDRAWN | 3 | $391,803 | 0 | $0 | 0 | $0 | 1 | $126,970 |
| FILES CLOSED FOR INCOMPLETENESS | 0 | $0 | 4 | $205,332 | 0 | $0 | 0 | $0 |
Aggregated Statistics For Year 2007
(Based on 4 partial tracts)
|
| A) Conventional
Home Purchase Loans | B) Refinancings
| C) Non-occupant Loans on
< 5 Family Dwellings (A & B) |
|---|
| Number | Average Value | Number | Average Value | Number | Average Value |
|---|
| LOANS ORIGINATED | 85 | $206,202 | 19 | $213,722 | 5 | $143,106 |
| APPLICATIONS APPROVED, NOT ACCEPTED | 20 | $252,551 | 8 | $271,379 | 1 | $197,070 |
| APPLICATIONS DENIED | 4 | $117,380 | 5 | $287,798 | 0 | $0 |
| APPLICATIONS WITHDRAWN | 0 | $0 | 1 | $394,130 | 0 | $0 |
| FILES CLOSED FOR INCOMPLETENESS | 0 | $0 | 1 | $394,130 | 0 | $0 |
Aggregated Statistics For Year 2006
(Based on 4 partial tracts)
|
| A) Conventional
Home Purchase Loans | B) Refinancings
| C) Non-occupant Loans on
< 5 Family Dwellings (A & B) |
|---|
| Number | Average Value | Number | Average Value | Number | Average Value |
|---|
| LOANS ORIGINATED | 51 | $222,101 | 15 | $176,681 | 3 | $246,157 |
| APPLICATIONS APPROVED, NOT ACCEPTED | 12 | $243,316 | 7 | $151,786 | 1 | $83,320 |
| APPLICATIONS DENIED | 0 | $0 | 1 | $628,240 | 0 | $0 |
| APPLICATIONS WITHDRAWN | 2 | $121,540 | 1 | $171,940 | 0 | $0 |
| FILES CLOSED FOR INCOMPLETENESS | 1 | $616,330 | 0 | $0 | 0 | $0 |
Aggregated Statistics For Year 2005
(Based on 4 partial tracts)
|
| A) Conventional
Home Purchase Loans | B) Refinancings
| C) Non-occupant Loans on
< 5 Family Dwellings (A & B) |
|---|
| Number | Average Value | Number | Average Value | Number | Average Value |
|---|
| LOANS ORIGINATED | 73 | $207,734 | 7 | $211,689 | 2 | $177,355 |
| APPLICATIONS APPROVED, NOT ACCEPTED | 17 | $216,104 | 8 | $197,730 | 0 | $0 |
| APPLICATIONS DENIED | 3 | $167,970 | 0 | $0 | 0 | $0 |
| APPLICATIONS WITHDRAWN | 4 | $227,818 | 0 | $0 | 0 | $0 |
| FILES CLOSED FOR INCOMPLETENESS | 0 | $0 | 1 | $263,200 | 0 | $0 |
Aggregated Statistics For Year 2004
(Based on 4 partial tracts)
|
| A) Conventional
Home Purchase Loans | B) Refinancings
| C) Non-occupant Loans on
< 5 Family Dwellings (A & B) |
|---|
| Number | Average Value | Number | Average Value | Number | Average Value |
|---|
| LOANS ORIGINATED | 72 | $209,906 | 23 | $250,497 | 4 | $105,478 |
| APPLICATIONS APPROVED, NOT ACCEPTED | 24 | $232,135 | 6 | $119,073 | 1 | $95,230 |
| APPLICATIONS DENIED | 1 | $232,780 | 1 | $681,140 | 0 | $0 |
| APPLICATIONS WITHDRAWN | 4 | $175,905 | 0 | $0 | 0 | $0 |
| FILES CLOSED FOR INCOMPLETENESS | 0 | $0 | 0 | $0 | 0 | $0 |
Aggregated Statistics For Year 2003
(Based on 4 partial tracts)
|
| A) Conventional
Home Purchase Loans | B) Refinancings
| C) Non-occupant Loans on
< 5 Family Dwellings (A & B) |
|---|
| Number | Average Value | Number | Average Value | Number | Average Value |
|---|
| LOANS ORIGINATED | 101 | $196,060 | 47 | $168,640 | 3 | $55,550 |
| APPLICATIONS APPROVED, NOT ACCEPTED | 22 | $195,218 | 12 | $171,283 | 1 | $249,970 |
| APPLICATIONS DENIED | 3 | $162,240 | 1 | $396,780 | 0 | $0 |
| APPLICATIONS WITHDRAWN | 3 | $179,960 | 13 | $142,130 | 3 | $112,420 |
| FILES CLOSED FOR INCOMPLETENESS | 0 | $0 | 0 | $0 | 0 | $0 |
Aggregated Statistics For Year 2002
(Based on 4 partial tracts)
|
| A) Conventional
Home Purchase Loans | B) Refinancings
|
|---|
| Number | Average Value | Number | Average Value |
|---|
| LOANS ORIGINATED | 78 | $220,810 | 38 | $201,436 |
| APPLICATIONS APPROVED, NOT ACCEPTED | 9 | $223,576 | 5 | $280,880 |
| APPLICATIONS DENIED | 0 | $0 | 0 | $0 |
| APPLICATIONS WITHDRAWN | 1 | $272,460 | 3 | $184,923 |
| FILES CLOSED FOR INCOMPLETENESS | 0 | $0 | 1 | $367,680 |
Aggregated Statistics For Year 2001
(Based on 4 partial tracts)
|
| A) Conventional
Home Purchase Loans | B) Refinancings
|
|---|
| Number | Average Value | Number | Average Value |
|---|
| LOANS ORIGINATED | 49 | $187,200 | 24 | $154,723 |
| APPLICATIONS APPROVED, NOT ACCEPTED | 8 | $193,618 | 2 | $195,040 |
| APPLICATIONS DENIED | 1 | $380,910 | 3 | $134,023 |
| APPLICATIONS WITHDRAWN | 0 | $0 | 0 | $0 |
| FILES CLOSED FOR INCOMPLETENESS | 3 | $80,237 | 0 | $0 |
Aggregated Statistics For Year 2000
(Based on 4 partial tracts)
|
| A) Conventional
Home Purchase Loans | B) Refinancings
|
|---|
| Number | Average Value | Number | Average Value |
|---|
| LOANS ORIGINATED | 63 | $170,493 | 6 | $115,660 |
| APPLICATIONS APPROVED, NOT ACCEPTED | 19 | $158,929 | 0 | $0 |
| APPLICATIONS DENIED | 2 | $148,760 | 0 | $0 |
| APPLICATIONS WITHDRAWN | 2 | $159,665 | 0 | $0 |
| FILES CLOSED FOR INCOMPLETENESS | 0 | $0 | 0 | $0 |
Aggregated Statistics For Year 1999
(Based on 2 partial tracts)
|
| A) Conventional
Home Purchase Loans | B) Refinancings
|
|---|
| Number | Average Value | Number | Average Value |
|---|
| LOANS ORIGINATED | 43 | $171,687 | 9 | $132,244 |
| APPLICATIONS APPROVED, NOT ACCEPTED | 10 | $181,944 | 5 | $167,598 |
| APPLICATIONS DENIED | 0 | $0 | 1 | $297,000 |
| APPLICATIONS WITHDRAWN | 1 | $240,240 | 1 | $69,050 |
| FILES CLOSED FOR INCOMPLETENESS | 1 | $132,000 | 0 | $0 |
,
9124.00
2003 - 2018 National Fire Incident Reporting System (NFIRS) incidents
See full 2006 National Fire Incident Reporting System statistics for zip code 16046, Pennsylvania
| Most common first names in zip code 16046 among deceased individuals |
| Name | Count | Lived (average) |
|---|
| Mary | 120 | 84.1 years |
| John | 76 | 77.2 years |
| William | 75 | 78.2 years |
| Helen | 68 | 82.6 years |
| Margaret | 62 | 83.6 years |
| James | 57 | 74.8 years |
| Anna | 56 | 87.0 years |
| Robert | 54 | 75.6 years |
| Charles | 54 | 76.2 years |
| Ruth | 45 | 83.3 years |
| Most common last names in zip code 16046 among deceased individuals |
| Last name | Count | Lived (average) |
|---|
| Miller | 21 | 81.6 years |
| Campbell | 15 | 79.3 years |
| Smith | 15 | 84.7 years |
| Kennedy | 13 | 77.9 years |
| Jones | 13 | 67.2 years |
| Wilson | 12 | 81.8 years |
| Mccandless | 12 | 75.1 years |
| Grubbs | 10 | 76.6 years |
| Cooper | 10 | 79.4 years |
| Anderson | 10 | 81.4 years |
| Businesses in zip code 16046 |
| Name | Count | | Name | Count |
| 7-Eleven | 1 | | Motel 6 | 1 |
| Arby's | 1 | | New Balance | 2 |
| Burger King | 1 | | Pizza Hut | 1 |
| Comfort Inn | 1 | | Rite Aid | 2 |
| Curves | 1 | | Toyota | 1 |
| Dairy Queen | 1 | | True Value | 1 |
| FedEx | 3 | | UPS | 2 |
| Jones New York | 1 | | Walgreens | 1 |
| McDonald's | 1 | | | |