Estimated zip code population in 2022: 24,930
Zip code population in 2010: 21,202
Zip code population in 2000: 18,252
Houses and condos: 9,775
Renter-occupied apartments: 2,002
| % of renters here: | 21% |
| State: | 31% |
96.7
(near average, U.S. average is 100)
Land area: 21.1
sq. mi.
Water area: 0.0
sq. mi.
| Population density: 1,180 people per square mile | | (low). |
![Age and Sex of Residents in zip code 15090]()
- OSM Map
- General Map
- Google Map
- MSN Map
- OSM Map
- General Map
- Google Map
- MSN Map
- OSM Map
- General Map
- Google Map
- MSN Map
- OSM Map
- General Map
- Google Map
- MSN Map
Please wait while loading the map...
Real estate property taxes paid for housing units in 2022:
| This zip code: | 1.5% ($6,587) |
| Pennsylvania: | 1.3% ($3,094) |
$6,994 (1.5%)
Median real estate property taxes paid for housing units with no mortgage in 2022: $5,699 (1.3%)

Profiles of local businesses
Business Search - 14 Million verified businesses
| Males: 12,648 |  (50.7%) (50.7%) |
| Females: 12,282 |  (49.3%) (49.3%) |
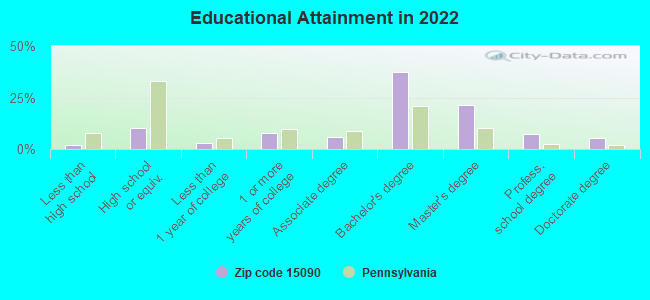
For population 25 years and over in 15090:
- High school or higher: 100.2%
- Bachelor's degree or higher: 73.2%
- Graduate or professional degree: 34.7%
- Unemployed: 1.7%
- Mean travel time to work (commute): 28.1 minutes
For population 15 years and over in 15090:
- Never married: 25.3%
- Now married: 61.8%
- Separated: 1.2%
- Widowed: 3.5%
- Divorced: 8.2%
Zip code 15090 compared to state average:
- Median household income above state average.
- Median house value above state average.
- Unemployed percentage below state average.
- Black race population percentage significantly below state average.
- Number of rooms per house above state average.
- House age significantly below state average.
- Percentage of population with a bachelor's degree or higher above state average.


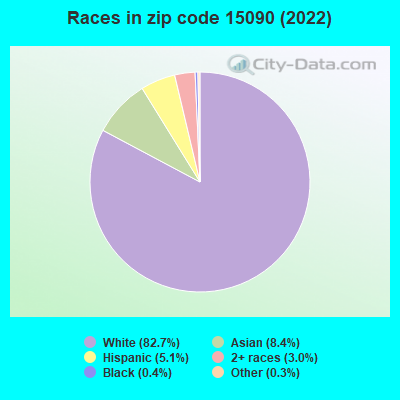
- 20,61582.7%White
- 2,0918.4%Asian
- 1,2705.1%Hispanic or Latino
- 7593.0%Two or more races
- 1080.4%Black
- 840.3%Some other race
Data:
Urban population: 22,266
Rural population: 2,663
Estimated median house/condo value in 2022: $452,580
| 15090: | $452,580 |
| Pennsylvania: | $245,500 |
According to our research of Pennsylvania and other state lists, there were 6 registered sex offenders living in 15090 zip code as of July 23, 2024.
The ratio of all residents to sex offenders in zip code 15090 is 4,025 to 1.
The ratio of registered sex offenders to all residents in this zip code is much lower than the state average.
Median resident age:| This zip code: | 39.8 years |
| Pennsylvania median age: | 40.9 years |
Average household size:| This zip code: | 2.6 people |
| Pennsylvania: | 2.4 people |
Averages for the 2020 tax year for zip code 15090, filed in 2021:
Average Adjusted Gross Income (AGI) in 2020: $178,471 (Individual Income Tax Returns)
| Here: | $178,471 |
| State: | $75,707 |
Salary/wage: $141,707 (reported on 82.7% of returns)
| Here: | $141,707 |
| State: | $62,806 |
(% of AGI for various income ranges: 1135.0% for AGIs below $25k, 3586.2% for AGIs $25k-50k, 6240.3% for AGIs $50k-75k, 9369.5% for AGIs $75k-100k, 19053.5% for AGIs $100k-200k, 101859.5% for AGIs over 200k)
Taxable interest for individuals: $2,506 (reported on 51.8% of returns)
| This zip code: | $2,506 |
| Pennsylvania: | $1,633 |
(% of AGI for various income ranges: 37.3% for AGIs below $25k, 42.4% for AGIs $25k-50k, 61.3% for AGIs $50k-75k, 93.9% for AGIs $75k-100k, 171.2% for AGIs $100k-200k, 1173.2% for AGIs over 200k)
Ordinary dividends: $8,480 (reported on 47.1% of returns)
(% of AGI for various income ranges: 75.3% for AGIs below $25k, 115.8% for AGIs $25k-50k, 236.6% for AGIs $50k-75k, 329.8% for AGIs $75k-100k, 590.1% for AGIs $100k-200k, 3498.5% for AGIs over 200k)
Net capital gain/loss in AGI: +$33,987 (reported on 42.7% of returns)
| Here: | +$33,987 |
| State: | +$23,522 |
(% of AGI for various income ranges: 73.3% for AGIs below $25k, 124.3% for AGIs $25k-50k, 230.0% for AGIs $50k-75k, 338.0% for AGIs $75k-100k, 827.1% for AGIs $100k-200k, 16864.9% for AGIs over 200k)
Profit/loss from business: +$28,428 (reported on 17.6% of returns)
| Here: | +$28,428 |
| State: | +$16,274 |
(% of AGI for various income ranges: 124.2% for AGIs below $25k, 202.1% for AGIs $25k-50k, 328.7% for AGIs $50k-75k, 343.9% for AGIs $75k-100k, 900.7% for AGIs $100k-200k, 3998.2% for AGIs over 200k)
Taxable individual retirement arrangement distribution: $31,435 (reported on 13.7% of returns)
| 15090: | $31,435 |
| Pennsylvania: | $18,583 |
(% of AGI for various income ranges: 94.7% for AGIs below $25k, 196.7% for AGIs $25k-50k, 430.7% for AGIs $50k-75k, 593.6% for AGIs $75k-100k, 1117.7% for AGIs $100k-200k, 2485.5% for AGIs over 200k)
Self-employed (Keogh) retirement plans: $26,936 (reported on 2.3% of returns)
| 15090: | $26,936 |
| Pennsylvania: | $25,407 |
(% of AGI for various income ranges: 20.4% for AGIs below $25k, 62.0% for AGIs $100k-200k, 679.1% for AGIs over 200k)
Total itemized deductions: $44,316 (reported on 16.7% of returns)
| Here: | $44,316 |
| State: | $34,850 |
(% of AGI for various income ranges: 124.6% for AGIs below $25k, 161.8% for AGIs $25k-50k, 406.4% for AGIs $50k-75k, 517.7% for AGIs $75k-100k, 951.8% for AGIs $100k-200k, 6890.8% for AGIs over 200k)
Charity contributions: $20,684 (reported on 14.2% of returns)
| Here: | $20,684 |
| State: | $12,392 |
(% of AGI for various income ranges: 5.7% for AGIs below $25k, 11.8% for AGIs $25k-50k, 51.6% for AGIs $50k-75k, 68.6% for AGIs $75k-100k, 191.7% for AGIs $100k-200k, 3388.8% for AGIs over 200k)
Taxes paid: $9,311 (reported on 16.7% of returns)
(% of AGI for various income ranges: 18.7% for AGIs below $25k, 35.7% for AGIs $25k-50k, 113.4% for AGIs $50k-75k, 184.2% for AGIs $75k-100k, 323.6% for AGIs $100k-200k, 1161.2% for AGIs over 200k)
Earned income credit: $1,552 (reported on 3.5% of returns)
(% of AGI for various income ranges: 27.4% for AGIs below $25k, 25.3% for AGIs $25k-50k)
Percentage of individuals using paid preparers for their 2020 taxes: 91.0%
(% for various income ranges: 88.5% for AGIs below $25k, 91.7% for AGIs $25k-50k, 90.5% for AGIs $50k-75k, 91.9% for AGIs $75k-100k, 90.8% for AGIs $100k-200k, 93.5% for AGIs over 200k)
Averages for the 2012 tax year for zip code 15090, filed in 2013:
Average Adjusted Gross Income (AGI) in 2012: $141,319 (Individual Income Tax Returns)
| Here: | $141,319 |
| State: | $61,346 |
Salary/wage: $116,918 (reported on 85.5% of returns)
| Here: | $116,918 |
| State: | $51,902 |
(% of AGI for various income ranges: 69.9% for AGIs below $25k, 72.6% for AGIs $25k-50k, 70.9% for AGIs $50k-75k, 75.8% for AGIs $75k-100k, 81.8% for AGIs $100k-200k, 65.9% for AGIs over 200k)
Taxable interest for individuals: $2,015 (reported on 54.7% of returns)
| This zip code: | $2,015 |
| Pennsylvania: | $1,588 |
(% of AGI for various income ranges: 2.4% for AGIs below $25k, 1.2% for AGIs $25k-50k, 1.0% for AGIs $50k-75k, 0.7% for AGIs $75k-100k, 0.5% for AGIs $100k-200k, 0.8% for AGIs over 200k)
Ordinary dividends: $8,733 (reported on 46.7% of returns)
(% of AGI for various income ranges: 5.3% for AGIs below $25k, 2.2% for AGIs $25k-50k, 2.7% for AGIs $50k-75k, 2.5% for AGIs $75k-100k, 1.6% for AGIs $100k-200k, 3.4% for AGIs over 200k)
Net capital gain/loss in AGI: +$17,225 (reported on 37.5% of returns)
| Here: | +$17,225 |
| State: | +$14,495 |
(% of AGI for various income ranges: 1.0% for AGIs below $25k, 1.1% for AGIs $25k-50k, 0.9% for AGIs $50k-75k, 1.1% for AGIs $75k-100k, 1.1% for AGIs $100k-200k, 6.8% for AGIs over 200k)
Profit/loss from business: +$30,573 (reported on 16.9% of returns)
| Here: | +$30,573 |
| State: | +$16,268 |
(% of AGI for various income ranges: 5.6% for AGIs below $25k, 5.6% for AGIs $25k-50k, 4.2% for AGIs $50k-75k, 5.0% for AGIs $75k-100k, 4.3% for AGIs $100k-200k, 3.1% for AGIs over 200k)
Taxable individual retirement arrangement distribution: $25,224 (reported on 12.9% of returns)
| 15090: | $25,224 |
| Pennsylvania: | $14,550 |
(% of AGI for various income ranges: 6.4% for AGIs below $25k, 4.2% for AGIs $25k-50k, 4.3% for AGIs $50k-75k, 3.7% for AGIs $75k-100k, 2.6% for AGIs $100k-200k, 1.7% for AGIs over 200k)
Self-employment retirement plans: $25,027 (reported on 2.4% of returns)
| 15090: | $25,027 |
| Pennsylvania: | $20,922 |
(% of AGI for various income ranges: 0.7% for AGIs $75k-100k, 0.3% for AGIs $100k-200k, 0.5% for AGIs over 200k)
Total itemized deductions: $32,281 (14% of AGI, reported on 54.6% of returns)
| Here: | $32,281 |
| State: | $23,538 |
| Here: | 14.0% of AGI |
| State: | 18.4% of AGI |
(% of AGI for various income ranges: 14.4% for AGIs below $25k, 12.6% for AGIs $25k-50k, 15.0% for AGIs $50k-75k, 15.2% for AGIs $75k-100k, 15.7% for AGIs $100k-200k, 10.7% for AGIs over 200k)
Charity contributions: $5,497 (reported on 48.9% of returns)
(% of AGI for various income ranges: 1.0% for AGIs below $25k, 1.3% for AGIs $25k-50k, 1.4% for AGIs $50k-75k, 1.6% for AGIs $75k-100k, 2.0% for AGIs $100k-200k, 2.0% for AGIs over 200k)
Taxes paid: $16,707 (reported on 54.6% of returns)
| 15090: | $16,707 |
| State: | $9,982 |
(% of AGI for various income ranges: 3.9% for AGIs below $25k, 4.3% for AGIs $25k-50k, 6.1% for AGIs $50k-75k, 6.8% for AGIs $75k-100k, 7.9% for AGIs $100k-200k, 6.1% for AGIs over 200k)
Earned income credit: $1,536 (reported on 3.6% of returns)
(% of AGI for various income ranges: 1.7% for AGIs below $25k, 0.3% for AGIs $25k-50k)
Percentage of individuals using paid preparers for their 2012 taxes: 51.1%
(% for various income ranges: 43.6% for AGIs below $25k, 47.1% for AGIs $25k-50k, 51.4% for AGIs $50k-75k, 52.9% for AGIs $75k-100k, 49.4% for AGIs $100k-200k, 68.0% for AGIs over 200k)
Averages for the 2004 tax year for zip code 15090, filed in 2005:
Average Adjusted Gross Income (AGI) in 2004: $103,927 (Individual Income Tax Returns)
| Here: | $103,927 |
| State: | $48,049 |
Salary/wage: $92,759 (reported on 82.8% of returns)
| Here: | $92,759 |
| State: | $42,646 |
(% of AGI for various income ranges: 155.8% for AGIs below $10k, 64.6% for AGIs $10k-25k, 74.2% for AGIs $25k-50k, 75.4% for AGIs $50k-75k, 79.7% for AGIs $75k-100k, 73.0% for AGIs over 100k)
Taxable interest for individuals: $2,514 (reported on 67.6% of returns)
| This zip code: | $2,514 |
| Pennsylvania: | $1,657 |
(% of AGI for various income ranges: 14.8% for AGIs below $10k, 4.5% for AGIs $10k-25k, 2.0% for AGIs $25k-50k, 2.3% for AGIs $50k-75k, 1.1% for AGIs $75k-100k, 1.5% for AGIs over 100k)
Taxable dividends: $5,584 (reported on 54.0% of returns)
(% of AGI for various income ranges: 21.4% for AGIs below $10k, 4.7% for AGIs $10k-25k, 2.6% for AGIs $25k-50k, 2.4% for AGIs $50k-75k, 1.8% for AGIs $75k-100k, 2.9% for AGIs over 100k)
Net capital gain/loss: +$13,496 (reported on 45.6% of returns)
| Here: | +$13,496 |
| State: | +$9,716 |
(% of AGI for various income ranges: -6.9% for AGIs below $10k, 1.6% for AGIs $10k-25k, 1.4% for AGIs $25k-50k, 0.5% for AGIs $50k-75k, 1.0% for AGIs $75k-100k, 7.4% for AGIs over 100k)
Profit/loss from business: +$25,812 (reported on 17.3% of returns)
| Here: | +$25,812 |
| State: | +$14,267 |
(% of AGI for various income ranges: 3.6% for AGIs below $10k, 5.5% for AGIs $10k-25k, 6.8% for AGIs $25k-50k, 4.9% for AGIs $50k-75k, 5.4% for AGIs $75k-100k, 3.9% for AGIs over 100k)
IRA payment deduction: $3,313 (reported on 4.0% of returns)
| 15090: | $3,313 |
| Pennsylvania: | $2,903 |
(% of AGI for various income ranges: 0.9% for AGIs below $10k, 0.4% for AGIs $10k-25k, 0.5% for AGIs $25k-50k, 0.2% for AGIs $50k-75k, 0.2% for AGIs $75k-100k, 0.1% for AGIs over 100k)
Self-employed pension: $18,680 (reported on 3.0% of returns)
| Here: | $18,680 |
| Pennsylvania: | $14,674 |
(% of AGI for various income ranges: 0.4% for AGIs $25k-50k, 0.3% for AGIs $50k-75k, 0.3% for AGIs $75k-100k, 0.6% for AGIs over 100k)
Total itemized deductions: $25,556 (15% of AGI, reported on 54.6% of returns)
| Here: | $25,556 |
| State: | $18,804 |
| Here: | 14.8% of AGI |
| State: | 19.5% of AGI |
(% of AGI for various income ranges: 30.3% for AGIs below $10k, 15.2% for AGIs $10k-25k, 15.6% for AGIs $25k-50k, 18.0% for AGIs $50k-75k, 19.1% for AGIs $75k-100k, 12.2% for AGIs over 100k)
Charity contributions deductions: $4,222 (2% of AGI, reported on 51.4% of returns)
| Here: | 2.4% of AGI |
| State: | 3.3% of AGI |
(% of AGI for various income ranges: 1.2% for AGIs below $10k, 1.8% for AGIs $10k-25k, 1.7% for AGIs $25k-50k, 2.2% for AGIs $50k-75k, 2.2% for AGIs $75k-100k, 2.1% for AGIs over 100k)
Total tax: $24,244 (reported on 80.5% of returns)
| 15090: | $24,244 |
| State: | $8,008 |
(% of AGI for various income ranges: 5.1% for AGIs below $10k, 4.9% for AGIs $10k-25k, 8.8% for AGIs $25k-50k, 9.2% for AGIs $50k-75k, 10.2% for AGIs $75k-100k, 21.5% for AGIs over 100k)
Earned income credit: $1,295 (reported on 3.0% of returns)
Percentage of individuals using paid preparers for their 2004 taxes: 51.3%
(% for various income ranges: 45.8% for AGIs below $10k, 48.8% for AGIs $10k-25k, 48.6% for AGIs $25k-50k, 52.6% for AGIs $50k-75k, 49.7% for AGIs $75k-100k, 57.5% for AGIs over 100k)
Estimated median household income in 2022: | This zip code: | $137,682 |
| Pennsylvania: | $71,798 |
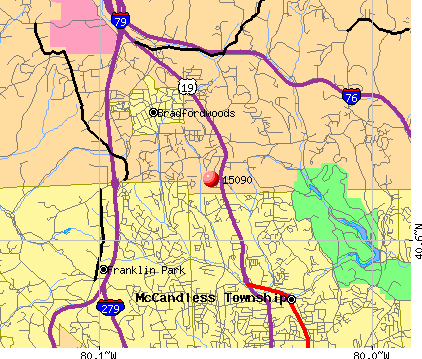
![Franklin Park, PA (15090) map]() Nearest zip codes: 15015
Nearest zip codes: 15015,
15086,
15237,
16046,
16066,
15143.
Franklin Park Zip Code Map
Percentage of family households:| This zip code: | 51.8% |
| Pennsylvania: | 42.6% |
Percentage of households with unmarried partners:| This zip code: | 5.6% |
| Pennsylvania: | 46.5% |
No gay or lesbian households reported
Household received Food Stamps/SNAP in the past 12 months: 252
Household did not receive Food Stamps/SNAP in the past 12 months: 9,190
Women who had a birth in the past 12 months: 331 (354 now married, 0 unmarried)
Women who did not have a birth in the past 12 months: 5,173 (2,550 now married, 2,605 unmarried)
Housing units in zip code 15090 with a mortgage: 5,334 (971
second mortgage, 24
home equity loan, 926
both second mortgage and home equity loan)
Houses without a mortgage: 327
Median monthly owner costs for units with a mortgage: $2,433
Median monthly owner costs for units without a mortgage: $887
Residents with income below the poverty level in 2022:
| This zip code: | 5.4% |
| Whole state: | 11.8% |
| This zip code: | 1.3% |
| Whole state: | 6.1% |
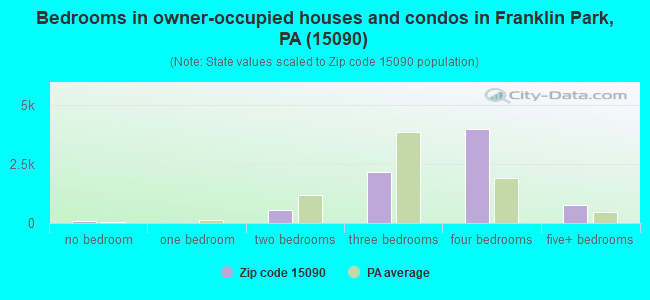
Median number of rooms in houses and condos:
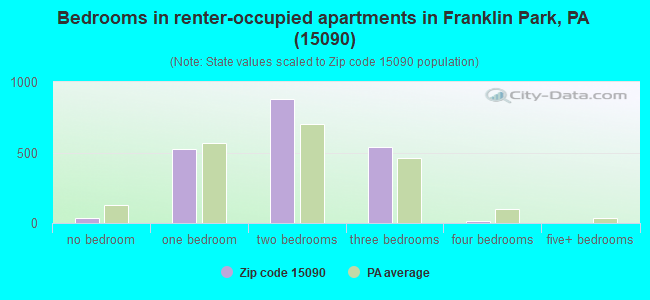
Median number of rooms in apartments:
Notable locations in this zip code not listed on our city pages
- Click to draw/clear zip code borders
Notable locations in zip code 15090: Camp O'Connell Swimming Pool (A), Braddford Woods Borough Hall (B), McCandless Township Police Department (C), Pine Township Hall (D), Spina Bifida Association of Western Pennsylvania (E), Total Learning Center (F), Bradford Woods Volunteer Fire Company Station 115 (G), Wexford Volunteer Fire Company (H). Display/hide their locations on the map
Churches in zip code 15090 include: Wexford Community Presbyterian Church (A), Pleasant Hill Church (B), Saint Alphonsus Church (C), Saint Alexis Church (D), Wexford Church (E), Orchard Hill Church (F), North Way Christian Community (G), Trinity Church (H), North Park Church (I). Display/hide their locations on the map
Reservoir: Marshall Lake (A). Display/hide its location on the map
Streams, rivers, and creeks: Wexford Run (A), Fish Run (B), Rinaman Run (C). Display/hide their locations on the map
Park in zip code 15090: State Game Lands Number 203 (1). Display/hide its location on the map


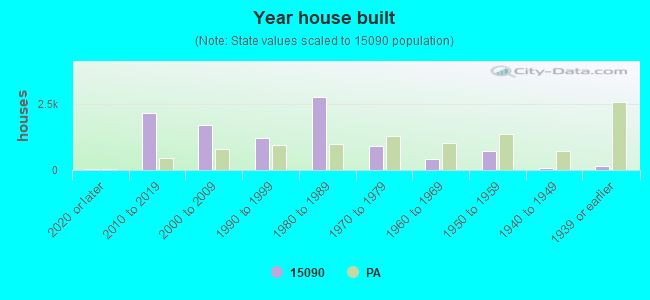
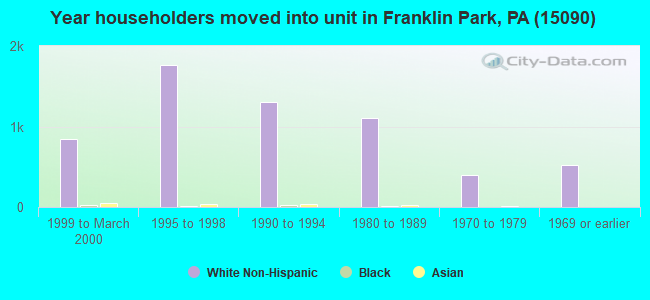
- Year house built (houses)
- 542020 or later
- 2,1622010 to 2019
- 1,6822000 to 2009
- 1,2101990 to 1999
- 2,7421980 to 1989
- 8911970 to 1979
- 4181960 to 1969
- 7181950 to 1959
- 761940 to 1949
- 1671939 or earlier
![Zip code 15090 satellite photo by USGS]()
Zip code 15090 household income distribution in 2022
![Zip code 15090 household income distribution in 2022]()
- 337Less than $10,000
- 230$10,000 to $14,999
- 97$15,000 to $19,999
- 120$20,000 to $24,999
- 141$25,000 to $29,999
- 66$30,000 to $34,999
- 170$35,000 to $39,999
- 90$40,000 to $44,999
- 75$45,000 to $49,999
- 522$50,000 to $59,999
- 616$60,000 to $74,999
- 681$75,000 to $99,999
- 1,128$100,000 to $124,999
- 790$125,000 to $149,999
- 1,366$150,000 to $199,999
- 3,066$200,000 or more
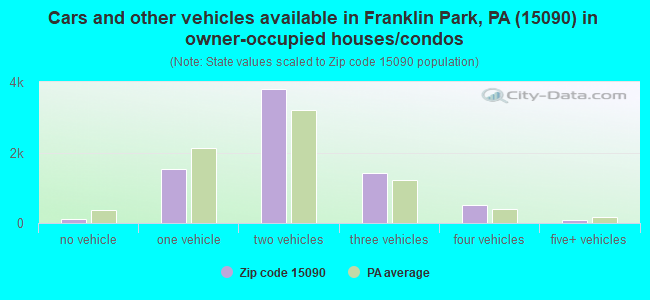
Estimate of home value of owner-occupied houses/condos in 2022 in zip code 15090
![Estimate of home value of owner-occupied houses/condos in 2022 in zip code 15090]()
- 62Less than $10,000
- 15$10,000 to $14,999
- 14$15,000 to $19,999
- 20$20,000 to $24,999
- 22$25,000 to $29,999
- 33$30,000 to $34,999
- 18$35,000 to $39,999
- 16$80,000 to $89,999
- 111$100,000 to $124,999
- 177$150,000 to $174,999
- 163$175,000 to $199,999
- 501$200,000 to $249,999
- 603$250,000 to $299,999
- 1,860$300,000 to $399,999
- 1,856$400,000 to $499,999
- 2,078$500,000 to $749,999
- 754$750,000 to $999,999
- 40$1,000,000 to $1,499,999
- 22$2,000,000 or more
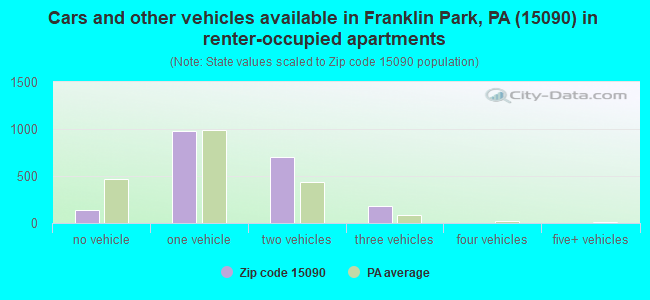
Rent paid by renters in 2022 in zip code 15090
![Rent paid by renters in 2022 in zip code 15090]()
- 2$250 to $299
- 54$300 to $349
- 22$400 to $449
- 73$450 to $499
- 9$500 to $549
- 74$800 to $899
- 172$900 to $999
- 379$1,000 to $1,249
- 241$1,250 to $1,499
- 376$1,500 to $1,999
- 377$2,000 to $2,499
- 177$2,500 to $2,999
- 9$3,000 to $3,499
- 16$3,500 or more
- 11No cash rent
Median gross rent in 2022: $1,648.
Median price asked for vacant for-sale houses and condos in 2022: $626,315.
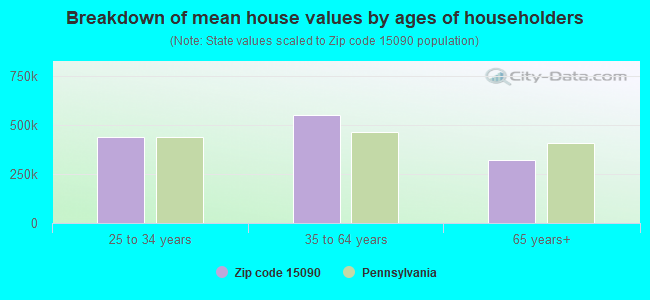
Estimated median house (or condo) value in 2022 for:
- White Non-Hispanic householders: $448,660
- Black or African American householders: $377,879
- Asian householders: $585,148
- Two or more races householders: $307,329
- Hispanic or Latino householders: $518,748
Estimated median house or condo value in 2022: $452,580
| 15090: | $452,580 |
| Pennsylvania: | $245,500 |
$335,236 - $611,918
Mean price in 2022:
Detached houses: $275,166| Here: | $275,166 |
| State: | $317,202 |
Townhouses or other attached units: $276,146| Here: | $276,146 |
| State: | $254,369 |
In 2-unit structures: $221,264| Here: | $221,264 |
| State: | $249,182 |
In 3-to-4-unit structures: $246,780| Here: | $246,780 |
| State: | $297,446 |
In 5-or-more-unit structures: $291,466| Here: | $291,466 |
| State: | $320,068 |
Mobile homes: $70,558| Here: | $70,558 |
| State: | $92,414 |
Occupied boats, RVs, vans, etc.: $2,465,078| Here: | $2,465,078 |
| State: | $563,750 |
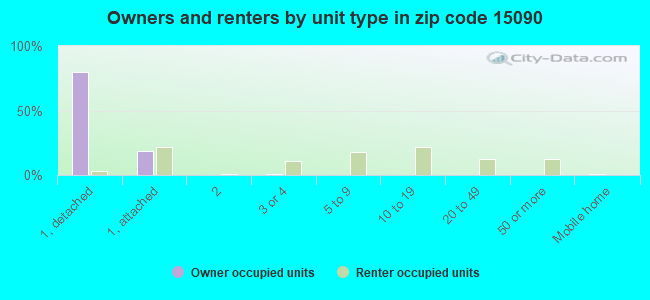
Housing units in structures:
- One, detached: 6,165
- One, attached: 1,783
- Two: 14
- 3 or 4: 368
- 5 to 9: 375
- 10 to 19: 438
- 20 to 49: 309
- 50 or more: 259
- Mobile homes: 58
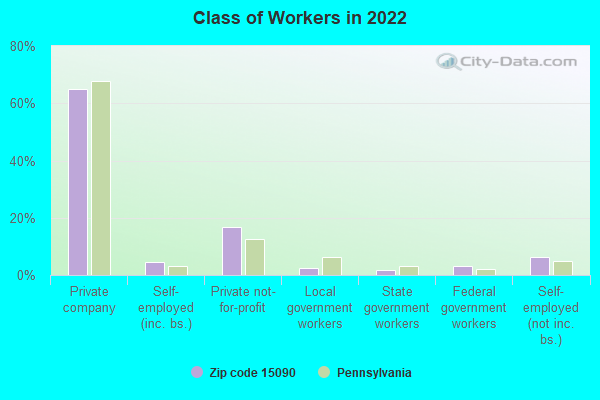
Unemployment: 1.7%
Means of transportation to work in zip code 15090
![Means of transportation to work in zip code 15090]()
- 69.7%9,076Drove a car alone
- 4.9%641Carpooled
- 1.0%128Bus or trolley bus
- 2.0%261Walked
- 2.1%268Other means
- 22.6%2,944Worked at home
Travel time to work (commute) in zip code 15090
![Travel time to work (commute) in zip code 15090]()
- 493Less than 5 minutes
- 5915 to 9 minutes
- 1,25910 to 14 minutes
- 1,06615 to 19 minutes
- 73320 to 24 minutes
- 1,08925 to 29 minutes
- 2,16530 to 34 minutes
- 40235 to 39 minutes
- 71540 to 44 minutes
- 1,11545 to 59 minutes
- 44260 to 89 minutes
- 24190 or more minutes
Percentage of zip code residents living and working in this county: 88.9%
Household type by relationship:
Households: 24,930
- Male householders: 5,405 (723 living alone), Female householders: 4,088 (1,170 living alone)
5,727 spouses (5,691 opposite-sex spouses), 595 unmarried partners, (595 opposite-sex unmarried partners), 7,528 children (7,352 natural, 54 adopted, 126 stepchildren), 9 grandchildren, 86 brothers or sisters, 344 parents, 20 foster children, 64 other relatives, 739 non-relatives
- In group quarters: 217 (-1 institutionalized population)
Size of family households: 2,650 2-persons, 1,528 3-persons, 1,698 4-persons, 622 5-persons, 170 6-persons, 17 7-or-more-persons
Size of nonfamily households: 1,892 1-person, 717 2-persons, 170 3-persons
4,995 married couples with children.
955 single-parent households (333 men, 622 women).
87.9% of residents of 15090 zip code speak English at home.
2.2% of residents speak Spanish at home (77% very well, 15% well, 8% not well).
2.9% of residents speak other Indo-European language at home (86% very well, 9% well, 4% not well).
6.3% of residents speak Asian or Pacific Island language at home (64% very well, 24% well, 7% not well, 5% not at all).
0.1% of residents speak other language at home (47% very well, 53% well).
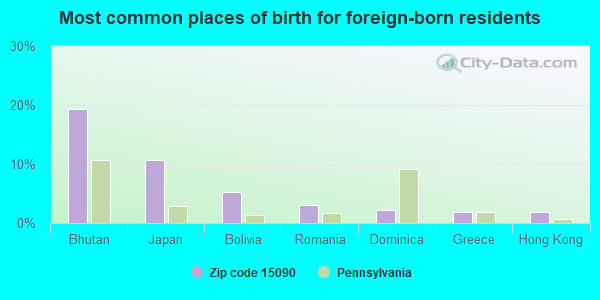
Foreign born population: 2,402 (9.6%)
(45.5%
of them are naturalized citizens)
| This zip code: | 9.6% |
| Whole state: | 7.5% |


- 19%Bhutan
- 11%Japan
- 5%Bolivia
- 3%Romania
- 2%Dominica
- 2%Greece
- 2%Hong Kong

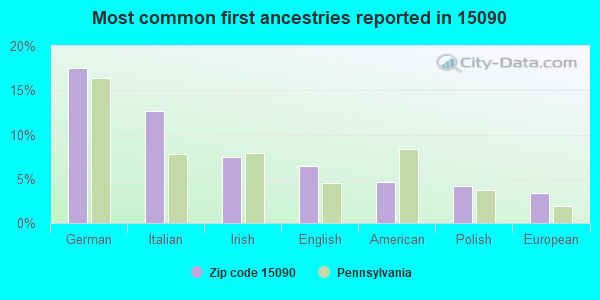
- 18%German
- 13%Italian
- 7%Irish
- 6%English
- 5%American
- 4%Polish
- 3%European

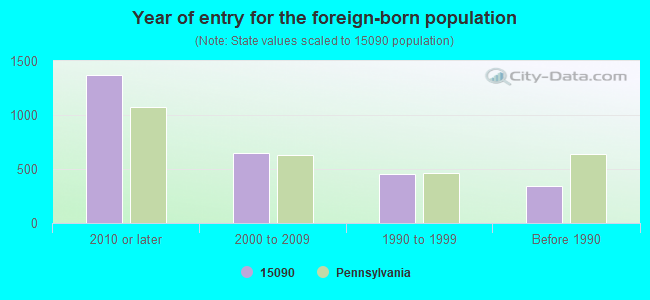
- Year of entry for the foreign-born population
- 1,3662010 or later
- 6522000 to 2009
- 4521990 to 1999
- 344Before 1990
![Zip code 15090 topographic map]()
Facilities with environmental interests located in this zip code:
- BILLCO MOTORS (ROUTE 19 in WEXFORD, PA)

STATE MASTER (Pennsylvania database) - RCRIS-PAD015104706, HAZARDOUS WASTE PROGRAM
Small Quantity Generators, between 100 kg and 1000 kg of hazardous waste/month (Resource Conservation and Recovery Act (tracking hazardous waste)) - notification
Organizations: OPERNAME (CONTACT/OPERATOR)
, SEMEL, JOE (CONTACT/OWNER)
- BAIERL ACURA (10785 PERRY HWY in WEXFORD, PA)
STATE MASTER (Pennsylvania database) - RCRIS-PAD987368727, HAZARDOUS WASTE PROGRAM
Conditionally Exempt Small Quantity Generators, less than 100 kg/month of hazardous waste (Resource Conservation and Recovery Act (tracking hazardous waste)) - notification
Organizations: BAIERL WILLIAM (CONTACT/OWNER)
- AL KOLLINGER AUTO BODY (2522 BRANDT SCHOOL ROAD in WEXFORD, PA)
Small Quantity Generators, between 100 kg and 1000 kg of hazardous waste/month (Resource Conservation and Recovery Act (tracking hazardous waste)) - notification
Organizations: OPERNAME (CONTACT/OPERATOR)
, KOLLINGER,JR ALBERT_J (CONTACT/OWNER)
- ANTHONY & KATHLEEN WEISS (128 SUNNY HILL ROAD in WEXFORD, PA)
National Pollutant Discharge Elimination System NON-MAJOR (Tracking pollutant discharge elimination systems) - permit
Business SIC classification: OPERATORS OF DWELLINGS OTHER THAN APARTMENT BUILDINGS
Alternative names: ANTHONY WEISS, WEISS, ANTHONY
- BAIERL MITSUBISHI (10430 PERRY HIGHWAY in WEXFORD, PA)
Small Quantity Generators, between 100 kg and 1000 kg of hazardous waste/month (Resource Conservation and Recovery Act (tracking hazardous waste)) - notification
Organizations: OPERNAME (CONTACT/OPERATOR)
, BAIERL WILLIAM (CONTACT/OWNER)
- BAIERL HONDA (10450 PERRY HWY in WEXFORD, PA)
Small Quantity Generators, between 100 kg and 1000 kg of hazardous waste/month (Resource Conservation and Recovery Act (tracking hazardous waste)) - notification
Organizations: BAIERL WILLIAM R (CONTACT/OWNER)
- BAIERL MITSUBISHI (10470 PERRY HWY in WEXFORD, PA)
Small Quantity Generators, between 100 kg and 1000 kg of hazardous waste/month (Resource Conservation and Recovery Act (tracking hazardous waste)) - notification
Organizations: BAIERL WILLIAM R (CONTACT/OWNER)
![Zip code 15090 marital status for males]()
![Zip code 15090 marital status for females]()
Housing units lacking complete plumbing facilities: 0.4%
Housing units lacking complete kitchen facilities: 0.4%

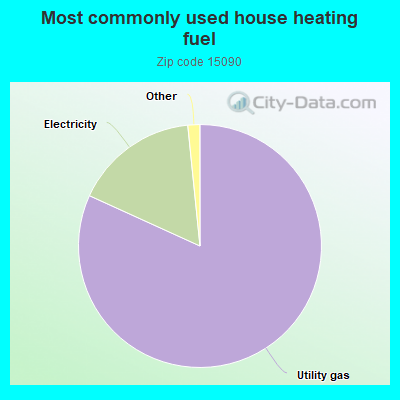
- 81.8%Utility gas
- 16.6%Electricity
- 0.6%No fuel used
- 0.6%Bottled, tank, or LP gas
Population in 1990: 14,960. Population change in the 1990s: +3,292 (+22.0%).
Place of birth for U.S.-born residents:
- This state: 15,279
- Northeast: 1,361
- Midwest: 2,051
- South: 2,374
- West: 1,253
62% of the 15090 zip code residents lived in the same house 5 years ago.
Out of people who lived in different houses, 60% lived in this county.
Out of people who lived in different counties, 50% lived in Pennsylvania.
90% of the 15090 zip code residents lived in the same house 1 year ago.
Out of people who lived in different houses, 48% moved from this county.
Out of people who lived in different houses, 8% moved from different county within same state.
Out of people who lived in different houses, 39% moved from different state.
Out of people who lived in different houses, 6% moved from abroad.
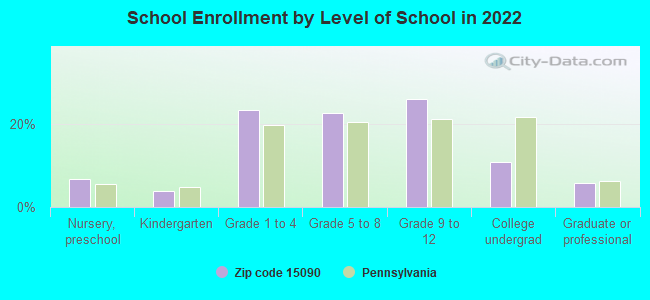
Private vs. public school enrollment:
Students in private schools in grades 1 to 8 (elementary and middle school): 221
| Here: | 7.7% |
| Pennsylvania: | 15.7% |
208
| Here: | 12.7% |
| Pennsylvania: | 13.4% |
211
| Here: | 31.0% |
| Pennsylvania: | 39.8% |

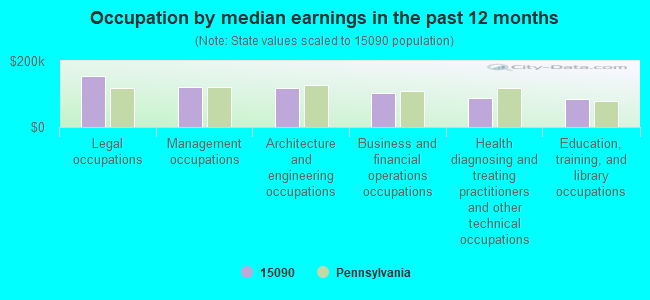
- Occupation by median earnings in the past 12 months ($)
- 155,796Legal occupations
- 119,810Management occupations
- 117,710Architecture and engineering occupations
- 104,131Business and financial operations occupations
- 87,916Health diagnosing and treating practitioners and other technical occupations
- 85,677Education, training, and library occupations
Companies with federal contracts located in this zip code (WEXFORD, PA):
- ACCIPITER SYSTEMS INC (412 FOX MEADOW DR; small business) : $347,900 in 2 contracts from 2004 to 2005
$248,000 with Department of Defense for Other Defense -- Applied Research and Exploratory Development (R&D). Signed on 2004-12-01. Completion date: 2005-06-30.
$99,900 with Department of Defense for Other Defense -- Advanced Development (R&D). Signed on 2005-07-29. Completion date: 2005-10-28.
- KAIR INC (2629 FOUNTAIN HILLS DR; small business) : $312,987 in 4 contracts from 2000 to 2005
$223,000 with Alcohol and Tobacco Tax and Trade Bureau for Clothing, Special Purpose. Taking place in VA. Signed on 2000-09-15. Completion date: 2000-11-15.
$65,852 with Navy for Hazard-Detecting Instruments and Apparatus. Signed on 2003-07-29. Completion date: 2003-09-01.
$12,746 with Navy for Non-nuclear Ship Repair (East) Ship repair (including overhauls and conversions) performed on non-nuclear propelled and nonpropelled ships east of the 108th meridian. Taking place in VA. Signed on 2005-08-29. Completion date: 2005-09-08.
$11,389 with Navy for Hand Tools, Power Driven. Signed on 2005-08-30. Completion date: 2005-10-17.
- STEEL RELATED INDUSTRIES QUALI (105 BRADFORD ROAD; small business) : $135,005 in 40 contracts from 2002 to 2006
Contracts for Auditing Services, Certifications and Accreditations for products and institutions other than educational institutions, Other Professional Services, Program Evaluation Services, and more by Army, U.S. Army Corps of Engineers - civil program financing only, Animal and Plant Health Inspection Service
Signed by year: 2000: $0; 2001: $0; 2002: $7,086; 2003: $31,255; 2004: $14,006; 2005: $70,578; 2006: $12,080.
Biggest contracts:
$17,050 with Army for Auditing Services. Taking place in MO. Signed on 2005-02-09. Completion date: 2007-09-30.
$17,050 with U.S. Army Corps of Engineers - civil program financing only for Auditing Services. Taking place in MO. Signed on 2005-02-09. Completion date: 2007-09-30.
$12,930 with Army for Certifications and Accreditations for products and institutions other than educational institutions. Signed on 2003-04-14. Completion date: 2003-04-16.
$8,450 with Army for Other Professional Services. Taking place in CA. Signed on 2005-07-05. Completion date: 2005-10-07.
- THE COMMAND GROUP INC (257 SEASONS DR, STE 101; small business)
$100,575 with Army for Maintenance, Repair and Rebuilding of Equipment -- Communication, Detection, and Coherent Radiation Equipment. Signed on 2002-09-30. Completion date: 2002-10-30.
- NTS ENVIRONMENTAL, INC (349 CLOVERDALE DRIVE; small business)
$39,850 with Army for Other Environmental Services, Studies, and Analytical Support. Signed on 2002-06-26. Completion date: 2002-09-30.
- PITTSBURGH BOLT AND SUPPLY CO (114 VIP DR; small business)
$9,775 with Army for Bolts. Signed on 2004-07-19. Completion date: 2004-07-26.
Top industries in this zip code by the number of employees in 2005:
- Wholesale Trade: Drugs and Druggists' Sundries Merchant Wholesalers (500-999 employees: 1 establishment)
- Administrative and Support and Waste Management and Remediation Services: Temporary Help Services (100-249: 3, 50-99: 2, 20-49: 2, 5-9: 2, 1-4: 4)
- Accommodation and Food Services: Full-Service Restaurants (100-249: 1, 50-99: 2, 20-49: 4, 10-19: 1, 1-4: 2)
- Health Care and Social Assistance: Offices of Physicians (except Mental Health Specialists) (20-49: 6, 10-19: 8, 5-9: 9, 1-4: 10)
- Health Care and Social Assistance: Nursing Care Facilities (100-249: 2, 50-99: 1)
- Accommodation and Food Services: Limited-Service Restaurants (50-99: 2, 20-49: 5, 10-19: 2, 5-9: 2, 1-4: 4)
- Other Services (except Public Administration): Religious Organizations (100-249: 1, 20-49: 3, 10-19: 1, 5-9: 3, 1-4: 2)
- Other Services (except Public Administration): Beauty Salons (50-99: 1, 20-49: 4, 10-19: 2, 5-9: 6, 1-4: 7)
- Finance and Insurance: Direct Property and Casualty Insurance Carriers (100-249: 1, 10-19: 2, 5-9: 2, 1-4: 2)
People in group quarters in 2010:
- 180 people in nursing facilities/skilled-nursing facilities
- 11 people in group homes intended for adults
People in group quarters in 2000:
- 196 people in nursing homes
- 45 people in other noninstitutional group quarters
- 16 people in schools, hospitals, or wards for the intellectually disabled
- 14 people in orthopedic wards and institutions for the physically handicapped
- 2 people in religious group quarters
Fatal accident statistics in 2013:
- Fatal accident count: 2
- Vehicles involved in fatal accidents: 3
- Fatal accidents caused by drunken drivers: 0
- Fatalities: 2
- Persons involved in fatal accidents: 4
- Pedestrians involved in fatal accidents: 0
Fatal accident statistics in 2012:
- Fatal accident count: 1
- Vehicles involved in fatal accidents: 2
- Fatal accidents caused by drunken drivers: 1
- Fatalities: 1
- Persons involved in fatal accidents: 2
- Pedestrians involved in fatal accidents: 0
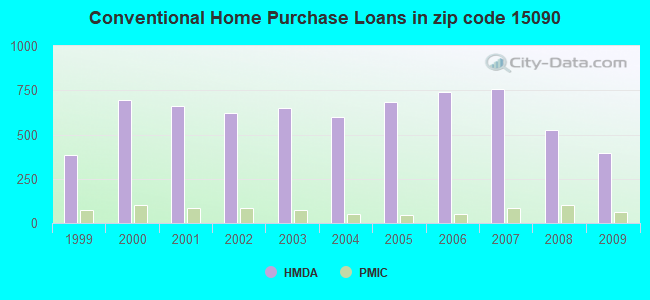
Home Mortgage Disclosure Act Aggregated Statistics For Year 2009
(Based on 1 full and 8 partial tracts)
|
| A) FHA, FSA/RHS & VA
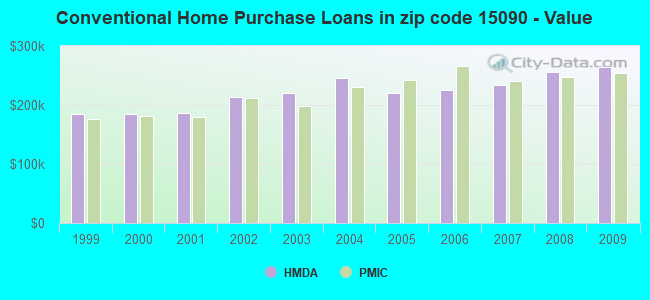
Home Purchase Loans | B) Conventional
Home Purchase Loans | C) Refinancings
| D) Home Improvement Loans
| E) Loans on Dwellings For 5+ Families
| F) Non-occupant Loans on
< 5 Family Dwellings (A B C & D) | G) Loans On Manufactured
Home Dwelling (A B C & D) |
|---|
| Number | Average Value | Number | Average Value | Number | Average Value | Number | Average Value | Number | Average Value | Number | Average Value | Number | Average Value |
|---|
| LOANS ORIGINATED | 79 | $216,539 | 394 | $264,372 | 1,199 | $246,123 | 79 | $118,292 | 2 | $3,731,015 | 25 | $179,953 | 1 | $301,500 |
| APPLICATIONS APPROVED, NOT ACCEPTED | 4 | $127,380 | 25 | $250,284 | 94 | $232,310 | 4 | $126,812 | 0 | $0 | 1 | $91,150 | 0 | $0 |
| APPLICATIONS DENIED | 4 | $207,130 | 19 | $260,722 | 214 | $276,932 | 16 | $60,957 | 0 | $0 | 6 | $211,050 | 1 | $182,780 |
| APPLICATIONS WITHDRAWN | 11 | $202,666 | 38 | $263,493 | 181 | $253,170 | 7 | $143,989 | 0 | $0 | 0 | $0 | 0 | $0 |
| FILES CLOSED FOR INCOMPLETENESS | 0 | $0 | 2 | $194,855 | 37 | $265,376 | 1 | $12,660 | 0 | $0 | 0 | $0 | 0 | $0 |
Aggregated Statistics For Year 2008
(Based on 1 full and 8 partial tracts)
|
| A) FHA, FSA/RHS & VA
Home Purchase Loans | B) Conventional
Home Purchase Loans | C) Refinancings
| D) Home Improvement Loans
| E) Loans on Dwellings For 5+ Families
| F) Non-occupant Loans on
< 5 Family Dwellings (A B C & D) | G) Loans On Manufactured
Home Dwelling (A B C & D) |
|---|
| Number | Average Value | Number | Average Value | Number | Average Value | Number | Average Value | Number | Average Value | Number | Average Value | Number | Average Value |
|---|
| LOANS ORIGINATED | 38 | $222,100 | 527 | $255,855 | 416 | $237,413 | 86 | $68,548 | 2 | $16,258,590 | 44 | $205,883 | 0 | $0 |
| APPLICATIONS APPROVED, NOT ACCEPTED | 1 | $145,820 | 23 | $311,229 | 49 | $218,248 | 11 | $67,583 | 0 | $0 | 1 | $288,300 | 0 | $0 |
| APPLICATIONS DENIED | 6 | $191,375 | 38 | $246,292 | 152 | $265,566 | 46 | $110,768 | 1 | $12,560 | 6 | $298,445 | 1 | $40,190 |
| APPLICATIONS WITHDRAWN | 3 | $201,400 | 37 | $339,407 | 83 | $220,886 | 11 | $130,690 | 0 | $0 | 1 | $136,880 | 0 | $0 |
| FILES CLOSED FOR INCOMPLETENESS | 0 | $0 | 2 | $174,190 | 14 | $227,959 | 1 | $168,650 | 0 | $0 | 1 | $232,320 | 0 | $0 |
Aggregated Statistics For Year 2007
(Based on 1 full and 8 partial tracts)
|
| A) FHA, FSA/RHS & VA
Home Purchase Loans | B) Conventional
Home Purchase Loans | C) Refinancings
| D) Home Improvement Loans
| E) Loans on Dwellings For 5+ Families
| F) Non-occupant Loans on
< 5 Family Dwellings (A B C & D) | G) Loans On Manufactured
Home Dwelling (A B C & D) |
|---|
| Number | Average Value | Number | Average Value | Number | Average Value | Number | Average Value | Number | Average Value | Number | Average Value | Number | Average Value |
|---|
| LOANS ORIGINATED | 16 | $183,821 | 756 | $233,946 | 333 | $185,085 | 121 | $68,811 | 2 | $16,379,315 | 35 | $188,980 | 0 | $0 |
| APPLICATIONS APPROVED, NOT ACCEPTED | 0 | $0 | 76 | $219,877 | 74 | $157,229 | 16 | $59,234 | 1 | $122,490 | 3 | $251,363 | 0 | $0 |
| APPLICATIONS DENIED | 0 | $0 | 71 | $203,688 | 206 | $215,972 | 41 | $73,991 | 0 | $0 | 5 | $243,798 | 2 | $15,525 |
| APPLICATIONS WITHDRAWN | 0 | $0 | 63 | $242,179 | 65 | $221,600 | 11 | $59,796 | 1 | $829,140 | 3 | $229,143 | 0 | $0 |
| FILES CLOSED FOR INCOMPLETENESS | 0 | $0 | 15 | $171,699 | 14 | $280,704 | 3 | $70,150 | 0 | $0 | 1 | $211,170 | 0 | $0 |
Aggregated Statistics For Year 2006
(Based on 1 full and 8 partial tracts)
|
| A) FHA, FSA/RHS & VA
Home Purchase Loans | B) Conventional
Home Purchase Loans | C) Refinancings
| D) Home Improvement Loans
| E) Loans on Dwellings For 5+ Families
| F) Non-occupant Loans on
< 5 Family Dwellings (A B C & D) |
|---|
| Number | Average Value | Number | Average Value | Number | Average Value | Number | Average Value | Number | Average Value | Number | Average Value |
|---|
| LOANS ORIGINATED | 11 | $150,595 | 739 | $224,818 | 430 | $164,181 | 114 | $48,947 | 0 | $0 | 47 | $189,811 |
| APPLICATIONS APPROVED, NOT ACCEPTED | 0 | $0 | 68 | $199,505 | 107 | $178,556 | 11 | $52,964 | 0 | $0 | 6 | $114,190 |
| APPLICATIONS DENIED | 0 | $0 | 44 | $217,754 | 198 | $194,728 | 54 | $69,175 | 1 | $164,890 | 13 | $116,393 |
| APPLICATIONS WITHDRAWN | 2 | $173,445 | 52 | $228,085 | 97 | $199,501 | 7 | $70,244 | 0 | $0 | 3 | $123,313 |
| FILES CLOSED FOR INCOMPLETENESS | 0 | $0 | 9 | $208,732 | 21 | $264,241 | 2 | $42,595 | 0 | $0 | 2 | $439,470 |
Aggregated Statistics For Year 2005
(Based on 1 full and 8 partial tracts)
|
| A) FHA, FSA/RHS & VA
Home Purchase Loans | B) Conventional
Home Purchase Loans | C) Refinancings
| D) Home Improvement Loans
| F) Non-occupant Loans on
< 5 Family Dwellings (A B C & D) | G) Loans On Manufactured
Home Dwelling (A B C & D) |
|---|
| Number | Average Value | Number | Average Value | Number | Average Value | Number | Average Value | Number | Average Value | Number | Average Value |
|---|
| LOANS ORIGINATED | 6 | $198,383 | 681 | $220,017 | 484 | $183,548 | 123 | $67,657 | 41 | $104,670 | 4 | $39,852 |
| APPLICATIONS APPROVED, NOT ACCEPTED | 0 | $0 | 48 | $188,335 | 88 | $173,430 | 6 | $53,923 | 2 | $33,495 | 0 | $0 |
| APPLICATIONS DENIED | 0 | $0 | 35 | $143,364 | 203 | $189,449 | 35 | $81,211 | 8 | $37,838 | 2 | $39,660 |
| APPLICATIONS WITHDRAWN | 1 | $238,860 | 57 | $237,911 | 154 | $222,964 | 18 | $187,192 | 5 | $237,064 | 0 | $0 |
| FILES CLOSED FOR INCOMPLETENESS | 0 | $0 | 15 | $135,151 | 36 | $222,066 | 4 | $73,560 | 1 | $131,860 | 0 | $0 |
Aggregated Statistics For Year 2004
(Based on 1 full and 8 partial tracts)
|
| A) FHA, FSA/RHS & VA
Home Purchase Loans | B) Conventional
Home Purchase Loans | C) Refinancings
| D) Home Improvement Loans
| E) Loans on Dwellings For 5+ Families
| F) Non-occupant Loans on
< 5 Family Dwellings (A B C & D) | G) Loans On Manufactured
Home Dwelling (A B C & D) |
|---|
| Number | Average Value | Number | Average Value | Number | Average Value | Number | Average Value | Number | Average Value | Number | Average Value | Number | Average Value |
|---|
| LOANS ORIGINATED | 6 | $154,653 | 597 | $245,161 | 765 | $189,025 | 105 | $60,727 | 1 | $26,717,900 | 18 | $118,708 | 0 | $0 |
| APPLICATIONS APPROVED, NOT ACCEPTED | 0 | $0 | 67 | $220,759 | 109 | $186,431 | 22 | $39,848 | 0 | $0 | 7 | $127,674 | 0 | $0 |
| APPLICATIONS DENIED | 3 | $112,183 | 34 | $235,294 | 214 | $191,396 | 43 | $51,096 | 0 | $0 | 11 | $74,306 | 1 | $5,060 |
| APPLICATIONS WITHDRAWN | 0 | $0 | 56 | $209,336 | 139 | $188,698 | 11 | $71,504 | 0 | $0 | 4 | $119,920 | 3 | $104,257 |
| FILES CLOSED FOR INCOMPLETENESS | 0 | $0 | 8 | $266,236 | 106 | $206,998 | 5 | $174,818 | 0 | $0 | 1 | $133,840 | 0 | $0 |
Aggregated Statistics For Year 2003
(Based on 1 full and 8 partial tracts)
|
| A) FHA, FSA/RHS & VA
Home Purchase Loans | B) Conventional
Home Purchase Loans | C) Refinancings
| D) Home Improvement Loans
| E) Loans on Dwellings For 5+ Families
| F) Non-occupant Loans on
< 5 Family Dwellings (A B C & D) |
|---|
| Number | Average Value | Number | Average Value | Number | Average Value | Number | Average Value | Number | Average Value | Number | Average Value |
|---|
| LOANS ORIGINATED | 12 | $159,226 | 649 | $221,156 | 2,532 | $185,669 | 100 | $59,844 | 3 | $554,057 | 28 | $142,488 |
| APPLICATIONS APPROVED, NOT ACCEPTED | 0 | $0 | 41 | $205,886 | 278 | $172,202 | 39 | $64,133 | 0 | $0 | 3 | $96,963 |
| APPLICATIONS DENIED | 1 | $217,680 | 25 | $179,591 | 302 | $184,086 | 27 | $64,151 | 0 | $0 | 7 | $136,836 |
| APPLICATIONS WITHDRAWN | 3 | $129,773 | 41 | $180,680 | 195 | $212,150 | 9 | $33,297 | 0 | $0 | 5 | $167,428 |
| FILES CLOSED FOR INCOMPLETENESS | 0 | $0 | 17 | $210,197 | 77 | $200,266 | 9 | $82,708 | 0 | $0 | 0 | $0 |
Aggregated Statistics For Year 2002
(Based on 1 full and 8 partial tracts)
|
| A) FHA, FSA/RHS & VA
Home Purchase Loans | B) Conventional
Home Purchase Loans | C) Refinancings
| D) Home Improvement Loans
| F) Non-occupant Loans on
< 5 Family Dwellings (A B C & D) |
|---|
| Number | Average Value | Number | Average Value | Number | Average Value | Number | Average Value | Number | Average Value |
|---|
| LOANS ORIGINATED | 8 | $150,159 | 621 | $214,092 | 1,643 | $184,917 | 98 | $50,805 | 18 | $113,988 |
| APPLICATIONS APPROVED, NOT ACCEPTED | 0 | $0 | 42 | $218,331 | 232 | $168,487 | 21 | $59,140 | 1 | $89,890 |
| APPLICATIONS DENIED | 0 | $0 | 35 | $237,451 | 212 | $200,898 | 42 | $65,514 | 3 | $139,260 |
| APPLICATIONS WITHDRAWN | 0 | $0 | 49 | $191,958 | 173 | $186,377 | 11 | $68,328 | 4 | $112,782 |
| FILES CLOSED FOR INCOMPLETENESS | 0 | $0 | 10 | $201,431 | 95 | $214,985 | 3 | $10,723 | 2 | $107,765 |
Aggregated Statistics For Year 2001
(Based on 1 full and 8 partial tracts)
|
| A) FHA, FSA/RHS & VA
Home Purchase Loans | B) Conventional
Home Purchase Loans | C) Refinancings
| D) Home Improvement Loans
| F) Non-occupant Loans on
< 5 Family Dwellings (A B C & D) |
|---|
| Number | Average Value | Number | Average Value | Number | Average Value | Number | Average Value | Number | Average Value |
|---|
| LOANS ORIGINATED | 11 | $109,522 | 663 | $186,461 | 974 | $161,050 | 146 | $37,316 | 14 | $143,086 |
| APPLICATIONS APPROVED, NOT ACCEPTED | 0 | $0 | 26 | $162,055 | 142 | $126,253 | 33 | $47,886 | 2 | $100,695 |
| APPLICATIONS DENIED | 2 | $113,185 | 41 | $153,968 | 242 | $140,779 | 39 | $31,396 | 1 | $11,310 |
| APPLICATIONS WITHDRAWN | 0 | $0 | 30 | $192,466 | 187 | $175,270 | 25 | $37,365 | 4 | $146,525 |
| FILES CLOSED FOR INCOMPLETENESS | 0 | $0 | 8 | $262,351 | 36 | $186,784 | 0 | $0 | 0 | $0 |
Aggregated Statistics For Year 2000
(Based on 1 full and 8 partial tracts)
|
| A) FHA, FSA/RHS & VA
Home Purchase Loans | B) Conventional
Home Purchase Loans | C) Refinancings
| D) Home Improvement Loans
| F) Non-occupant Loans on
< 5 Family Dwellings (A B C & D) |
|---|
| Number | Average Value | Number | Average Value | Number | Average Value | Number | Average Value | Number | Average Value |
|---|
| LOANS ORIGINATED | 11 | $103,830 | 697 | $184,910 | 254 | $109,377 | 100 | $37,812 | 13 | $174,886 |
| APPLICATIONS APPROVED, NOT ACCEPTED | 2 | $91,455 | 40 | $164,752 | 62 | $99,531 | 26 | $41,570 | 4 | $103,930 |
| APPLICATIONS DENIED | 1 | $77,260 | 47 | $179,277 | 91 | $127,593 | 21 | $36,840 | 6 | $258,003 |
| APPLICATIONS WITHDRAWN | 0 | $0 | 29 | $156,058 | 35 | $116,305 | 7 | $36,886 | 1 | $457,450 |
| FILES CLOSED FOR INCOMPLETENESS | 0 | $0 | 11 | $123,297 | 24 | $175,193 | 3 | $26,697 | 2 | $269,955 |
Aggregated Statistics For Year 1999
(Based on 1 full and 4 partial tracts)
|
| A) FHA, FSA/RHS & VA
Home Purchase Loans | B) Conventional
Home Purchase Loans | C) Refinancings
| D) Home Improvement Loans
| E) Loans on Dwellings For 5+ Families
| F) Non-occupant Loans on
< 5 Family Dwellings (A B C & D) |
|---|
| Number | Average Value | Number | Average Value | Number | Average Value | Number | Average Value | Number | Average Value | Number | Average Value |
|---|
| LOANS ORIGINATED | 8 | $114,484 | 386 | $184,129 | 273 | $139,586 | 52 | $31,846 | 1 | $816,490 | 22 | $159,374 |
| APPLICATIONS APPROVED, NOT ACCEPTED | 1 | $113,680 | 18 | $169,832 | 59 | $136,191 | 10 | $38,366 | 0 | $0 | 2 | $184,765 |
| APPLICATIONS DENIED | 1 | $99,070 | 15 | $160,611 | 86 | $113,341 | 13 | $23,941 | 2 | $465,855 | 3 | $229,553 |
| APPLICATIONS WITHDRAWN | 1 | $77,500 | 19 | $178,764 | 55 | $129,507 | 10 | $77,205 | 0 | $0 | 1 | $401,250 |
| FILES CLOSED FOR INCOMPLETENESS | 0 | $0 | 4 | $194,935 | 14 | $152,874 | 1 | $49,300 | 0 | $0 | 0 | $0 |
Private Mortgage Insurance Companies Aggregated Statistics For Year 2009
(Based on 1 full and 8 partial tracts)
|
| A) Conventional
Home Purchase Loans | B) Refinancings
|
|---|
| Number | Average Value | Number | Average Value |
|---|
| LOANS ORIGINATED | 63 | $255,060 | 26 | $268,877 |
| APPLICATIONS APPROVED, NOT ACCEPTED | 23 | $242,633 | 10 | $318,704 |
| APPLICATIONS DENIED | 5 | $278,186 | 2 | $246,995 |
| APPLICATIONS WITHDRAWN | 3 | $181,360 | 2 | $398,485 |
| FILES CLOSED FOR INCOMPLETENESS | 0 | $0 | 1 | $255,690 |
Aggregated Statistics For Year 2008
(Based on 1 full and 8 partial tracts)
|
| A) Conventional
Home Purchase Loans | B) Refinancings
| C) Non-occupant Loans on
< 5 Family Dwellings (A & B) |
|---|
| Number | Average Value | Number | Average Value | Number | Average Value |
|---|
| LOANS ORIGINATED | 101 | $247,558 | 30 | $267,326 | 3 | $164,637 |
| APPLICATIONS APPROVED, NOT ACCEPTED | 19 | $284,342 | 9 | $281,320 | 1 | $203,520 |
| APPLICATIONS DENIED | 5 | $214,706 | 2 | $307,760 | 0 | $0 |
| APPLICATIONS WITHDRAWN | 1 | $248,740 | 1 | $318,020 | 0 | $0 |
| FILES CLOSED FOR INCOMPLETENESS | 0 | $0 | 0 | $0 | 0 | $0 |
Aggregated Statistics For Year 2007
(Based on 1 full and 8 partial tracts)
|
| A) Conventional
Home Purchase Loans | B) Refinancings
| C) Non-occupant Loans on
< 5 Family Dwellings (A & B) |
|---|
| Number | Average Value | Number | Average Value | Number | Average Value |
|---|
| LOANS ORIGINATED | 84 | $240,449 | 24 | $257,680 | 4 | $138,388 |
| APPLICATIONS APPROVED, NOT ACCEPTED | 14 | $275,319 | 4 | $280,600 | 0 | $0 |
| APPLICATIONS DENIED | 2 | $254,410 | 0 | $0 | 0 | $0 |
| APPLICATIONS WITHDRAWN | 4 | $272,218 | 2 | $104,865 | 0 | $0 |
| FILES CLOSED FOR INCOMPLETENESS | 0 | $0 | 1 | $248,650 | 0 | $0 |
Aggregated Statistics For Year 2006
(Based on 1 full and 8 partial tracts)
|
| A) Conventional
Home Purchase Loans | B) Refinancings
| C) Non-occupant Loans on
< 5 Family Dwellings (A & B) |
|---|
| Number | Average Value | Number | Average Value | Number | Average Value |
|---|
| LOANS ORIGINATED | 51 | $265,704 | 13 | $243,482 | 1 | $296,790 |
| APPLICATIONS APPROVED, NOT ACCEPTED | 14 | $252,744 | 8 | $330,072 | 2 | $312,125 |
| APPLICATIONS DENIED | 2 | $207,590 | 0 | $0 | 0 | $0 |
| APPLICATIONS WITHDRAWN | 1 | $649,960 | 0 | $0 | 0 | $0 |
| FILES CLOSED FOR INCOMPLETENESS | 0 | $0 | 1 | $315,000 | 0 | $0 |
Aggregated Statistics For Year 2005
(Based on 1 full and 8 partial tracts)
|
| A) Conventional
Home Purchase Loans | B) Refinancings
| C) Non-occupant Loans on
< 5 Family Dwellings (A & B) |
|---|
| Number | Average Value | Number | Average Value | Number | Average Value |
|---|
| LOANS ORIGINATED | 45 | $242,043 | 24 | $269,333 | 1 | $184,670 |
| APPLICATIONS APPROVED, NOT ACCEPTED | 11 | $237,519 | 7 | $199,937 | 0 | $0 |
| APPLICATIONS DENIED | 0 | $0 | 0 | $0 | 0 | $0 |
| APPLICATIONS WITHDRAWN | 1 | $90,140 | 2 | $226,730 | 0 | $0 |
| FILES CLOSED FOR INCOMPLETENESS | 0 | $0 | 0 | $0 | 0 | $0 |
Aggregated Statistics For Year 2004
(Based on 1 full and 8 partial tracts)
|
| A) Conventional
Home Purchase Loans | B) Refinancings
| C) Non-occupant Loans on
< 5 Family Dwellings (A & B) |
|---|
| Number | Average Value | Number | Average Value | Number | Average Value |
|---|
| LOANS ORIGINATED | 51 | $230,873 | 32 | $212,723 | 2 | $76,415 |
| APPLICATIONS APPROVED, NOT ACCEPTED | 19 | $304,710 | 10 | $203,576 | 0 | $0 |
| APPLICATIONS DENIED | 3 | $359,867 | 1 | $764,080 | 0 | $0 |
| APPLICATIONS WITHDRAWN | 6 | $227,682 | 1 | $73,930 | 3 | $288,363 |
| FILES CLOSED FOR INCOMPLETENESS | 1 | $629,000 | 0 | $0 | 0 | $0 |
Aggregated Statistics For Year 2003
(Based on 1 full and 8 partial tracts)
|
| A) Conventional
Home Purchase Loans | B) Refinancings
| C) Non-occupant Loans on
< 5 Family Dwellings (A & B) |
|---|
| Number | Average Value | Number | Average Value | Number | Average Value |
|---|
| LOANS ORIGINATED | 75 | $197,861 | 78 | $189,104 | 5 | $127,206 |
| APPLICATIONS APPROVED, NOT ACCEPTED | 17 | $200,170 | 25 | $228,504 | 2 | $105,635 |
| APPLICATIONS DENIED | 0 | $0 | 0 | $0 | 0 | $0 |
| APPLICATIONS WITHDRAWN | 3 | $364,623 | 9 | $228,884 | 0 | $0 |
| FILES CLOSED FOR INCOMPLETENESS | 2 | $160,635 | 1 | $385,210 | 0 | $0 |
Aggregated Statistics For Year 2002
(Based on 1 full and 8 partial tracts)
|
| A) Conventional
Home Purchase Loans | B) Refinancings
| C) Non-occupant Loans on
< 5 Family Dwellings (A & B) |
|---|
| Number | Average Value | Number | Average Value | Number | Average Value |
|---|
| LOANS ORIGINATED | 87 | $211,989 | 44 | $194,186 | 3 | $95,860 |
| APPLICATIONS APPROVED, NOT ACCEPTED | 12 | $187,762 | 11 | $221,311 | 0 | $0 |
| APPLICATIONS DENIED | 1 | $155,460 | 0 | $0 | 0 | $0 |
| APPLICATIONS WITHDRAWN | 5 | $233,914 | 5 | $202,426 | 1 | $99,690 |
| FILES CLOSED FOR INCOMPLETENESS | 0 | $0 | 0 | $0 | 0 | $0 |
Aggregated Statistics For Year 2001
(Based on 1 full and 8 partial tracts)
|
| A) Conventional
Home Purchase Loans | B) Refinancings
| C) Non-occupant Loans on
< 5 Family Dwellings (A & B) |
|---|
| Number | Average Value | Number | Average Value | Number | Average Value |
|---|
| LOANS ORIGINATED | 83 | $179,716 | 41 | $185,208 | 1 | $104,230 |
| APPLICATIONS APPROVED, NOT ACCEPTED | 8 | $163,954 | 5 | $165,864 | 0 | $0 |
| APPLICATIONS DENIED | 1 | $268,680 | 0 | $0 | 0 | $0 |
| APPLICATIONS WITHDRAWN | 3 | $161,033 | 1 | $224,730 | 0 | $0 |
| FILES CLOSED FOR INCOMPLETENESS | 0 | $0 | 0 | $0 | 0 | $0 |
Aggregated Statistics For Year 2000
(Based on 1 full and 8 partial tracts)
|
| A) Conventional
Home Purchase Loans | B) Refinancings
| C) Non-occupant Loans on
< 5 Family Dwellings (A & B) |
|---|
| Number | Average Value | Number | Average Value | Number | Average Value |
|---|
| LOANS ORIGINATED | 104 | $181,700 | 9 | $181,739 | 3 | $111,167 |
| APPLICATIONS APPROVED, NOT ACCEPTED | 10 | $170,690 | 4 | $182,430 | 0 | $0 |
| APPLICATIONS DENIED | 3 | $127,297 | 1 | $81,970 | 0 | $0 |
| APPLICATIONS WITHDRAWN | 2 | $188,920 | 0 | $0 | 0 | $0 |
| FILES CLOSED FOR INCOMPLETENESS | 0 | $0 | 0 | $0 | 0 | $0 |
Aggregated Statistics For Year 1999
(Based on 1 full and 4 partial tracts)
|
| A) Conventional
Home Purchase Loans | B) Refinancings
| C) Non-occupant Loans on
< 5 Family Dwellings (A & B) |
|---|
| Number | Average Value | Number | Average Value | Number | Average Value |
|---|
| LOANS ORIGINATED | 75 | $176,031 | 13 | $178,682 | 1 | $168,380 |
| APPLICATIONS APPROVED, NOT ACCEPTED | 8 | $181,504 | 2 | $218,790 | 0 | $0 |
| APPLICATIONS DENIED | 2 | $356,280 | 0 | $0 | 0 | $0 |
| APPLICATIONS WITHDRAWN | 2 | $311,955 | 0 | $0 | 0 | $0 |
| FILES CLOSED FOR INCOMPLETENESS | 0 | $0 | 1 | $129,020 | 0 | $0 |
2005 - 2018 National Fire Incident Reporting System (NFIRS) incidents
See full 2006 National Fire Incident Reporting System statistics for zip code 15090, Pennsylvania
| Most common first names in zip code 15090 among deceased individuals |
| Name | Count | Lived (average) |
|---|
| John | 96 | 76.2 years |
| Mary | 93 | 80.9 years |
| William | 65 | 76.6 years |
| Joseph | 59 | 77.3 years |
| Helen | 56 | 83.4 years |
| Margaret | 54 | 82.8 years |
| Robert | 50 | 73.7 years |
| Anna | 45 | 86.2 years |
| James | 43 | 74.9 years |
| George | 41 | 78.2 years |
| Most common last names in zip code 15090 among deceased individuals |
| Last name | Count | Lived (average) |
|---|
| Miller | 21 | 74.7 years |
| Smith | 16 | 81.1 years |
| Cole | 12 | 73.5 years |
| Jones | 11 | 81.4 years |
| Sarver | 10 | 73.4 years |
| Richard | 10 | 78.0 years |
| Steigerwald | 9 | 76.3 years |
| Schultz | 7 | 81.3 years |
| Fisher | 7 | 83.7 years |
| Martin | 7 | 84.6 years |
| Businesses in zip code 15090 |
| Name | Count | | Name | Count |
| 7-Eleven | 1 | | Jones New York | 1 |
| AT&T | 1 | | Lane Furniture | 2 |
| Ace Hardware | 1 | | MasterBrand Cabinets | 4 |
| Arby's | 1 | | Mazda | 1 |
| Bally Total Fitness | 1 | | McDonald's | 1 |
| Burger King | 1 | | Nissan | 1 |
| CVS | 1 | | Panera Bread | 1 |
| Chevrolet | 1 | | Pizza Hut | 1 |
| Chico's | 1 | | Rite Aid | 2 |
| DHL | 1 | | SONIC Drive-In | 1 |
| Dunkin Donuts | 1 | | Starbucks | 2 |
| Econo Lodge | 1 | | Subway | 1 |
| Ethan Allen | 1 | | U-Haul | 1 |
| FedEx | 11 | | UPS | 10 |
| Firestone Complete Auto Care | 1 | | Volkswagen | 1 |
| Ford | 1 | | Walgreens | 1 |
| Honda | 1 | | Wendy's | 1 |
| Hyundai | 1 | | | |