Draft:Original research/Atmospheric sciences

Atmospheric sciences is an umbrella term for the study of the Earth's and other objects, sources, or entities atmosphere, its processes, the effects other systems have on the atmosphere, and the effects of the atmosphere on these other systems.
Sciences
[edit | edit source]
Def. the disciplines or branches of learning, especially those "dealing with measurable or systematic principles ... the collective [disciplines] of study or learning acquired through the scientific method"[1] are called the sciences.
Def. in the definite a "method of discovering knowledge about the natural world based in making falsifiable predictions (hypotheses), testing them empirically, & developing theories that match known data from repeatable physical experimentation"[2] is called the scientific method.
Climatology is the study of climate, scientifically defined as weather conditions averaged over a period of time,[3] and is a branch of the atmospheric sciences.
Climate encompasses the statistics of temperature, humidity, atmospheric pressure, wind, rainfall, atmospheric particle count and numerous other meteorological elements in a given region over long periods of time.
Atmospheres
[edit | edit source]Def. the "gases surrounding the Earth or any astronomical body"[4] are called an atmosphere.
Theoretical atmospheric sciences
[edit | edit source]Def. the invisible gaseous substance "above the surface of the earth"[5] is called air.
Def. "[t]he air in a particular place"[4] is called an atmosphere.
Meteors
[edit | edit source]Meteors typically occur in the mesosphere, and most range in altitude from 75 km to 100 km.[6] Millions of meteors occur in the Earth's atmosphere every day.
Aerometeors
[edit | edit source]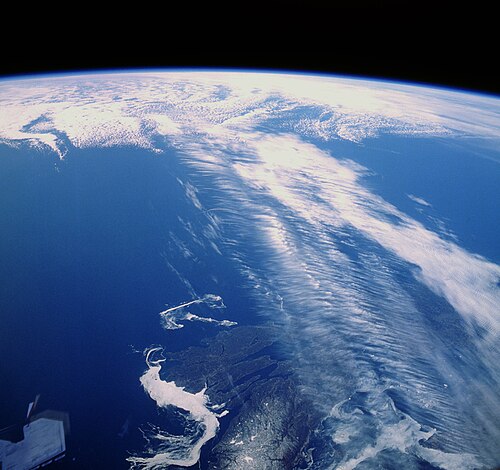

On the right is a composite of hourly radar images. These wind gusts averaged ~75 mph over about 450 miles. This is referred to as the Derecho event.
Def. a discrete unit of air, wind, or mist traveling or falling through or partially through an atmosphere is called an aerometeor.
Def. a "wind whose direction and speed are determined by a balance of the horizontal pressure gradient force and the force due to the earth's rotation to the left in the northern hemisphere and to the right in the southern hemisphere"[7] is called a geostrophic wind.
Def. a "warm dry wind blowing down the side of a mountain"[8] is called a foehn, or foehn wind, or chinook.
"The chinook generally blows from the southwest, but its direction may be modified by topography. When it sets in after a spell of intense cold, the temperature may rise by 20–40°F in 15 minutes due to replacement of a cold air mass with a much warmer air mass in minutes."[9]
"Wind shear is a change in wind direction, wind speed, or both, along a given direction in space (e.g., along a horizontal or vertical distance)."[10]
Def. a "strong, abrupt rush of wind"[11] is called a gust.
Def. "any of the high-speed, high-altitude air currents that circle the Earth in a westerly direction"[12] is called a jet stream.
Clouds
[edit | edit source]
Def. "a visible mass of
- water droplets suspended in the air ...
- dust,
- steam ...
- smoke ...
- a group or swarm"[13] is called a cloud.
Clouds have been observed on other planets and moons within the Solar System, but, due to their different temperature characteristics, they are composed of other substances such as methane, ammonia, and sulfuric acid.
Clouds "act as electric insulators; space charge develops on the surface of the cloud and the distribution of fair-weather currents and fields in the vicinity of the cloud are altered."[14]
The "electrical environment around clouds is such that high space charge densities can exist."[15]
Cumulonimbuses
[edit | edit source]
A "thunderstorm supplies a negative charge to the Earth. The net positive space charge in the air between the ground and a height of ~ 10 km is nearly equal to the negative charge on the Earth's surface".[14]
'Giant' "thunderclouds can produce transverse electric fields of tens of microvolts per meter in the equatorial plane of the midlatitude magnetosphere."[16]
The "contribution to global thunderstorm activity by oceanic thunderstorms should be regarded as itself having a diurnal variation of some 18% in amplitude."[17]
Hydrometeors
[edit | edit source]Def. any "or all of the forms of water particles, whether liquid or solid, that fall from the atmosphere""[18] are called precipitation.
Def. "precipitation products of the condensation of atmospheric water vapour"[19] are called hydrometeors.
"Condensation or sublimation of atmospheric water vapor produces a hydrometeor. It forms in the free atmosphere, or at the earth's surface, and includes frozen water lifted by the wind. Hydrometeors which can cause a surface visibility reduction, generally fall into one of the following two categories:
- Precipitation. Precipitation includes all forms of water particles, both liquid and solid, which fall from the atmosphere and reach the ground; these include: liquid precipitation (drizzle and rain), freezing precipitation (freezing drizzle and freezing rain), and solid (frozen) precipitation (ice pellets, hail, snow, snow pellets, snow grains, and ice crystals).
- Suspended (Liquid or Solid) Water Particles. Liquid or solid water particles that form and remain suspended in the air (damp haze, cloud, fog, ice fog, and mist), as well as liquid or solid water particles that are lifted by the wind from the earth’s surface (drifting snow, blowing snow, blowing spray) cause restrictions to visibility. One of the more unusual causes of reduced visibility due to suspended water/ice particles is whiteout, while the most common cause is fog."[10]
Meteorology
[edit | edit source]
Def. "the study of the atmosphere and its phenomena, especially with weather and weather forecasting"[20] is called meteorology.
Def. the "study of the theoretical effects of astronomical bodies and forces on the Earth’s atmosphere"[21] and on the atmosphere of other astronomical objects is called astrometeorology.
Def. a "system of winds rotating around a center of low atmospheric pressure ... [t]he more or less violent small-scale circulations such as tornadoes, waterspouts, and dust devils"[22] is called a cyclone.
Atmochemistry
[edit | edit source]
The emissions of biogenic volatile organic compounds (BVOC) are relevant to atmospheric particle dynamics.[23]
X-rays
[edit | edit source]
At right is an X-ray image of Mars. X-radiation from the Sun excites oxygen atoms in the Martian upper atmosphere, about 120 km above its surface, to emit X-ray fluorescence. A faint X-ray halo that extends out to 7,000 km above the surface of Mars has also been found.[24] The Chandra X-ray Observatory image on the lower right is the first look at X-rays from Mars.
Visuals
[edit | edit source]Def. "the branch of meteorology involving the observation of the atmosphere by means of balloons, airplanes, etc"[25] is called aerology.
Ions
[edit | edit source]
Def. "the atmosphere of the Earth and the other planets with reference to their chemical composition, physical properties, relative motion, and responses to radiation from space"[26] is called aeronomy.
Aeronomy is the study of the upper layers of the atmosphere, where dissociation and ionization are important.
Aeronomy is the science of the upper region of the atmosphere, where dissociation and ionization are important.[27]
The illustration on the left labels Elves, Sprites, and tendrils, a stratiform region producing positive cloud-to-ground flashes with spider lightning on the right to conventional cloud-to-air discharge, upward superbolt, blue jets and negative cloud-to-ground flash near convective core. Approximate altitudes in the Earth's atmosphere and ionosphere are indicated.
Lightnings
[edit | edit source]
Lightning is more than ground-to-cloud electron transfer.
"Cloud flashes sometimes have visible channels that extend out into the air around the storm (cloud-to-air or CA), but do not strike the ground. The terms sheet lightning or intra-cloud lightning (IC) refers to lightning embedded within a cloud that lights up as a sheet of luminosity during the flash. A related term, heat lightning, is lightning or lightning-induced illumination that is too far away for thunder to be heard. Lightning can also travel from cloud-to-cloud (CC). Spider lightning refers to long, horizontally traveling flashes often seen on the underside of stratiform clouds."[28]
"Large thunderstorms are capable of producing other kinds of electrical phenomena called transient luminous events (TLEs) that occur high in the atmosphere. They are rarely observed visually and not well understood. The most common TLEs include red sprites, blue jets, and elves."[28]
Compounds
[edit | edit source]
On the right is a satellite image of ship tracks, clouds created by the exhaust of ship smokestacks.
Venus
[edit | edit source]
In 1967, Venera-4 found the Venusian magnetic field is much weaker than that of Earth. This magnetic field is induced by an interaction between the ionosphere and the solar wind,[29][30] Venus's small induced magnetosphere provides negligible protection to the atmosphere against cosmic radiation. This radiation may result in cloud-to-cloud lightning discharges.[31]
The weak magnetosphere around Venus means the solar wind is interacting directly with the outer atmosphere of the planet. Here, ions of hydrogen and oxygen are being created by the dissociation of neutral molecules from ultraviolet radiation. The solar wind then supplies energy that gives some of these ions sufficient velocity to escape the planet's gravity field. This erosion process results in a steady loss of low-mass hydrogen, helium, and oxygen ions, while higher-mass molecules, such as carbon dioxide, are more likely to be retained.
During the Soviet Venera program, the Venera 11 and Venera 12 probes detected a constant stream of lightning, and Venera 12 recorded a powerful clap of thunder soon after it landed. The European Space Agency's Venus Express recorded abundant lightning in the high atmosphere.[32]
"During a rare period of very low density solar outflow, the ionosphere of Venus was observed to become elongated downstream, rather like a long-tailed comet. ... Under normal conditions, the solar wind has a density of 5 - 10 particles per cubic cm at Earth's orbit, but occasionally the solar wind almost disappears, as happened in May 1999. ... A rare opportunity to examine what happens when a tenuous solar wind arrives at Venus came 3 - 4 August 2010, following a series of large coronal mass ejections on the Sun. NASA's STEREO-B spacecraft, orbiting downstream from Venus, observed that the solar wind density at Earth's orbit dropped to the remarkably low figure of 0.1 particles per cubic cm and persisted at this value for an entire day."[33]
"The observations show that the night side ionosphere moved outward to at least 15 000 km from Venus' centre over a period of only a few hours," said Markus Fraenz, also from the Max Planck Institute for Solar System Research, who was the team leader and a co-author of the paper.[33] "It may possibly have extended for millions of kilometres, like an enormous tail."[33]
"Although we cannot determine the full length of the night-side ionosphere, since the orbit of Venus Express provides limited coverage, our results suggest that Venus' ionosphere resembled the teardrop-shaped ionosphere found around comets, rather than the more symmetrical, spherical shape which usually exists."[33]
"The side of Venus' ionosphere that faces away from the sun can billow outward like the tail of a comet, while the side facing the star remains tightly compacted, researchers said. ... "As this significantly reduced solar wind hit Venus, Venus Express saw the planet’s ionosphere balloon outwards on the planet’s ‘downwind’ nightside, much like the shape of the ion tail seen streaming from a comet under similar conditions," ESA officials said in a statement today (Jan. 29). It only takes 30 to 60 minutes for the planet's comet-like tail to form after the solar wind dies down. Researchers observed the ionosphere stretch to at least 7,521 miles (12,104 kilometers) from the planet, said Yong Wei, a scientist at the Max Planck Institute in Katlenburg, Germany who worked on this research."[34]
Earth
[edit | edit source]

These molecules in many instances are in turn made up of atoms of chemical elements. At your geographical location, specified in latitude and longitude, this gaseous envelope extends upward. The atmosphere of Earth changes with altitude. At high enough altitude the composition changes significantly, as does the temperature and pressure.
The Earth's atmosphere is divided into altitude regions:[35]
- Troposphere — surface to 8,000 m at the poles – 18,000 m at the equator, ending at the Tropopause.
- Stratosphere — Troposphere to 50 km
- Mesosphere — Stratosphere to 85 km
- Thermosphere — Mesosphere to 675 km
- Exosphere — Thermosphere to 10,000 km, after altitude regions.
Astrognosy
[edit | edit source]
Def. the "lower levels of the atmosphere extending from [a solid or liquid] surface up to the tropopause ... characterized by convective air movements and a large vertical temperature change"[36] is called a troposphere.
Def. the "zone of transition between the troposphere and the stratosphere"[37] is called a tropopause.
Def. the "region ... where temperature increases along with the altitude ... [extending] from the tropopause ... to ... the mesosphere"[38] is called a stratosphere.
Def. a "layer of the Earth's atmosphere that is directly above the stratosphere and directly below the thermosphere"[39] is called a mesosphere.
Def. in "the atmosphere, the boundary between the mesosphere and the ionosphere,[40] [...] where the temperature reaches its minimum value"[41] is called a mesopause.
Def. a "layer of the Earth's atmosphere directly above the mesosphere and directly below the exosphere"[42] is called a thermosphere.
Ionospheres
[edit | edit source]
Upon reaching the top of the mesosphere, the temperature starts to rise, but air pressure continues to fall. This is the beginning of the ionosphere, a region dominated by chemical ions. Many of them are the same chemicals such as nitrogen and oxygen in the atmosphere below, but an ever increasing number are hydrogen ions (protons) and helium ions. These can be detected by an ion spectrometer. The process of ionization removes one or more electrons from a neutral atom to yield a variety of ions depending on the chemical element species and incidence of sufficient energy to remove the electrons.
Def. the "part of the Earth's atmosphere beginning at an altitude of about 50 kilometers [31 miles] and extending outward 500 kilometers [310 miles] or more"[43] or the "similar region of the atmosphere of another planet"[44] is called the ionosphere.
"As a spacecraft travels through the solar system, a targeted radio signal sent back to Earth can be aimed through the ionosphere of a nearby planet. Plasma in the ionosphere causes small but detectable changes in the signal that allow scientists to learn about the upper atmosphere."[45]
Climatology
[edit | edit source]Climatology is the study of climate, scientifically defined as weather conditions averaged over a period of time,[3] and is a branch of the atmospheric sciences.
Climate encompasses the statistics of temperature, humidity, atmospheric pressure, wind, rainfall, atmospheric particle count and numerous other meteorological elements in a given region over long periods of time.
Mars
[edit | edit source]

At right is a view of the Martian atmosphere and surface taken through the Viking Orbiter violet filter to illustrate the dramatic clarity "of the atmosphere in the region east and northeast of the Argyre basin during winter in the southern hemisphere. [The image is] taken just after the winter solstice when solar heating is minimal."[46]
"On Sol 20 of its journey, Mars Exploration Rover Opportunity woke up around 5:30 in the martian afternoon to watch the sunset. A series of five sets of three-color images [on the lower right] from the rover's panoramic camera was acquired looking toward the southwest. Each set used an infrared, green and violet filter, rather than the human red-green-blue, so that the maximum panoramic camera wavelength range could be covered by the observations, enhancing the scientific value of the measurements."[47]
"A color image was made [at lower right] from the first post-sunset sequence of calibrated color images, with the color balance set to approximate what the sunset color would have looked like to the human eye. The color seen in this first post-sunset image was then used to colorize each image in the sequence. Approximately one-minute gaps between consecutive color images meant the Sun's position changed within each color set, so the images had to be manually shifted to compensate for this motion. In this fashion, the position and brightness of the Sun are taken from each individual image, but the color is taken from a single set of images. The images were then combined into a movie where one color set fades gracefully into the next. Analysis of the five color sets shows that there were only small color variations during the sunset, so most of the real variations are captured in the movie."[47]
"The rapid dimming of the Sun near the horizon is due to the dust in the sky. There is nearly twice as much dust as there was when the Mars Pathfinder spacecraft, which landed on Mars in 1997, imaged the sunset. This causes the Sun to be many times fainter. The sky above the Sun has the same blue tint observed by Pathfinder and also by Viking, which landed on Mars in 1976. This is because dust in the martian atmosphere scatters blue light forward toward the observer much more efficiently than it scatters red light forward. Therefore, a "halo" of blueish sky color is always observed close to the Sun. We're only seeing half of this halo in the movie, because the other half is below the horizon."[47]
"Looking at how gas circulates in [the Martian thermosphere] allows us to better understand the rate at which the atmosphere is being lost and the way it’s being lost."[48]
"When [NASA’s MAVEN spacecraft] is flying over a mountain, we can see the wind shifting to accommodate the presence of that mountain 200 kilometers below. MAVEN doesn’t carry [traditional] cameras … but we can see a picture of the topography in the winds."[48]
Hypotheses
[edit | edit source]- Atmospheres such as on Earth may be governed more by the natural electric field of the Earth than by convection kinetics.
See also
[edit | edit source]References
[edit | edit source]- ↑ "science". San Francisco, California: Wikimedia Foundation, Inc. February 15, 2013. Retrieved 2013-02-19.
- ↑ "scientific method". San Francisco, California: Wikimedia Foundation, Inc. December 27, 2012. Retrieved 2013-02-19.
- ↑ 3.0 3.1 "Climate Prediction Center Climate Glossary". Retrieved November 23, 2006.
- ↑ 4.0 4.1 212.159.113.112 (6 May 2003). atmosphere. San Francisco, California: Wikimedia Foundation, Inc. https://en.wiktionary.org/wiki/atmosphere. Retrieved 2016-02-06.
- ↑ air. San Francisco, California: Wikimedia Foundation, Inc. February 10, 2013. http://en.wiktionary.org/wiki/air. Retrieved 2013-02-22.
- ↑ Philip J. Erickson. Millstone Hill UHF Meteor Observations: Preliminary Results. http://www.haystack.mit.edu/~pje/meteors/.
- ↑ "geostrophic wind". San Francisco, California: Wikimedia Foundation, Inc. July 11, 2011. Retrieved 2013-02-17.
- ↑ "foehn". San Francisco, California: Wikimedia Foundation, Inc. January 19, 2013. Retrieved 2013-02-17.
- ↑ "chinook". San Francisco, California: Wikimedia Foundation, Inc. October 17, 2012. Retrieved 2013-02-17.
- ↑ 10.0 10.1 Mark R. Mireles; Kirth L. Pederson; Charles H. Elford (February 21, 2007). Meteorologial Techniques. Offutt Air Force Base, Nebraska, USA: Air Force Weather Agency/DNT. http://oai.dtic.mil/oai/oai?verb=getRecord&metadataPrefix=html&identifier=ADA466107. Retrieved 2013-02-17.
- ↑ "gust". San Francisco, California: Wikimedia Foundation, Inc. January 14, 2013. Retrieved 2013-02-17.
- ↑ "jet stream". San Francisco, California: Wikimedia Foundation, Inc. November 10, 2012. Retrieved 2013-02-17.
- ↑ "cloud". San Francisco, California: Wikimedia Foundation, Inc. February 13, 2013. Retrieved 2013-02-18.
- ↑ 14.0 14.1 Eileen K. Stansbery (March 1989). A global model of thunderstorm electricity and the prediction of whistler duct formation. Houston, Texas USA: Rice University. pp. 174. http://scholarship.rice.edu/bitstream/handle/1911/16298/9012871.PDF?sequence=1. Retrieved 2015-01-03.
- ↑ R. G. Harrison; K. S. Carslaw (September 2003). "Ion-aerosol-cloud processes in the lower atmosphere". Reviews of Geophysics 41 (3): 1012. doi:10.1029/2002RG000114. http://onlinelibrary.wiley.com/doi/10.1029/2002RG000114/full. Retrieved 2015-01-06.
- ↑ C. G. Park; M. Dejnakarintra (1 October 1973). "Penetration of thundercloud electric fields into the ionosphere and magnetosphere: 1. Middle and subauroral latitudes". Journal of Geophysical Research Space Physics 78 (28): 6623-33. doi:10.1029/JA078i028p06623. http://onlinelibrary.wiley.com/doi/10.1029/JA078i028p06623/abstract. Retrieved 2015-01-06.
- ↑ M.S. Muir; C.A. Smart (February 1981). "Diurnal variations in the atmospheric electric field on the South Polar ice-cap". Journal of Atmospheric and Terrestrial Physics 43 (2): 171-7. doi:10.1016/0021-9169(81)90077-5. http://www.sciencedirect.com/science/article/pii/0021916981900775. Retrieved 2015-01-06.
- ↑ "precipitation". San Francisco, California: Wikimedia Foundation, Inc. February 10, 2013. Retrieved 2013-02-15.
- ↑ "hydrometeor". San Francisco, California: Wikimedia Foundation, Inc. July 7, 2012. Retrieved 2013-02-15.
- ↑ "meteorology". San Francisco, California: Wikimedia Foundation, Inc. January 22, 2013. Retrieved 2013-02-15.
- ↑ "astrometeorology". San Francisco, California: Wikimedia Foundation, Inc. February 12, 2011. Retrieved 2013-02-15.
- ↑ "cyclone". San Francisco, California: Wikimedia Foundation, Inc. February 8, 2013. Retrieved 2013-02-22.
- ↑ R. Steinbrecher; B. Rappenglück; A. Hansel; M. Graus; O. Klemm; A. Held; A. Wiedensohler; A. Nowak (2004). Egbert Matzner. ed. The Emissions of Biogenic Volatile Organic Compounds (BVOC) and Their Relevance to Atmospheric Particle Dynamics, In: Biogeochemistry of Forested Catchments in a Changing Environment A German Case Study. Berlin: Springer-Verlag. pp. 215-32. ISBN 3-540-20973-5. http://books.google.com/books?id=9AWCt2ULM4QC&printsec=frontcover&hl=en. Retrieved 2012-02-22.
- ↑ K. Dennerl (November 2002). "Discovery of X-rays from Mars with Chandra". Astronomy & Astrophysics 394 (11): 1119-28. doi:10.1051/0004-6361:20021116.
- ↑ Sandman30s (22 July 2005). aerology. San Francisco, California: Wikimedia Foundation, Inc. https://en.wiktionary.org/wiki/aerology. Retrieved 2018-02-23.
- ↑ aeronomy. San Francisco, California: Wikimedia Foundation, Inc. March 26, 2012. http://en.wiktionary.org/wiki/aeronomy. Retrieved 2013-02-22.
- ↑ Sydney Chapman. The Thermosphere - the Earth's Outermost Atmosphere. Physics of the Upper Atmosphere 1960. Academic Press. pp. 4. ISBN 978-0125820509.
- ↑ 28.0 28.1 Carlos Miralles (AeroVironment); Tom Nelson (FMA) (25 June 2019). "SEVERE WEATHER 101 Lightning Types". NSSL, NOAA. Retrieved 25 June 2019.
- ↑ Dolginov, Nature of the Magnetic Field in the Neighborhood of Venus, COsmic Research, 1969
- ↑ Kivelson G. M.; Russell C. T. (1995). Introduction to Space Physics. Cambridge University Press. ISBN 0-521-45714-9.
- ↑ Upadhyay, H. O.; Singh, R. N. (April 1995). "Cosmic ray Ionization of Lower Venus Atmosphere". Advances in Space Research 15 (4): 99–108. doi:10.1016/0273-1177(94)00070-H.
- ↑ Venus also zapped by lightning. CNN. 29 November 2007. http://web.archive.org/web/20071130201237/http://www.cnn.com/2007/TECH/space/11/28/venus.lightning.ap/index.html. Retrieved 2007-11-29.
- ↑ 33.0 33.1 33.2 33.3 Yong Wei; Markus Fraenz; Håkan Svedhem (January 29, 2013). The tail of Venus and the weak solar wind. European Space Agency. http://sci.esa.int/science-e/www/object/index.cfm?fobjectid=51315. Retrieved 2013-02-01.
- ↑ Miriam Kramer (January 31, 2013). Venus Can Have 'Comet-Like' Atmosphere. Yahoo! News. http://news.yahoo.com/venus-havecomet-atmosphere-120238337.html. Retrieved 2013-01-31.
- ↑ Layers of the Atmosphere. National Weather Service. http://www.srh.noaa.gov/srh/jetstream/atmos/layers.htm. Retrieved 22 December 2005.
- ↑ "troposphere". San Francisco, California: Wikimedia Foundation, Inc. January 13, 2013. Retrieved 2013-02-21.
- ↑ "tropopause,". San Francisco, California: Wikimedia Foundation, Inc. October 15, 2012. Retrieved 2013-02-21.
- ↑ "stratosphere". San Francisco, California: Wikimedia Foundation, Inc. February 10, 2013. Retrieved 2013-02-21.
- ↑ Joel7687 (17 September 2005). "mesosphere". San Francisco, California: Wikimedia Foundation, Inc. Retrieved 2013-02-21.
{{cite web}}:|author=has generic name (help) - ↑ Jonathan Webley (18 January 2007). "mesopause". San Francisco, California: Wikimedia Foundation, Inc. Retrieved 2013-02-21.
{{cite web}}:|author=has generic name (help) - ↑ Bakerkb1 (6 January 2011). "mesopause". San Francisco, California: Wikimedia Foundation, Inc. Retrieved 2013-02-21.
{{cite web}}:|author=has generic name (help) - ↑ Joel7687 (17 September 2006). "thermosphere". San Francisco, California: Wikimedia Foundation, Inc. Retrieved 2013-02-21.
{{cite web}}:|author=has generic name (help) - ↑ CORNELIUSSEON (11 June 2006). "ionosphere". San Francisco, California: Wikimedia Foundation, Inc. Retrieved 2012-09-20.
{{cite web}}:|author=has generic name (help) - ↑ RJFJR (15 November 2008). "ionosphere". San Francisco, California: Wikimedia Foundation, Inc. Retrieved 2012-09-20.
{{cite web}}:|author=has generic name (help) - ↑ Nola Taylor Redd (September 4, 2012). "Meteoroids Change Atmospheres of Earth, Mars, Venus". Space.com. Retrieved 2012-09-05.
- ↑ M.H. Carr; W.A. Baum; K.R. Blasius; G.A. Briggs; J.A. Cutts; T.C. Duxbury; R. Greeley; J. Guest et al. (May 9, 1980). NASA SP-441: VIKING ORBITER VIEWS OF MARS. Washington, DC USA: NASA. http://history.nasa.gov/SP-441/ch12.htm. Retrieved 2013-04-01.
- ↑ 47.0 47.1 47.2 Sue Lavoie (February 26, 2004). "PIA05343: The Sun Sets on Mars". Pasadena, California USA: NASA/JPL. Retrieved 2013-04-01.
- ↑ 48.0 48.1 Mehdi Benna (12 December 2019). "NASA's MAVEN probe shows how wind circulates in Mars' upper atmosphere". Science News. Retrieved 15 December 2019.
External links
[edit | edit source]- African Journals Online
- Bing Advanced search
- Google Books
- Google scholar Advanced Scholar Search
- International Astronomical Union
- JSTOR
- Lycos search
- NASA/IPAC Extragalactic Database - NED
- NASA's National Space Science Data Center
- NCBI All Databases Search
- NCBI Site Search
- Office of Scientific & Technical Information
- PubChem Public Chemical Database
- Questia - The Online Library of Books and Journals
- SAGE journals online
- The SAO/NASA Astrophysics Data System
- Scirus for scientific information only advanced search
- SDSS Quick Look tool: SkyServer
- SIMBAD Astronomical Database
- SIMBAD Web interface, Harvard alternate
- Spacecraft Query at NASA
- SpringerLink
- Taylor & Francis Online
- WikiDoc The Living Textbook of Medicine
- Wiley Online Library Advanced Search
- Yahoo Advanced Web Search
{{Chemistry resources}}{{Dominant group}}
Learn more about Atmospheric sciences |