Development regions of Romania: Difference between revisions
Paulinho28 (talk | contribs) |
Paulinho28 (talk | contribs) Undid revision 714739254 by Paulinho28 (talk) |
||
| Line 56: | Line 56: | ||
|align=center|8,700 |
|align=center|8,700 |
||
|align=center|36 |
|align=center|36 |
||
|16, |
|16,925 |
||
|6, |
|6,500 |
||
| |
|34,001 |
||
|align=center| |
|align=center|13,100 |
||
|align=center| |
|align=center|48 |
||
|- |
|- |
||
|[[Centru (development region)|Centru]] |
|[[Centru (development region)|Centru]] |
||
| Line 68: | Line 68: | ||
|align=center|9,100 |
|align=center|9,100 |
||
|align=center|37 |
|align=center|37 |
||
|16, |
|16,600 |
||
| |
|7,100 |
||
| |
|33,349 |
||
|align=center| |
|align=center|14,200 |
||
|align=center| |
|align=center|52 |
||
|- |
|- |
||
|[[Nord-Est (development region)|Nord-Est]] |
|[[Nord-Est (development region)|Nord-Est]] |
||
Revision as of 15:27, 11 April 2016

 |
|---|
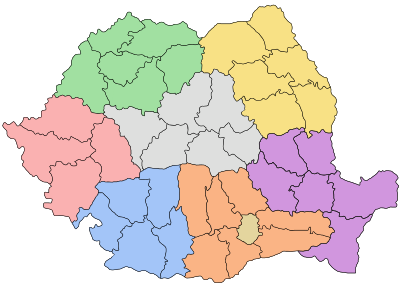
The development regions of Romania (Romanian Regiunile de dezvoltare ale României) refer to the eight regional divisions created in Romania in 1998 in order to better co-ordinate regional development as Romania progressed towards accession to the European Union. The development regions correspond to NUTS II-level divisions in European Union member states. Despite becoming increasingly significant in regional development projects, Romania's development regions do not actually have an administrative status and do not have a legislative or executive council or government. Rather, they serve a function for allocating European Union PHARE funds for regional development, as well as for collection of regional statistics. They also co-ordinate a range of regional development projects and became members of the Committee of the Regions when Romania joined the EU on January 1, 2007.
List
There are 8 development regions in Romania, which (with the exception of București-Ilfov) are named by their geographical position in the country:
- RO1 – Macroregiunea 1:
- RO2 – Macroregiunea 2:
- RO3 – Macroregiunea 3:
- Sud - Muntenia – RO31; 7 counties; 3,136,446 inhabitants; 34,489 km2 (13,316 sq mi)
- București - Ilfov – RO32; 1 county and Bucharest; 2,272,163 inhabitants; 1,811 km2 (699 sq mi)
- RO4 – Macroregiunea 4:
- Sud-Vest Oltenia – RO41; 5 counties; 2,075,642 inhabitants; 29,212 km2 (11,279 sq mi)
- Vest – RO42; 4 counties; 1,828,313 inhabitants; 32,028 km2 (12,366 sq mi)
Economy
| 2006 | 2014[1] | |||||||||
|---|---|---|---|---|---|---|---|---|---|---|
| Region (NUTS) |
Total (million €) [2] |
€ per capita [3] |
PPP (million €) [4] |
PPP € per capita [5] |
% of EU average GDP (PPP) [6] |
Total (million €) |
€ per capita |
PPP (million €) |
PPP € per capita |
% of EU average GDP (PPP) |
| Romania | 98,419 | 4,500 | 196,999 | 9,200 | 38 | 150,230 | 7,500 | 301,801 | 15,200 | 55 |
| Nord-Vest | 11,675 | 4,200 | 23,370 | 8,700 | 36 | 16,925 | 6,500 | 34,001 | 13,100 | 48 |
| Centru | 11,335 | 4,500 | 22,689 | 9,100 | 37 | 16,600 | 7,100 | 33,349 | 14,200 | 52 |
| Nord-Est | 10,787 | 2,900 | 21,591 | 5,900 | 24 | 15,387 | 4,700 | 30,912 | 9,500 | 34 |
| Sud-Est | 11,051 | 3,800 | 22,119 | 7,900 | 32 | 16,935 | 6,800 | 34,020 | 13,600 | 50 |
| Sud - Muntenia | 12,482 | 3,800 | 24,985 | 7,700 | 31 | 18,234 | 5,900 | 36,630 | 11,900 | 43 |
| București - Ilfov | 22,946 | 9,900 | 45,931 | 21,100 | 86 | 40,453 | 17,700 | 81,267 | 35,600 | 129 |
| Sud-Vest Oltenia | 8,138 | 3,600 | 16,290 | 7,200 | 29 | 11,288 | 5,600 | 22,677 | 11,200 | 41 |
| Vest | 9,940 | 5,300 | 19,897 | 10,500 | 43 | 14,285 | 7,900 | 28,698 | 15,800 | 58 |
See also
- Administrative divisions of Romania
- Region (Europe)
- Nomenclature of Territorial Units for Statistics
- Historical regions of Romania
References
- ^ Eurostat (26 February 2016). "GDP per capita in the EU in 2014". Europa web portal. Retrieved 28 February 2016.
- ^ "Site3-TGM table". Epp.eurostat.ec.europa.eu. Retrieved 2009-07-14.
- ^ Eurostat (19 February 2009). "GDP per inhabitant in the EU in 2006" (PDF). Europa web portal. Retrieved 28 February 2016.
- ^ "Site3-TGM table". Epp.eurostat.ec.europa.eu. Retrieved 2009-07-14.
- ^ "Site3-TGM table". Epp.eurostat.ec.europa.eu. Retrieved 2009-07-14.
- ^ "Site3-TGM table". Epp.eurostat.ec.europa.eu. Retrieved 2009-07-14.
| |||||||||||||||||||||||||||||