Development regions of Romania: Difference between revisions
WikiEditor50 (talk | contribs) |
LeinadWalter (talk | contribs) No edit summary |
||
| (26 intermediate revisions by 11 users not shown) | |||
| Line 1: | Line 1: | ||
{{Short description|Overview article}} |
|||
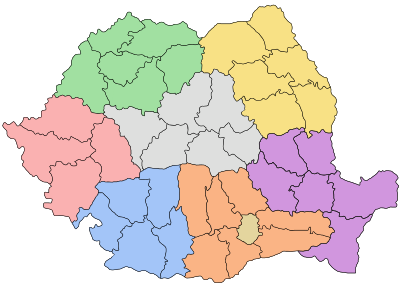
[[Image:Regiuni de dezvoltare.svg|thumb|right|350px|Map of the development regions]] |
|||
{{Use dmy dates|date=May 2023}} |
|||
{{Politics of Romania}} |
|||
[[File:Regiuni de dezvoltare.svg|thumb|right|350px|Map of the development regions (NUTS-2 level divisions)]] |
|||
[[File:România Macroregiuni.svg|thumb|right|350px|Map of the macroregions (NUTS-1 level divisions)]] |
|||
The '''development regions of Romania''' ({{lang-ro|Regiunile de dezvoltare ale României}}) refer to the eight regional divisions created in [[Romania]] in 1998 in order to better co-ordinate regional development as Romania progressed towards accession to the [[European Union]]. The development regions correspond to [[Nomenclature of Territorial Units for Statistics|NUTS |
The '''development regions of Romania''' ({{lang-ro|Regiunile de dezvoltare ale României}}) refer to the eight regional divisions created in [[Romania]] in 1998 in order to better co-ordinate regional development as Romania progressed towards accession to the [[European Union]] (EU). The development regions correspond to [[Nomenclature of Territorial Units for Statistics|NUTS 2]]-level divisions in [[Member state of the European Union|EU member states]]. Despite becoming increasingly significant in regional development projects, Romania's development regions do not actually have an administrative status and do not have a legislative or executive council or government. Rather, they serve a function for allocating EU [[PHARE]] funds for regional development, as well as for collection of regional statistics. They also co-ordinate a range of regional development projects and became members of the [[Committee of the Regions]] when Romania joined the EU on January 1, 2007. |
||
==List== |
==List== |
||
There are eight development regions in Romania, which (with the exception of București-Ilfov) are named by their geographical position in the country: |
There are eight development regions in Romania, which (with the exception of București-Ilfov) are named by their geographical position in the country: |
||
*RO1 – [[ |
*RO1 – [[Macroregiunea Unu]]: |
||
**[[Nord-Vest (development region)|Nord-Vest]] – RO11; 6 counties; 2, |
**[[Nord-Vest (development region)|Nord-Vest]] – RO11; 6 counties; 2,521,793 inhabitants; {{convert|34159|km2|sqmi|abbr=on}} |
||
**[[Centru (development region)|Centru]] – RO12; 6 counties; 2, |
**[[Centru (development region)|Centru]] – RO12; 6 counties; 2,271,066 inhabitants; {{convert|34082|km2|sqmi|abbr=on}} |
||
*RO2 – Macroregiunea |
*RO2 – [[Macroregiunea Doi]]: |
||
**[[Nord-Est (development region)|Nord-Est]] – RO21; 6 counties; 3, |
**[[Nord-Est (development region)|Nord-Est]] – RO21; 6 counties; 3,226,436 inhabitants; {{convert|36850|km2|sqmi|abbr=on}} |
||
**[[Sud-Est (development region)|Sud-Est]] – RO22; 6 counties; 2, |
**[[Sud-Est (development region)|Sud-Est]] – RO22; 6 counties; 2,367,987 inhabitants; {{convert|35762|km2|sqmi|abbr=on}} |
||
*RO3 – Macroregiunea |
*RO3 – [[Macroregiunea Trei]]: |
||
**[[Sud (development region)|Sud - Muntenia]] – RO31; 7 counties; |
**[[Sud (development region)|Sud - Muntenia]] – RO31; 7 counties; 2,864,337 inhabitants; {{convert|34489|km2|sqmi|abbr=on}} |
||
**[[București-Ilfov (development region)|București - Ilfov]] – RO32; 1 county and Bucharest; 2, |
**[[București-Ilfov (development region)|București - Ilfov]] – RO32; 1 county and Bucharest; 2,259,669 inhabitants; {{convert|1811|km2|sqmi|abbr=on}} |
||
*RO4 – Macroregiunea |
*RO4 – [[Macroregiunea Patru]]: |
||
**[[Sud-Vest (development region)|Sud-Vest Oltenia]] – RO41; 5 counties; |
**[[Sud-Vest (development region)|Sud-Vest Oltenia]] – RO41; 5 counties; 1,873,606 inhabitants; {{convert|29212|km2|sqmi|abbr=on}} |
||
**[[Vest (development region)|Vest]] – RO42; 4 counties; 1, |
**[[Vest (development region)|Vest]] – RO42; 4 counties; 1,668,921 inhabitants; {{convert|32028|km2|sqmi|abbr=on}} |
||
{| class="wikitable sortable" |
|||
|+ |
|||
! | No |
|||
! | Name |
|||
! | Code |
|||
! | Area, km<sup>2</sup> |
|||
! | Population |
|||
! | Municipalities |
|||
! | Other cities |
|||
! | Communes |
|||
! | Villages |
|||
|- |
|||
| '''1''' || [[Nord-Est (development region)|Nord-Est]] || RO21 || '''36,850''' || '''3,226,436''' || '''17''' || '''29''' || '''506''' || '''2,414''' |
|||
|- |
|||
| '''2''' || [[Sud-Est (development region)|Sud-Est]]|| RO22 || '''35,762''' || '''2,367,987''' || '''11''' || '''24''' || '''355''' || '''1,448''' |
|||
|- |
|||
| '''3''' || [[Sud (development region)|Sud - Muntenia]]|| RO31 || '''34,453''' || '''2,864,337''' || '''16''' || '''32''' || '''519''' || '''2,019''' |
|||
|- |
|||
| '''4''' || [[Sud-Vest (development region)|Sud-Vest Oltenia]]|| RO41 || '''29,212''' || '''1,873,606''' || '''11''' || '''29''' || '''408''' || '''2,070''' |
|||
|- |
|||
| '''5''' || [[Vest (development region)|Vest]]|| RO42 || '''32,034''' || '''1,688,921''' || '''12''' || '''30''' || '''281''' || '''1,327''' |
|||
|- |
|||
| '''6''' || [[Nord-Vest (development region)|Nord-Vest]] || RO11 || '''34,159''' || '''2,521,793''' || '''15''' || '''28''' || '''403''' || '''1,800''' |
|||
|- |
|||
| '''7''' || [[Centru (development region)|Centru]] || RO12 || '''34,100''' || '''2,271,066''' || '''20''' || '''37''' || '''357''' || '''1,788''' |
|||
|- |
|||
| '''8''' || [[București-Ilfov (development region)|București - Ilfov]] || RO32 || '''1,821''' || '''2,259,669''' || '''1''' || '''8''' || '''32''' || '''91''' |
|||
|- |
|||
! colspan=3| '''Total''' || '''238,391''' || '''19,053,815''' || '''103''' || '''217''' || '''2,861''' || '''12,957''' |
|||
|} |
|||
==Economy== |
==Economy== |
||
| Line 25: | Line 58: | ||
!colspan=5 style="text-align:center|2006 |
!colspan=5 style="text-align:center|2006 |
||
!colspan=5 style="text-align:center|2016<ref name=eurostat16>{{cite web|url=http://ec.europa.eu/eurostat/documents/2995521/8700651/1-28022018-BP-EN/15f5fd90-ce8b-4927-9a3b-07dc255dc42a |title=Statistics |website=ec.europa.eu |access-date=2019-05-17}}</ref> |
!colspan=5 style="text-align:center|2016<ref name=eurostat16>{{cite web|url=http://ec.europa.eu/eurostat/documents/2995521/8700651/1-28022018-BP-EN/15f5fd90-ce8b-4927-9a3b-07dc255dc42a |title=Statistics |website=ec.europa.eu |access-date=2019-05-17}}</ref> |
||
!2020 |
|||
|- |
|- |
||
![[Administrative divisions of Romania|Region]]<br /><small>([[Nomenclature of Territorial Units for Statistics|NUTS]])</small><br /> |
![[Administrative divisions of Romania|Region]]<br /><small>([[Nomenclature of Territorial Units for Statistics|NUTS-3]])</small><br /> |
||
!Total<br /><small>(million [[Euro|€]])</small><br /><ref>{{cite web|url=http://epp.eurostat.ec.europa.eu/tgm/table.do?tab=table&init=1&language=en&pcode=tgs00003&plugin=1 |title=Site3-TGM table |publisher=Epp.eurostat.ec.europa.eu |access-date=2009-07-14}}</ref><br /> |
!Total<br /><small>(million [[Euro|€]])</small><br /><ref>{{cite web|url=http://epp.eurostat.ec.europa.eu/tgm/table.do?tab=table&init=1&language=en&pcode=tgs00003&plugin=1 |title=Site3-TGM table |publisher=Epp.eurostat.ec.europa.eu |access-date=2009-07-14}}</ref><br /> |
||
!€ per<br />capita<br /><ref name=eurostat06>{{cite web|title=GDP per inhabitant in the EU in 2006|publisher=Europa web portal|author=Eurostat|date=19 February 2009|url=http://europa.eu/rapid/press-release_STAT-09-23_en.pdf|access-date=28 February 2016}}</ref> |
!€ per<br />capita<br /><ref name=eurostat06>{{cite web|title=GDP per inhabitant in the EU in 2006|publisher=Europa web portal|author=Eurostat|date=19 February 2009|url=http://europa.eu/rapid/press-release_STAT-09-23_en.pdf|access-date=28 February 2016}}</ref> |
||
| Line 37: | Line 71: | ||
!PPP<br /><small>€ per capita</small> |
!PPP<br /><small>€ per capita</small> |
||
!% of<br />[[Economy of the European Union|EU average]]<br /><small>GDP (PPP)</small> |
!% of<br />[[Economy of the European Union|EU average]]<br /><small>GDP (PPP)</small> |
||
!% of<br />[[Economy of the European Union|EU average]]<br /><small>GDP per<br> capita</small><ref >{{cite web|title=Gross domestic product (GDP) at current market prices by NUTS 2 regions| website=European Commission| access-date=14 May 2023 | url=https://ec.europa.eu/eurostat/databrowser/view/NAMA_10R_2GDP__custom_3988641/default/table?lang=en}}</ref> |
|||
|- |
|- |
||
![[Romania]] |
![[Romania]] |
||
| Line 49: | Line 84: | ||
!17,000 |
!17,000 |
||
!58 |
!58 |
||
!72 |
|||
|- |
|- |
||
|[[Nord-Vest (development region)|Nord-Vest]] |
|[[Nord-Vest (development region)|Nord-Vest]] |
||
| Line 61: | Line 97: | ||
|align=center|14,300 |
|align=center|14,300 |
||
|align=center|51 |
|align=center|51 |
||
|67 |
|||
|- |
|- |
||
|[[Centru (development region)|Centru]] |
|[[Centru (development region)|Centru]] |
||
| Line 73: | Line 110: | ||
|align=center|15,800 |
|align=center|15,800 |
||
|align=center|54 |
|align=center|54 |
||
|67 |
|||
|- |
|- |
||
|[[Nord-Est (development region)|Nord-Est]] |
|[[Nord-Est (development region)|Nord-Est]] |
||
| Line 85: | Line 123: | ||
| style="text-align:center; background:#eaa;"|10,400 |
| style="text-align:center; background:#eaa;"|10,400 |
||
| style="text-align:center; background:#eaa;"|36 |
| style="text-align:center; background:#eaa;"|36 |
||
|46 |
|||
|- |
|- |
||
|[[Sud-Est (development region)|Sud-Est]] |
|[[Sud-Est (development region)|Sud-Est]] |
||
| Line 97: | Line 136: | ||
|align=center|14,600 |
|align=center|14,600 |
||
|align=center|52 |
|align=center|52 |
||
|58 |
|||
|- |
|- |
||
|[[Sud (development region)|Sud - Muntenia]] |
|[[Sud (development region)|Sud - Muntenia]] |
||
| Line 109: | Line 149: | ||
|align=center|14,200 |
|align=center|14,200 |
||
|align=center|46 |
|align=center|46 |
||
|55 |
|||
|- |
|- |
||
|[[București-Ilfov (development region)|București - Ilfov]] |
|[[București-Ilfov (development region)|București - Ilfov]] |
||
| Line 121: | Line 162: | ||
| style="text-align:center; background:#ada;"|40,400 |
| style="text-align:center; background:#ada;"|40,400 |
||
| style="text-align:center; background:#ada;"|139 |
| style="text-align:center; background:#ada;"|139 |
||
|164 |
|||
|- |
|- |
||
|[[Sud-Vest (development region)|Sud-Vest Oltenia]] |
|[[Sud-Vest (development region)|Sud-Vest Oltenia]] |
||
| Line 133: | Line 175: | ||
|align=center|12,400 |
|align=center|12,400 |
||
|align=center|42 |
|align=center|42 |
||
|56 |
|||
|- |
|- |
||
|[[Vest (development region)|Vest]] |
|[[Vest (development region)|Vest]] |
||
| Line 145: | Line 188: | ||
|align=center|17,600 |
|align=center|17,600 |
||
|align=center|60 |
|align=center|60 |
||
|74 |
|||
|} |
|||
==HDI index== |
|||
[[File: NUTS 2 regions of Romania by HDI.svg |thumb|355x355px|Map of Romanian regions by HDI in 2021.<br /> |
|||
Legend: |
|||
{{legend|#00023aff|≥ 0.900}} |
|||
{{legend|#000074ff|0.820 – 0.900}} |
|||
{{legend|#4769ffff|0.800 – 0.819}} |
|||
{{legend|#aabdefff|0.750 - 0.799}}]] |
|||
'''List of [[NUTS statistical regions of Romania|NUTS2 statistical regions of Romania]] by [[Human Development Index]]''' as of 2021<ref>{{Cite web|title=Sub-national HDI - Area Database - Global Data Lab|url=https://globaldatalab.org/shdi/shdi/ROU/?levels=1%2B4&interpolation=1&extrapolation=0&nearest_real=0&years=2021|access-date=|website=hdi.globaldatalab.org|language=en}}</ref> |
|||
{| class="wikitable sortable" |
|||
|- |
|||
! Rank !! Region !! HDI (2021) |
|||
|- |
|||
! colspan="3" style="color:#090;" | Very high human development |
|||
|- |
|||
||1 |
|||
|[[București - Ilfov]]||0.926 |
|||
|- |
|||
|2 |
|||
|[[Nord-Vest (development region)|Nord-Vest]] |
|||
|0.832 |
|||
|- |
|||
||3 |
|||
|[[Vest (development region)|Vest]]||0.831 |
|||
|- style="background:#e6e6e6" |
|||
|'''-''' |
|||
|'''{{ROU}} (average)''' |
|||
|0.828 |
|||
|- |
|||
|4 |
|||
|[[Centru (development region)|Centru]] |
|||
|0.825 |
|||
|- |
|||
|5 |
|||
|[[Sud-Vest (development region)|Sud-Vest]] |
|||
|0.808 |
|||
|- |
|||
! colspan="3" style="color:#0c0;" | High human development |
|||
|- |
|||
|6 |
|||
|[[Sud-Est (development region)|Sud-Est]]||0.798 |
|||
|- |
|||
||7 |
|||
|[[Sud (development region)|Sud]]||0.795 |
|||
|- |
|||
|8 |
|||
|[[Nord-Est (development region)|Nord-Est]] |
|||
|0.792 |
|||
|} |
|} |
||
==See also== |
==See also== |
||
{{Politics of Romania}} |
|||
*[[Administrative divisions of Romania]] |
*[[Administrative divisions of Romania]] |
||
*[[Region (Europe)]] |
*[[Region (Europe)]] |
||
| Line 159: | Line 255: | ||
{{NUTS-RO}} |
{{NUTS-RO}} |
||
{{Subnational entities by Human Development Index}} |
|||
[[Category:Ranked lists of country subdivisions|Romania]] |
|||
[[Category:Economy of Romania-related lists|Human Development Index]] |
|||
[[Category:Economic regions]] |
|||
[[Category:Development regions of Romania| ]] |
[[Category:Development regions of Romania| ]] |
||
[[Category:Geography of Romania]] |
[[Category:Geography of Romania]] |
||
[[Category: |
[[Category:Lists of subdivisions of Romania]] |
||
Latest revision as of 15:00, 1 May 2024


The development regions of Romania (Romanian: Regiunile de dezvoltare ale României) refer to the eight regional divisions created in Romania in 1998 in order to better co-ordinate regional development as Romania progressed towards accession to the European Union (EU). The development regions correspond to NUTS 2-level divisions in EU member states. Despite becoming increasingly significant in regional development projects, Romania's development regions do not actually have an administrative status and do not have a legislative or executive council or government. Rather, they serve a function for allocating EU PHARE funds for regional development, as well as for collection of regional statistics. They also co-ordinate a range of regional development projects and became members of the Committee of the Regions when Romania joined the EU on January 1, 2007.
List[edit]
There are eight development regions in Romania, which (with the exception of București-Ilfov) are named by their geographical position in the country:
- RO1 – Macroregiunea Unu:
- RO2 – Macroregiunea Doi:
- RO3 – Macroregiunea Trei:
- Sud - Muntenia – RO31; 7 counties; 2,864,337 inhabitants; 34,489 km2 (13,316 sq mi)
- București - Ilfov – RO32; 1 county and Bucharest; 2,259,669 inhabitants; 1,811 km2 (699 sq mi)
- RO4 – Macroregiunea Patru:
- Sud-Vest Oltenia – RO41; 5 counties; 1,873,606 inhabitants; 29,212 km2 (11,279 sq mi)
- Vest – RO42; 4 counties; 1,668,921 inhabitants; 32,028 km2 (12,366 sq mi)
| No | Name | Code | Area, km2 | Population | Municipalities | Other cities | Communes | Villages |
|---|---|---|---|---|---|---|---|---|
| 1 | Nord-Est | RO21 | 36,850 | 3,226,436 | 17 | 29 | 506 | 2,414 |
| 2 | Sud-Est | RO22 | 35,762 | 2,367,987 | 11 | 24 | 355 | 1,448 |
| 3 | Sud - Muntenia | RO31 | 34,453 | 2,864,337 | 16 | 32 | 519 | 2,019 |
| 4 | Sud-Vest Oltenia | RO41 | 29,212 | 1,873,606 | 11 | 29 | 408 | 2,070 |
| 5 | Vest | RO42 | 32,034 | 1,688,921 | 12 | 30 | 281 | 1,327 |
| 6 | Nord-Vest | RO11 | 34,159 | 2,521,793 | 15 | 28 | 403 | 1,800 |
| 7 | Centru | RO12 | 34,100 | 2,271,066 | 20 | 37 | 357 | 1,788 |
| 8 | București - Ilfov | RO32 | 1,821 | 2,259,669 | 1 | 8 | 32 | 91 |
| Total | 238,391 | 19,053,815 | 103 | 217 | 2,861 | 12,957 | ||
Economy[edit]
| 2006 | 2016[1] | 2020 | |||||||||
|---|---|---|---|---|---|---|---|---|---|---|---|
| Region (NUTS-3) |
Total (million €) [2] |
€ per capita [3] |
PPP (million €) [4] |
PPP € per capita [5] |
% of EU average GDP (PPP) [6] |
Total (million €) |
€ per capita |
PPP (million €) in 2014[7] |
PPP € per capita |
% of EU average GDP (PPP) |
% of EU average GDP per capita[8] |
| Romania | 98,419 | 4,500 | 196,999 | 9,200 | 38 | 169,771 | 8,600 | 301,801 | 17,000 | 58 | 72 |
| Nord-Vest | 11,675 | 4,200 | 23,370 | 8,700 | 36 | 19,519 | 7,600 | 34,001 | 14,300 | 51 | 67 |
| Centru | 11,335 | 4,500 | 22,689 | 9,100 | 37 | 18,761 | 8,000 | 33,349 | 15,800 | 54 | 67 |
| Nord-Est | 10,787 | 2,900 | 21,591 | 5,900 | 24 | 17,081 | 5,300 | 30,912 | 10,400 | 36 | 46 |
| Sud-Est | 11,051 | 3,800 | 22,119 | 7,900 | 32 | 18,159 | 7,400 | 34,020 | 14,600 | 52 | 58 |
| Sud - Muntenia | 12,482 | 3,800 | 24,985 | 7,700 | 31 | 20,583 | 6,800 | 36,630 | 14,200 | 46 | 55 |
| București - Ilfov | 22,946 | 9,900 | 45,931 | 21,100 | 86 | 46 994 | 20,500 | 81,267 | 40,400 | 139 | 164 |
| Sud-Vest Oltenia | 8,138 | 3,600 | 16,290 | 7,200 | 29 | 12,451 | 6,300 | 22,677 | 12,400 | 42 | 56 |
| Vest | 9,940 | 5,300 | 19,897 | 10,500 | 43 | 16 081 | 8,900 | 28,698 | 17,600 | 60 | 74 |
HDI index[edit]

Legend:
List of NUTS2 statistical regions of Romania by Human Development Index as of 2021[9]
| Rank | Region | HDI (2021) |
|---|---|---|
| Very high human development | ||
| 1 | București - Ilfov | 0.926 |
| 2 | Nord-Vest | 0.832 |
| 3 | Vest | 0.831 |
| - | 0.828 | |
| 4 | Centru | 0.825 |
| 5 | Sud-Vest | 0.808 |
| High human development | ||
| 6 | Sud-Est | 0.798 |
| 7 | Sud | 0.795 |
| 8 | Nord-Est | 0.792 |
See also[edit]
 |
|---|
- Administrative divisions of Romania
- Region (Europe)
- Nomenclature of Territorial Units for Statistics
- Historical regions of Romania
References[edit]
- ^ "Statistics". ec.europa.eu. Retrieved 17 May 2019.
- ^ "Site3-TGM table". Epp.eurostat.ec.europa.eu. Retrieved 14 July 2009.
- ^ Eurostat (19 February 2009). "GDP per inhabitant in the EU in 2006" (PDF). Europa web portal. Retrieved 28 February 2016.
- ^ "Site3-TGM table". Epp.eurostat.ec.europa.eu. Retrieved 14 July 2009.
- ^ "Site3-TGM table". Epp.eurostat.ec.europa.eu. Retrieved 14 July 2009.
- ^ "Site3-TGM table". Epp.eurostat.ec.europa.eu. Retrieved 14 July 2009.
- ^ Eurostat (26 February 2016). "GDP per capita in the EU in 2014". Europa web portal. Retrieved 28 February 2016.
- ^ "Gross domestic product (GDP) at current market prices by NUTS 2 regions". European Commission. Retrieved 14 May 2023.
- ^ "Sub-national HDI - Area Database - Global Data Lab". hdi.globaldatalab.org.
| |||||||||||||||||||||||||||||