Woodmore, Maryland
Submit your own pictures of this place and show them to the world
- OSM Map
- General Map
- Google Map
- MSN Map
- OSM Map
- General Map
- Google Map
- MSN Map
- OSM Map
- General Map
- Google Map
- MSN Map
- OSM Map
- General Map
- Google Map
- MSN Map
Please wait while loading the map...
Population in 2010: 3,936.
Population change since 2000: -35.2%
| Males: 1,777 |  (45.2%) (45.2%) |
| Females: 2,159 |  (54.8%) (54.8%) |
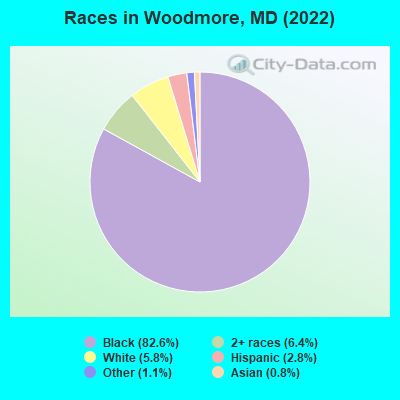
(6.0% for White Non-Hispanic residents, 1.0% for Black residents)
Business Search - 14 Million verified businesses
Data:
 Recent articles from our blog. Our writers, many of them Ph.D. graduates or candidates, create easy-to-read articles on a wide variety of topics.
Latest news from Woodmore, MD collected exclusively by city-data.com from local newspapers, TV, and radio stations
Ancestries: Nigerian (12.2%), Ghanaian (1.9%), African (1.8%), Guyanese (1.6%), American (1.1%), Kenyan (1.0%).
Current Local Time: EST time zone
Land area: 12.1 square miles.
Population density: 326 people per square mile (very low).
569 residents are foreign born (7.9% Africa, 2.9% Latin America).
| This place: | 13.1% |
| Maryland: | 15.7% |
Median real estate property taxes paid for housing units with mortgages in 2022: $6,080 (1.1%)
Median real estate property taxes paid for housing units with no mortgage in 2022: $6,571 (1.1%)
Nearest city with pop. 50,000+: Bowie, MD (2.7 miles  , pop. 50,269).
Nearest city with pop. 200,000+: Washington, DC (12.7 miles , pop. 572,059).
Nearest city with pop. 1,000,000+: Philadelphia, PA (114.1 miles , pop. 1,517,550).
Nearest cities:
Latitude: 38.93 N, Longitude: 76.78 W
Daytime population change due to commuting: -1,107 (-25.6%)
Workers who live and work in this place: 671 (27.3%)
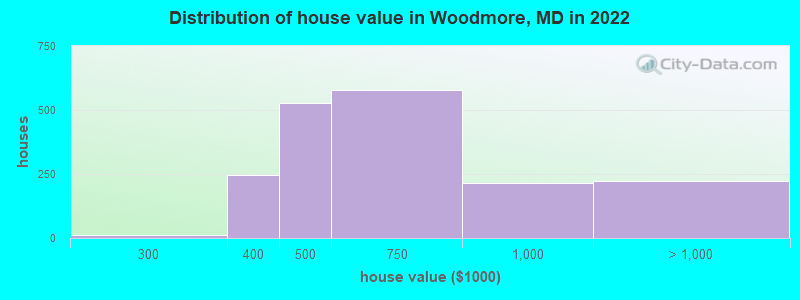
Property values in Woodmore, MD
Unemployment in December 2023:
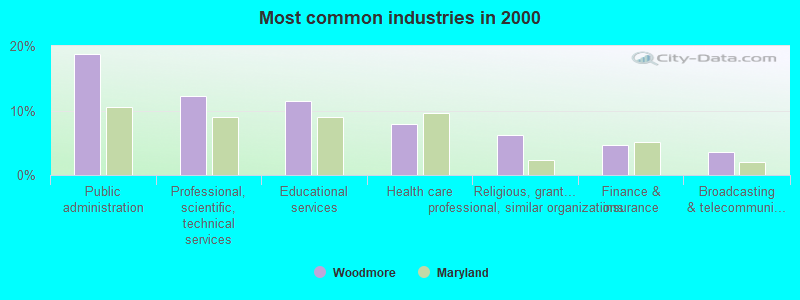
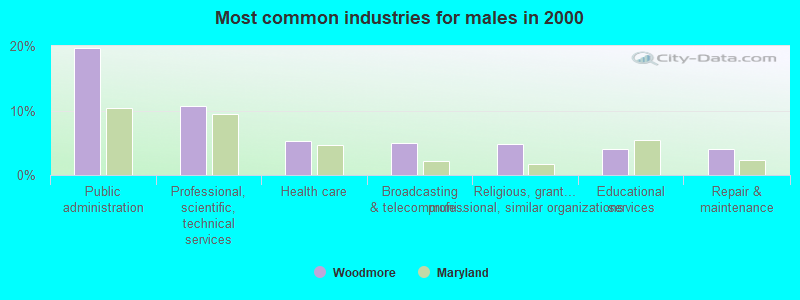
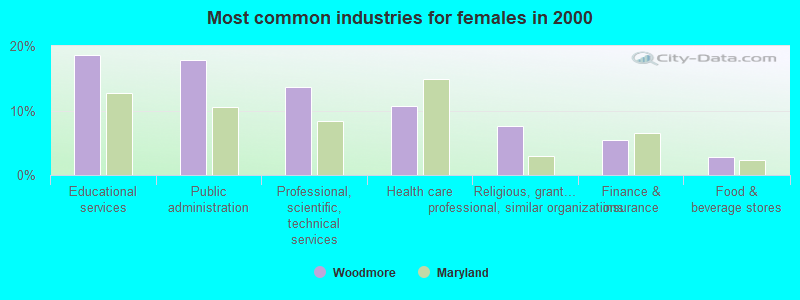
Most common industries in Woodmore, MD (%)
Both
Males
Females


- Public administration (18.7%)
- Professional, scientific, technical services (12.2%)
- Educational services (11.4%)
- Health care (7.9%)
- Religious, grantmaking, civic, professional, similar organizations (6.2%)
- Finance & insurance (4.6%)
- Broadcasting & telecommunications (3.5%)

- Public administration (19.7%)
- Professional, scientific, technical services (10.7%)
- Health care (5.2%)
- Broadcasting & telecommunications (5.0%)
- Religious, grantmaking, civic, professional, similar organizations (4.8%)
- Educational services (4.0%)
- Repair & maintenance (4.0%)

- Educational services (18.7%)
- Public administration (17.8%)
- Professional, scientific, technical services (13.6%)
- Health care (10.6%)
- Religious, grantmaking, civic, professional, similar organizations (7.6%)
- Finance & insurance (5.4%)
- Food & beverage stores (2.7%)
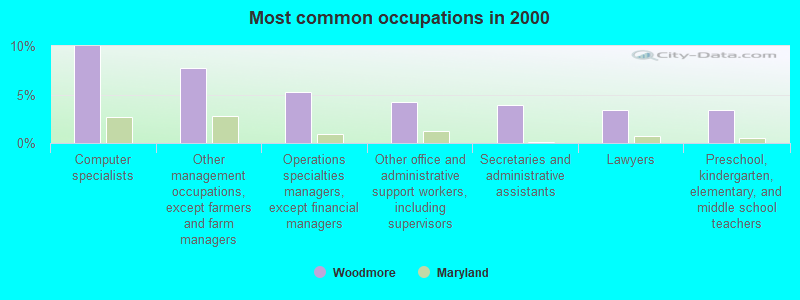
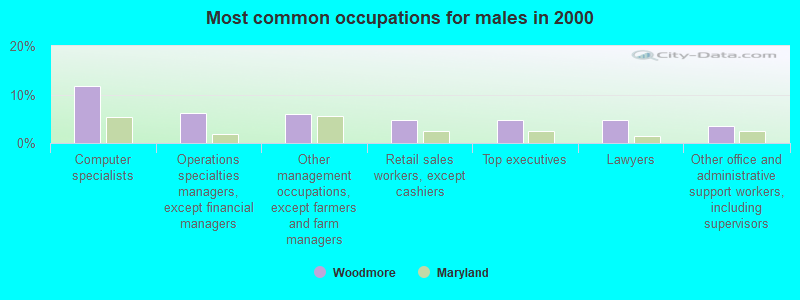
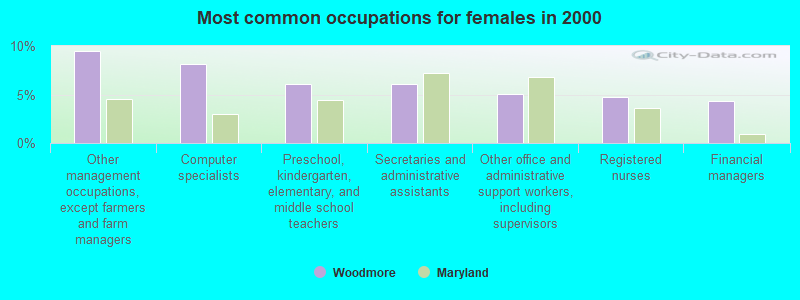
Most common occupations in Woodmore, MD (%)
Both
Males
Females

- Computer specialists (10.0%)
- Other management occupations, except farmers and farm managers (7.8%)
- Operations specialties managers, except financial managers (5.3%)
- Other office and administrative support workers, including supervisors (4.2%)
- Secretaries and administrative assistants (3.9%)
- Lawyers (3.4%)
- Preschool, kindergarten, elementary, and middle school teachers (3.4%)

- Computer specialists (11.8%)
- Operations specialties managers, except financial managers (6.2%)
- Other management occupations, except farmers and farm managers (6.1%)
- Retail sales workers, except cashiers (4.8%)
- Top executives (4.7%)
- Lawyers (4.7%)
- Other office and administrative support workers, including supervisors (3.4%)

- Other management occupations, except farmers and farm managers (9.5%)
- Computer specialists (8.2%)
- Preschool, kindergarten, elementary, and middle school teachers (6.1%)
- Secretaries and administrative assistants (6.0%)
- Other office and administrative support workers, including supervisors (5.0%)
- Registered nurses (4.8%)
- Financial managers (4.3%)
Tornado activity:
Woodmore-area historical tornado activity is slightly above Maryland state average. It is 9% greater than the overall U.S. average.
On 9/24/2001, a category F3 (max. wind speeds 158-206 mph) tornado 10.9 miles away from the Woodmore place center killed 2 people and injured 55 people and caused $101 million in damages.
On 4/28/2002, a category F4 (max. wind speeds 207-260 mph) tornado 34.3 miles away from the place center killed 3 people and injured 122 people and caused $124 million in damages.
Earthquake activity:
Woodmore-area historical earthquake activity is significantly above Maryland state average. It is 58% smaller than the overall U.S. average.
On 8/23/2011 at 17:51:04, a magnitude 5.8 (5.8 MW, Depth: 3.7 mi, Class: Moderate, Intensity: VI - VII) earthquake occurred 94.7 miles away from Woodmore center
On 1/16/1994 at 01:49:16, a magnitude 4.6 (4.6 MB, 4.6 LG, Depth: 3.1 mi, Class: Light, Intensity: IV - V) earthquake occurred 104.3 miles away from the city center
On 8/25/2011 at 05:07:52, a magnitude 4.5 (4.5 ML, Depth: 4.2 mi) earthquake occurred 93.9 miles away from Woodmore center
On 12/9/2003 at 20:59:18, a magnitude 4.5 (4.5 ML, Depth: 6.2 mi) earthquake occurred 107.6 miles away from the city center
On 12/9/2003 at 20:59:14, a magnitude 4.5 (4.5 MB, 4.5 LG) earthquake occurred 111.5 miles away from the city center
On 9/25/1998 at 19:52:52, a magnitude 5.2 (4.8 MB, 4.3 MS, 5.2 LG, 4.5 MW, Depth: 3.1 mi) earthquake occurred 260.3 miles away from Woodmore center
Magnitude types: regional Lg-wave magnitude (LG), body-wave magnitude (MB), local magnitude (ML), surface-wave magnitude (MS), moment magnitude (MW)
Natural disasters:
The number of natural disasters in Prince George's County (16) is near the US average (15).
Major Disasters (Presidential) Declared: 11
Emergencies Declared: 5
Causes of natural disasters: Hurricanes: 5, Winter Storms: 5, Snowstorms: 3, Floods: 2, Storms: 2, Tropical Storms: 2, Blizzard: 1, Heavy Rain: 1, Ice Storm: 1, Snowfall: 1 (Note: some incidents may be assigned to more than one category).
Hospitals and medical centers near Woodmore:
- HOLY CROSS DIALYSIS CENTER - WOODMORE (Dialysis Facility, about 2 miles away; MITCHELLVILLE, MD)
- LARKIN CHASE (Nursing Home, about 3 miles away; BOWIE, MD)
- VILLA ROSA NURSING HOME (Nursing Home, about 3 miles away; MITCHELLVILLE, MD)
- COLLINGTON EPISCOPAL LIFE CARE (Nursing Home, about 3 miles away; MITCHELLVILLE, MD)
- PROFESSIONAL HEALTHCARE (Home Health Center, about 4 miles away; LANHAM, MD)
- KIDNEY CARE OF LARGO (Dialysis Facility, about 4 miles away; LARGO, MD)
- DAVITA - LANDOVER (Dialysis Facility, about 4 miles away; LARGO, MD)
Amtrak stations near Woodmore:
- 5 miles: NEW CARROLLTON (4300 GARDEN CITY DR.) . Services: ticket office, fully wheelchair accessible, enclosed waiting area, public restrooms, public payphones, snack bar, ATM, paid short-term parking, paid long-term parking, call for car rental service, taxi stand, public transit connection.
- 13 miles: WASHINGTON (50 MASSACHUSETTS AVE. N.E.) . Services: ticket office, fully wheelchair accessible, enclosed waiting area, public restrooms, public payphones, full-service food facilities and snack bar, ATM, paid short-term parking, paid long-term parking, car rental agency, taxi stand, public transit connection.
- 18 miles: ALEXANDRIA (110 CALLAHAN DR.) . Services: ticket office, partially wheelchair accessible, enclosed waiting area, public restrooms, public payphones, vending machines, ATM, free short-term parking, free long-term parking, call for car rental service, call for taxi service, public transit connection.
Colleges/universities with over 2000 students nearest to Woodmore:
- Prince George's Community College (about 5 miles; Largo, MD; Full-time enrollment: 8,537)
- Bowie State University (about 6 miles; Bowie, MD; FT enrollment: 4,517)
- University of Maryland-College Park (about 10 miles; College Park, MD; FT enrollment: 32,734)
- University of Maryland-University College (about 11 miles; Adelphi, MD; FT enrollment: 25,040)
- Strayer University-Maryland (about 11 miles; Suitland, MD; FT enrollment: 2,748)
- Catholic University of America (about 12 miles; Washington, DC; FT enrollment: 5,365)
- Howard University (about 14 miles; Washington, DC; FT enrollment: 7,838)
Average household size:| This place: | 2.9 people |
| Maryland: | 2.6 people |
Percentage of family households:| This place: | 76.8% |
| Whole state: | 67.1% |
Percentage of households with unmarried partners:| This place: | 3.8% |
| Whole state: | 6.4% |
Likely homosexual households (counted as self-reported same-sex unmarried-partner households)
- Lesbian couples: 0.3% of all households
- Gay men: 0.3% of all households
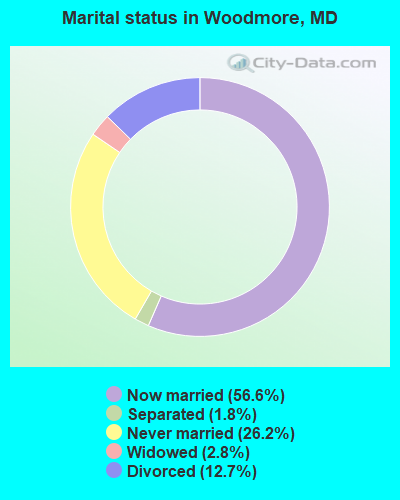
For population 15 years and over in Woodmore:
- Never married: 26.2%
- Now married: 56.6%
- Separated: 1.8%
- Widowed: 2.8%
- Divorced: 12.7%
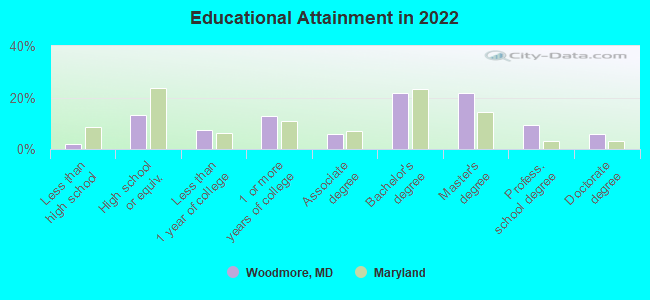
For population 25 years and over in Woodmore:
- High school or higher: 97.9%
- Bachelor's degree or higher: 56.7%
- Graduate or professional degree: 34.9%
- Unemployed: 3.5%
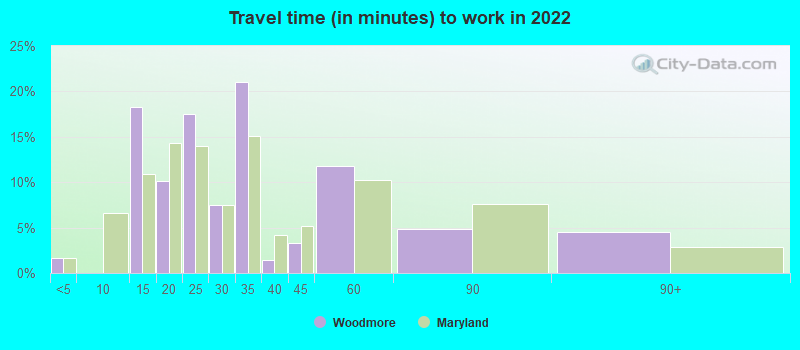
- Mean travel time to work (commute): 29.6 minutes
Education Gini index (Inequality in education)| Here: | 11.6 |
| Maryland average: | 12.7 |
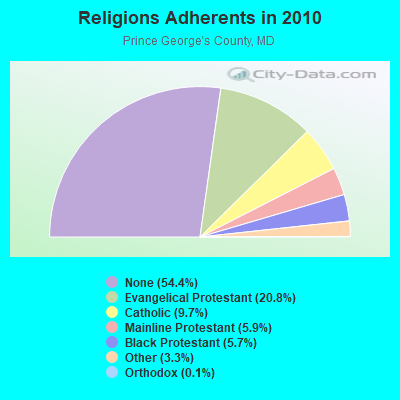
Religion statistics for Woodmore, MD (based on Prince George's County data)
| Religion | Adherents | Congregations |
|---|
| Evangelical Protestant | 179,374 | 430 |
| Catholic | 83,959 | 35 |
| Mainline Protestant | 51,153 | 156 |
| Black Protestant | 48,984 | 66 |
| Other | 28,743 | 57 |
| Orthodox | 1,218 | 6 |
| None | 469,989 | - |
Food Environment Statistics:
Number of grocery stores: 140| Here: | 1.70 / 10,000 pop. |
| State: | 1.96 / 10,000 pop. |
Number of supercenters and club stores: 2| Prince George's County: | 0.02 / 10,000 pop. |
| Maryland: | 0.07 / 10,000 pop. |
Number of convenience stores (no gas): 132| Prince George's County: | 1.60 / 10,000 pop. |
| State: | 1.22 / 10,000 pop. |
Number of convenience stores (with gas): 137| Prince George's County: | 1.66 / 10,000 pop. |
| State: | 2.05 / 10,000 pop. |
Number of full-service restaurants: 267| Prince George's County: | 3.24 / 10,000 pop. |
| Maryland: | 5.40 / 10,000 pop. |
Adult diabetes rate: | This county: | 10.5% |
| Maryland: | 9.1% |
Adult obesity rate: | Prince George's County: | 30.7% |
| State: | 26.7% |
Low-income preschool obesity rate: | This county: | 16.7% |
| Maryland: | 15.5% |
Health and Nutrition:
Healthy diet rate: | This city: | 54.4% |
| Maryland: | 50.1% |
Average overall health of teeth and gums: | Woodmore: | 55.2% |
| State: | 47.6% |
Average BMI: | Woodmore: | 29.3 |
| Maryland: | 28.8 |
People feeling badly about themselves: | Woodmore: | 17.6% |
| Maryland: | 20.0% |
People not drinking alcohol at all: | Woodmore: | 12.0% |
| Maryland: | 11.3% |
Average hours sleeping at night:
Overweight people: | Woodmore: | 37.8% |
| Maryland: | 34.1% |
General health condition:
Average condition of hearing: | Woodmore: | 85.5% |
| Maryland: | 80.5% |
More about Health and Nutrition of Woodmore, MD Residents
6.37% of this county's 2021 resident taxpayers lived in other counties in 2020 ($55,200 average adjusted gross income)
| Here: | 6.37% |
| Maryland average: | 7.42% |
0.04% of residents moved from foreign countries ($466 average AGI)| Prince George's County: | 0.04% |
| Maryland average: | 0.05% |
Top counties from which taxpayers relocated into this county between 2020 and 2021:
8.15% of this county's 2020 resident taxpayers moved to other counties in 2021 ($59,145 average adjusted gross income)
| Here: | 8.15% |
| Maryland average: | 7.91% |
0.05% of residents moved to foreign countries ($401 average AGI)| Prince George's County: | 0.05% |
| Maryland average: | 0.04% |
Top counties to which taxpayers relocated from this county between 2020 and 2021:
Strongest AM radio stations in Woodmore:
- WPGC (1580 AM; 50 kW; MORNINGSIDE, MD; Owner: INFINITY WPGC(AM), INC.)
- WTEM (980 AM; 50 kW; WASHINGTON, DC; Owner: AMFM RADIO LICENSES, L.L.C.)
- WBIS (1190 AM; 50 kW; ANNAPOLIS, MD; Owner: NATIONS RADIO, LLC)
- WTOP (1500 AM; 50 kW; WASHINGTON, DC; Owner: BONNEVILLE HOLDING COMPANY)
- WCBM (680 AM; 50 kW; BALTIMORE, MD; Owner: WCBM MARYLAND, INC.)
- WWGB (1030 AM; daytime; 50 kW; INDIAN HEAD, MD; Owner: GOOD BODY MEDIA, LLC)
- WMET (1150 AM; 50 kW; GAITHERSBURG, MD; Owner: BELTWAY ACQUISITION CORPORATION)
- WBAL (1090 AM; 50 kW; BALTIMORE, MD; Owner: HEARST RADIO, INC.)
- WWLG (1370 AM; 50 kW; BALTIMORE, MD; Owner: M-10 BROADCASTING, INC.)
- WUST (1120 AM; daytime; 20 kW; WASHINGTON, DC)
- WGOP (700 AM; daytime; 25 kW; WALKERSVILLE, MD; Owner: BIRACH BROADCASTING CORPORATION)
- WKDL (730 AM; 8 kW; ALEXANDRIA, VA; Owner: MEGA COMMUNICATIONS OF ALEXANDRIA LICENSEE, LLC)
- WMAL (630 AM; 5 kW; WASHINGTON, DC; Owner: WMAL, INC.)
Strongest FM radio stations in Woodmore:
- WFSI (107.9 FM; ANNAPOLIS, MD; Owner: FAMILY STATIONS, INC.)
- WPGC-FM (95.5 FM; MORNINGSIDE, MD; Owner: INFINITY BROADCASTING CORPORATION OF MARYLAND)
- WHFS (99.1 FM; ANNAPOLIS, MD; Owner: INFINITY BROADCASTING OPERATIONS, INC.)
- WBIG-FM (100.3 FM; WASHINGTON, DC; Owner: AMFM RADIO LICENSES, L.L.C.)
- WRQX (107.3 FM; WASHINGTON, DC; Owner: WMAL, INC.)
- WWDC-FM (101.1 FM; WASHINGTON, DC; Owner: AMFM RADIO LICENSES, L.L.C.)
- WHUR-FM (96.3 FM; WASHINGTON, DC; Owner: THE HOWARD UNIVERSITY)
- WASH (97.1 FM; WASHINGTON, DC; Owner: AMFM RADIO LICENSES, L.L.C.)
- WCSP-FM (90.1 FM; WASHINGTON, DC; Owner: NATIONAL CABLE SATELLITE CORPORATION)
- WKYS (93.9 FM; WASHINGTON, DC; Owner: RADIO ONE LICENSES, LLC)
- WARW (94.7 FM; BETHESDA, MD; Owner: INFINITY BROADCASTING OPERATIONS, INC.)
- WIHT (99.5 FM; WASHINGTON, DC; Owner: AMFM RADIO LICENSES, L.L.C.)
- WWMX (106.5 FM; BALTIMORE, MD; Owner: INFINITY RADIO OPERATIONS INC.)
- WWZZ (104.1 FM; WALDORF, MD; Owner: BONNEVILLE HOLDING COMPANY)
- WPOC (93.1 FM; BALTIMORE, MD; Owner: CITICASTERS LICENSES, L.P.)
- WGMS-FM (103.5 FM; WASHINGTON, DC; Owner: BONNEVILLE HOLDING COMPANY)
- WETA (90.9 FM; WASHINGTON, DC; Owner: GREATER WASHINGTON EDUCATIONAL TELECOMMUNICATIONS ASSN.)
- WGTS (91.9 FM; TAKOMA PARK, MD; Owner: COLUMBIA UNION COLLEGE BROADCASTING, INC.)
- WAMU (88.5 FM; WASHINGTON, DC; Owner: THE EXEC. COMM. OF THE BD. OF TRUSTEES OF AMERICAN UNIV.)
- WMMJ (102.3 FM; BETHESDA, MD; Owner: RADIO ONE LICENSES, LLC)
TV broadcast stations around Woodmore:
- WMPT (Channel 22; ANNAPOLIS, MD; Owner: MARYLAND PUBLIC BROADCASTING COMMISSION)
- WBDC-TV (Channel 50; WASHINGTON, DC; Owner: WBDC BROADCASTING, INC.)
- WJLA-TV (Channel 7; WASHINGTON, DC; Owner: ACC LICENSEE, INC.)
- WUSA (Channel 9; WASHINGTON, DC; Owner: THE DETROIT NEWS, INC.)
- WTTG (Channel 5; WASHINGTON, DC; Owner: FOX TELEVISION STATIONS, INC.)
- WHUT-TV (Channel 32; WASHINGTON, DC; Owner: HOWARD UNIVERSITY)
- WETA-TV (Channel 26; WASHINGTON, DC; Owner: THE GREATER WASHINGTON ED TELECOMM. ASSOC)
- WDCA (Channel 20; WASHINGTON, DC; Owner: FOX TELEVISION STATIONS, INC.)
- WRC-TV (Channel 4; WASHINGTON, DC; Owner: NBC SUBSIDIARY (WRC-TV), INC.)
- WBAL-TV (Channel 11; BALTIMORE, MD; Owner: WBAL HEARST-ARGYLE TV, INC. (CA CORP.))
- WMAR-TV (Channel 2; BALTIMORE, MD; Owner: SCRIPPS HOWARD BROADCASTING COMPANY)
- WBFF (Channel 45; BALTIMORE, MD; Owner: CHESAPEAKE TELEVISION LICENSEE, LLC)
- WNUV (Channel 54; BALTIMORE, MD; Owner: BALTIMORE (WNUV-TV) LICENSEE, INC.)
- WUTB (Channel 24; BALTIMORE, MD; Owner: FOX TELEVISION STATIONS, INC.)
- W63BP (Channel 63; ANNAPOLIS, MD; Owner: ANNAPOLIS BROADCASTING COMPANY, INC.)
- WIAV-LP (Channel 58; WASHINGTON, DC; Owner: ASIAVISION, INC.)
- WZDC-LP (Channel 64; WASHINGTON, DC; Owner: ONDA CAPITAL, INC.)
- WJZ-TV (Channel 13; BALTIMORE, MD; Owner: VIACOM INC.)
- W61BY (Channel 61; ANNAPOLIS, MD; Owner: ANNAPOLIS BROADCASTING COMPANY, INC.)
- W28BY (Channel 63; BALTIMORE, MD; Owner: INFORMATION SUPER STATION, L.L.C.)
- WMPB (Channel 67; BALTIMORE, MD; Owner: MARYLAND PUBLIC BROADCASTING COMMISSION)
- WNVC (Channel 56; FAIRFAX, VA; Owner: COMMONWEALTH PUBLIC BROADCASTING CORPORATION)
- WMDO-CA (Channel 30; WASHINGTON, DC; Owner: ENTRAVISION HOLDINGS, LLC)
- WKRP-LP (Channel 42; WASHINGTON, DC; Owner: CAPITAL MEDIA, LLC)
- National Bridge Inventory (NBI) Statistics
- 6Number of bridges
- 52ft / 15.5mTotal length
- $714,000Total costs
- 253,303Total average daily traffic
- 18,634Total average daily truck traffic
FCC Registered Microwave Towers:
2
- WDC4503, 13710 Central Ave. (Lat: 38.909944 Lon: -76.771833), Type: Pole, Structure height: 47.5 m, Call Sign: WQLX669, Licensee ID: L01728370,
Assigned Frequencies: 10875.0 MHz, Grant Date: 05/20/2010, Expiration Date: 05/20/2020, Cancellation Date: 09/09/2013, Certifier: Joseph M Sandri Jr., Registrant: Fibertower Network Services, Corp., Debtor-In-Possession, 1875 Eye Street, Nw, 5th Floor, Room 505, Washington, DC 20006, Phone: (202) 223-1028, Email:
- DC03XC152, 3900 Church Rd. (Lat: 38.943639 Lon: -76.776694), Type: Upole, Structure height: 38.4 m, Call Sign: WQPV247,
Assigned Frequencies: 10895.0 MHz, 10935.0 MHz, 10895.0 MHz, 10935.0 MHz, 10895.0 MHz, 10935.0 MHz, Grant Date: 08/22/2012, Expiration Date: 08/22/2022, Cancellation Date: 07/14/2015, Certifier: Kyle B Entz, Registrant: Sprint Corporation, 12502 Sunrise Valley Drive, M/S: Varesa0209, Reston, VA 20196, Phone: (703) 433-4000, Fax: (703) 433-4483
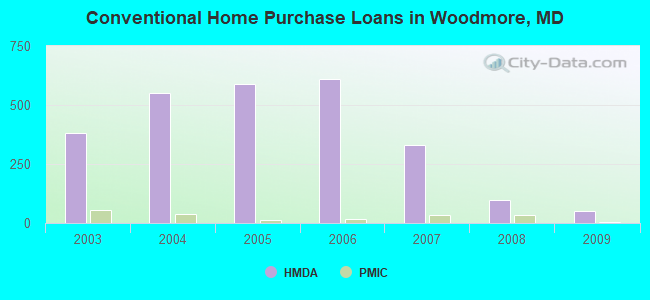
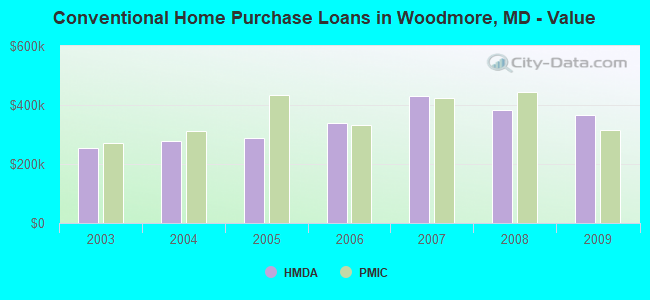
Home Mortgage Disclosure Act Aggregated Statistics For Year 2009
(Based on 2 partial tracts)
|
| A) FHA, FSA/RHS & VA
Home Purchase Loans | B) Conventional
Home Purchase Loans | C) Refinancings
| D) Home Improvement Loans
| F) Non-occupant Loans on
< 5 Family Dwellings (A B C & D) | G) Loans On Manufactured
Home Dwelling (A B C & D) |
|---|
| Number | Average Value | Number | Average Value | Number | Average Value | Number | Average Value | Number | Average Value | Number | Average Value |
|---|
| LOANS ORIGINATED | 174 | $384,563 | 52 | $367,772 | 386 | $318,267 | 15 | $64,760 | 13 | $280,342 | 0 | $0 |
| APPLICATIONS APPROVED, NOT ACCEPTED | 8 | $420,115 | 7 | $396,941 | 42 | $343,612 | 3 | $12,550 | 1 | $125,760 | 0 | $0 |
| APPLICATIONS DENIED | 41 | $406,457 | 15 | $349,897 | 207 | $393,886 | 18 | $76,647 | 5 | $275,296 | 1 | $6,020 |
| APPLICATIONS WITHDRAWN | 37 | $385,418 | 14 | $515,390 | 141 | $387,457 | 8 | $206,098 | 4 | $332,550 | 1 | $314,390 |
| FILES CLOSED FOR INCOMPLETENESS | 6 | $371,610 | 8 | $479,221 | 42 | $363,876 | 4 | $142,848 | 4 | $277,288 | 0 | $0 |
Aggregated Statistics For Year 2008
(Based on 2 partial tracts)
|
| A) FHA, FSA/RHS & VA
Home Purchase Loans | B) Conventional
Home Purchase Loans | C) Refinancings
| D) Home Improvement Loans
| F) Non-occupant Loans on
< 5 Family Dwellings (A B C & D) | G) Loans On Manufactured
Home Dwelling (A B C & D) |
|---|
| Number | Average Value | Number | Average Value | Number | Average Value | Number | Average Value | Number | Average Value | Number | Average Value |
|---|
| LOANS ORIGINATED | 98 | $431,408 | 99 | $382,122 | 273 | $350,103 | 34 | $67,749 | 16 | $245,801 | 1 | $22,340 |
| APPLICATIONS APPROVED, NOT ACCEPTED | 13 | $466,137 | 22 | $391,372 | 43 | $387,919 | 6 | $108,347 | 2 | $202,050 | 0 | $0 |
| APPLICATIONS DENIED | 26 | $507,718 | 39 | $501,548 | 268 | $417,386 | 43 | $139,300 | 11 | $324,817 | 0 | $0 |
| APPLICATIONS WITHDRAWN | 15 | $497,961 | 54 | $438,881 | 144 | $406,237 | 10 | $113,369 | 4 | $284,218 | 0 | $0 |
| FILES CLOSED FOR INCOMPLETENESS | 5 | $423,234 | 7 | $428,829 | 29 | $459,436 | 2 | $139,175 | 2 | $349,140 | 0 | $0 |
Aggregated Statistics For Year 2007
(Based on 2 partial tracts)
|
| A) FHA, FSA/RHS & VA
Home Purchase Loans | B) Conventional
Home Purchase Loans | C) Refinancings
| D) Home Improvement Loans
| E) Loans on Dwellings For 5+ Families
| F) Non-occupant Loans on
< 5 Family Dwellings (A B C & D) | G) Loans On Manufactured
Home Dwelling (A B C & D) |
|---|
| Number | Average Value | Number | Average Value | Number | Average Value | Number | Average Value | Number | Average Value | Number | Average Value | Number | Average Value |
|---|
| LOANS ORIGINATED | 6 | $332,373 | 332 | $431,997 | 588 | $371,786 | 84 | $191,633 | 2 | $4,725 | 22 | $293,149 | 0 | $0 |
| APPLICATIONS APPROVED, NOT ACCEPTED | 0 | $0 | 76 | $374,816 | 167 | $370,176 | 16 | $188,386 | 0 | $0 | 6 | $305,333 | 0 | $0 |
| APPLICATIONS DENIED | 2 | $296,855 | 206 | $438,733 | 523 | $470,056 | 74 | $175,502 | 0 | $0 | 17 | $362,485 | 2 | $56,155 |
| APPLICATIONS WITHDRAWN | 0 | $0 | 98 | $440,709 | 226 | $414,868 | 19 | $361,917 | 0 | $0 | 6 | $218,087 | 0 | $0 |
| FILES CLOSED FOR INCOMPLETENESS | 0 | $0 | 24 | $473,839 | 92 | $455,476 | 8 | $321,365 | 0 | $0 | 5 | $406,544 | 0 | $0 |
Aggregated Statistics For Year 2006
(Based on 2 partial tracts)
|
| A) FHA, FSA/RHS & VA
Home Purchase Loans | B) Conventional
Home Purchase Loans | C) Refinancings
| D) Home Improvement Loans
| F) Non-occupant Loans on
< 5 Family Dwellings (A B C & D) | G) Loans On Manufactured
Home Dwelling (A B C & D) |
|---|
| Number | Average Value | Number | Average Value | Number | Average Value | Number | Average Value | Number | Average Value | Number | Average Value |
|---|
| LOANS ORIGINATED | 5 | $306,566 | 610 | $338,842 | 836 | $367,786 | 99 | $169,651 | 41 | $295,952 | 0 | $0 |
| APPLICATIONS APPROVED, NOT ACCEPTED | 0 | $0 | 66 | $373,764 | 134 | $338,989 | 24 | $146,057 | 10 | $246,578 | 0 | $0 |
| APPLICATIONS DENIED | 0 | $0 | 214 | $359,372 | 434 | $412,724 | 88 | $223,658 | 23 | $370,044 | 1 | $38,340 |
| APPLICATIONS WITHDRAWN | 1 | $262,250 | 112 | $397,135 | 305 | $404,119 | 23 | $364,379 | 16 | $306,147 | 0 | $0 |
| FILES CLOSED FOR INCOMPLETENESS | 1 | $260,710 | 27 | $338,703 | 69 | $355,021 | 7 | $134,256 | 2 | $525,040 | 0 | $0 |
Aggregated Statistics For Year 2005
(Based on 2 partial tracts)
|
| A) FHA, FSA/RHS & VA
Home Purchase Loans | B) Conventional
Home Purchase Loans | C) Refinancings
| D) Home Improvement Loans
| F) Non-occupant Loans on
< 5 Family Dwellings (A B C & D) | G) Loans On Manufactured
Home Dwelling (A B C & D) |
|---|
| Number | Average Value | Number | Average Value | Number | Average Value | Number | Average Value | Number | Average Value | Number | Average Value |
|---|
| LOANS ORIGINATED | 2 | $331,640 | 591 | $289,059 | 1,063 | $324,116 | 107 | $196,315 | 65 | $252,502 | 2 | $26,650 |
| APPLICATIONS APPROVED, NOT ACCEPTED | 0 | $0 | 80 | $320,331 | 133 | $320,628 | 14 | $96,289 | 7 | $298,913 | 1 | $47,540 |
| APPLICATIONS DENIED | 1 | $197,830 | 148 | $350,863 | 383 | $370,455 | 62 | $180,016 | 10 | $448,779 | 0 | $0 |
| APPLICATIONS WITHDRAWN | 1 | $108,120 | 111 | $292,659 | 353 | $337,652 | 22 | $255,381 | 13 | $245,681 | 0 | $0 |
| FILES CLOSED FOR INCOMPLETENESS | 0 | $0 | 24 | $338,533 | 94 | $374,906 | 4 | $249,020 | 2 | $202,660 | 0 | $0 |
Aggregated Statistics For Year 2004
(Based on 2 partial tracts)
|
| A) FHA, FSA/RHS & VA
Home Purchase Loans | B) Conventional
Home Purchase Loans | C) Refinancings
| D) Home Improvement Loans
| F) Non-occupant Loans on
< 5 Family Dwellings (A B C & D) | G) Loans On Manufactured
Home Dwelling (A B C & D) |
|---|
| Number | Average Value | Number | Average Value | Number | Average Value | Number | Average Value | Number | Average Value | Number | Average Value |
|---|
| LOANS ORIGINATED | 17 | $246,919 | 549 | $277,026 | 881 | $277,690 | 81 | $130,020 | 39 | $209,884 | 0 | $0 |
| APPLICATIONS APPROVED, NOT ACCEPTED | 0 | $0 | 69 | $274,388 | 149 | $302,368 | 13 | $94,222 | 2 | $907,420 | 0 | $0 |
| APPLICATIONS DENIED | 2 | $150,555 | 98 | $303,822 | 377 | $298,281 | 47 | $128,792 | 6 | $188,728 | 1 | $97,960 |
| APPLICATIONS WITHDRAWN | 2 | $155,275 | 79 | $271,964 | 290 | $275,269 | 17 | $127,646 | 7 | $186,670 | 0 | $0 |
| FILES CLOSED FOR INCOMPLETENESS | 0 | $0 | 17 | $334,519 | 69 | $301,922 | 5 | $175,346 | 0 | $0 | 0 | $0 |
Aggregated Statistics For Year 2003
(Based on 2 partial tracts)
|
| A) FHA, FSA/RHS & VA
Home Purchase Loans | B) Conventional
Home Purchase Loans | C) Refinancings
| D) Home Improvement Loans
| F) Non-occupant Loans on
< 5 Family Dwellings (A B C & D) |
|---|
| Number | Average Value | Number | Average Value | Number | Average Value | Number | Average Value | Number | Average Value |
|---|
| LOANS ORIGINATED | 22 | $212,625 | 382 | $253,638 | 1,402 | $219,972 | 50 | $36,572 | 26 | $154,683 |
| APPLICATIONS APPROVED, NOT ACCEPTED | 2 | $187,185 | 58 | $206,962 | 238 | $234,618 | 18 | $18,435 | 5 | $168,866 |
| APPLICATIONS DENIED | 2 | $238,320 | 75 | $338,472 | 382 | $244,010 | 38 | $59,184 | 11 | $256,323 |
| APPLICATIONS WITHDRAWN | 6 | $178,208 | 48 | $261,623 | 302 | $245,251 | 0 | $0 | 6 | $253,563 |
| FILES CLOSED FOR INCOMPLETENESS | 2 | $132,655 | 18 | $322,664 | 67 | $252,294 | 3 | $98,820 | 1 | $85,880 |
Detailed HMDA statistics for the following Tracts:
8005.03
, 8005.08
Private Mortgage Insurance Companies Aggregated Statistics For Year 2009
(Based on 2 partial tracts)
|
| A) Conventional
Home Purchase Loans | B) Refinancings
|
|---|
| Number | Average Value | Number | Average Value |
|---|
| LOANS ORIGINATED | 6 | $316,143 | 6 | $380,055 |
| APPLICATIONS APPROVED, NOT ACCEPTED | 2 | $447,810 | 5 | $437,434 |
| APPLICATIONS DENIED | 1 | $256,070 | 2 | $498,395 |
| APPLICATIONS WITHDRAWN | 1 | $286,780 | 2 | $384,535 |
| FILES CLOSED FOR INCOMPLETENESS | 1 | $509,560 | 2 | $420,625 |
Aggregated Statistics For Year 2008
(Based on 2 partial tracts)
|
| A) Conventional
Home Purchase Loans | B) Refinancings
| C) Non-occupant Loans on
< 5 Family Dwellings (A & B) |
|---|
| Number | Average Value | Number | Average Value | Number | Average Value |
|---|
| LOANS ORIGINATED | 32 | $445,656 | 16 | $395,933 | 2 | $180,965 |
| APPLICATIONS APPROVED, NOT ACCEPTED | 20 | $434,285 | 14 | $454,551 | 2 | $277,965 |
| APPLICATIONS DENIED | 6 | $431,742 | 7 | $501,450 | 1 | $310,210 |
| APPLICATIONS WITHDRAWN | 0 | $0 | 2 | $596,955 | 0 | $0 |
| FILES CLOSED FOR INCOMPLETENESS | 2 | $575,830 | 1 | $737,660 | 0 | $0 |
Aggregated Statistics For Year 2007
(Based on 2 partial tracts)
|
| A) Conventional
Home Purchase Loans | B) Refinancings
| C) Non-occupant Loans on
< 5 Family Dwellings (A & B) |
|---|
| Number | Average Value | Number | Average Value | Number | Average Value |
|---|
| LOANS ORIGINATED | 35 | $423,747 | 35 | $454,513 | 1 | $143,390 |
| APPLICATIONS APPROVED, NOT ACCEPTED | 11 | $530,865 | 13 | $466,237 | 1 | $263,780 |
| APPLICATIONS DENIED | 2 | $886,535 | 0 | $0 | 2 | $712,525 |
| APPLICATIONS WITHDRAWN | 6 | $643,652 | 5 | $519,864 | 0 | $0 |
| FILES CLOSED FOR INCOMPLETENESS | 2 | $687,545 | 1 | $369,600 | 0 | $0 |
Aggregated Statistics For Year 2006
(Based on 2 partial tracts)
|
| A) Conventional
Home Purchase Loans | B) Refinancings
| C) Non-occupant Loans on
< 5 Family Dwellings (A & B) |
|---|
| Number | Average Value | Number | Average Value | Number | Average Value |
|---|
| LOANS ORIGINATED | 17 | $333,772 | 23 | $429,060 | 1 | $269,150 |
| APPLICATIONS APPROVED, NOT ACCEPTED | 7 | $485,420 | 6 | $378,200 | 1 | $319,760 |
| APPLICATIONS DENIED | 0 | $0 | 0 | $0 | 0 | $0 |
| APPLICATIONS WITHDRAWN | 1 | $429,650 | 1 | $319,760 | 1 | $429,650 |
| FILES CLOSED FOR INCOMPLETENESS | 0 | $0 | 0 | $0 | 0 | $0 |
Aggregated Statistics For Year 2005
(Based on 2 partial tracts)
|
| A) Conventional
Home Purchase Loans | B) Refinancings
| C) Non-occupant Loans on
< 5 Family Dwellings (A & B) |
|---|
| Number | Average Value | Number | Average Value | Number | Average Value |
|---|
| LOANS ORIGINATED | 13 | $432,379 | 19 | $390,285 | 1 | $227,740 |
| APPLICATIONS APPROVED, NOT ACCEPTED | 2 | $525,060 | 8 | $413,416 | 1 | $126,520 |
| APPLICATIONS DENIED | 2 | $333,295 | 0 | $0 | 1 | $429,650 |
| APPLICATIONS WITHDRAWN | 1 | $620,340 | 2 | $440,930 | 0 | $0 |
| FILES CLOSED FOR INCOMPLETENESS | 1 | $644,480 | 1 | $269,820 | 0 | $0 |
Aggregated Statistics For Year 2004
(Based on 2 partial tracts)
|
| A) Conventional
Home Purchase Loans | B) Refinancings
| C) Non-occupant Loans on
< 5 Family Dwellings (A & B) |
|---|
| Number | Average Value | Number | Average Value | Number | Average Value |
|---|
| LOANS ORIGINATED | 37 | $312,504 | 38 | $305,403 | 2 | $279,500 |
| APPLICATIONS APPROVED, NOT ACCEPTED | 7 | $343,327 | 13 | $291,659 | 2 | $201,695 |
| APPLICATIONS DENIED | 1 | $476,950 | 3 | $648,770 | 0 | $0 |
| APPLICATIONS WITHDRAWN | 2 | $280,265 | 4 | $237,955 | 0 | $0 |
| FILES CLOSED FOR INCOMPLETENESS | 0 | $0 | 0 | $0 | 0 | $0 |
Aggregated Statistics For Year 2003
(Based on 2 partial tracts)
|
| A) Conventional
Home Purchase Loans | B) Refinancings
| C) Non-occupant Loans on
< 5 Family Dwellings (A & B) |
|---|
| Number | Average Value | Number | Average Value | Number | Average Value |
|---|
| LOANS ORIGINATED | 53 | $271,461 | 88 | $265,365 | 0 | $0 |
| APPLICATIONS APPROVED, NOT ACCEPTED | 7 | $341,001 | 17 | $272,392 | 1 | $355,750 |
| APPLICATIONS DENIED | 4 | $480,448 | 1 | $219,120 | 1 | $476,950 |
| APPLICATIONS WITHDRAWN | 3 | $305,080 | 11 | $256,440 | 0 | $0 |
| FILES CLOSED FOR INCOMPLETENESS | 0 | $0 | 0 | $0 | 0 | $0 |
Detailed PMIC statistics for the following Tracts:
8005.03
, 8005.08
Woodmore compared to Maryland state average:
- Median household income above state average.
- Unemployed percentage significantly below state average.
- Black race population percentage above state average.
- Hispanic race population percentage significantly below state average.
- Median age significantly above state average.
- Foreign-born population percentage below state average.
- Renting percentage significantly below state average.
- Length of stay since moving in significantly above state average.
- Number of rooms per house significantly above state average.
- House age below state average.
- Percentage of population with a bachelor's degree or higher above state average.
- #26 on the list of "Top 101 cities with the most residents born in Other Northern America (population 500+)"
- #46 on the list of "Top 101 cities with the most residents born in Ghana (population 500+)"
- #52 (20721) on the list of "Top 101 zip codes with the largest percentage of taxpayers using charity contributions deductions in 2012 (pop 5,000+)"
- #87 (20721) on the list of "Top 101 zip codes with the largest percentage of Subsaharan African first ancestries"
- #100 (20721) on the list of "Top 101 zip codes with the largest charity contributions deductions as a percentage of AGI in 2012 (pop 5,000+)"
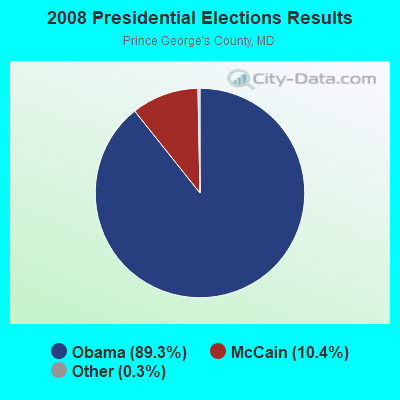
- #5 on the list of "Top 101 counties with highest percentage of residents voting for Obama (Democrat) in the 2012 Presidential Election"
- #12 on the list of "Top 101 counties with the highest number of infant deaths per 1000 residents 2007-2013 (pop. 50,000+)"
- #13 on the list of "Top 101 counties with the highest average weight of females"
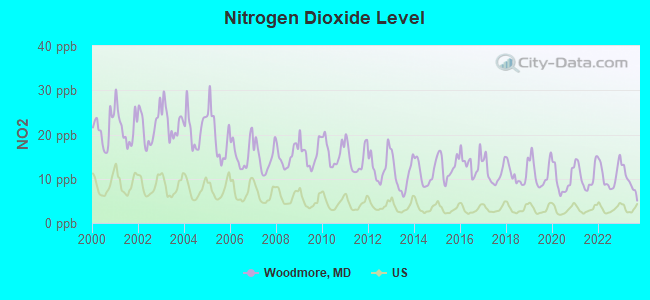
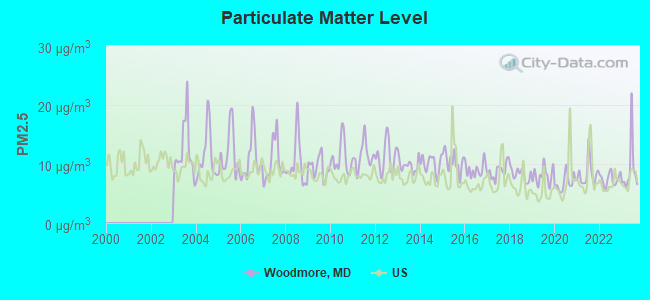
- #14 on the list of "Top 101 counties with the highest Nitrogen Dioxide air pollution readings in 2012 (ppm)"
- #14 on the list of "Top 101 counties with the most Black Protestant adherents"