Westmont, Pennsylvania
Submit your own pictures of this borough and show them to the world
- OSM Map
- General Map
- Google Map
- MSN Map
- OSM Map
- General Map
- Google Map
- MSN Map
- OSM Map
- General Map
- Google Map
- MSN Map
- OSM Map
- General Map
- Google Map
- MSN Map
Please wait while loading the map...
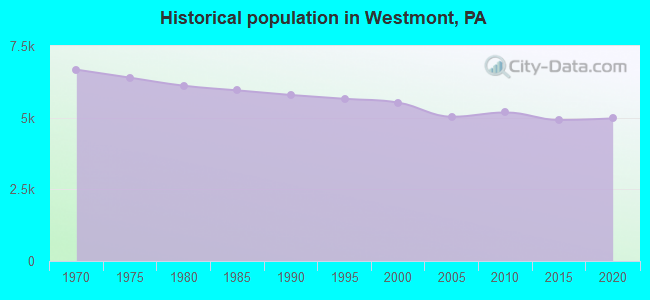
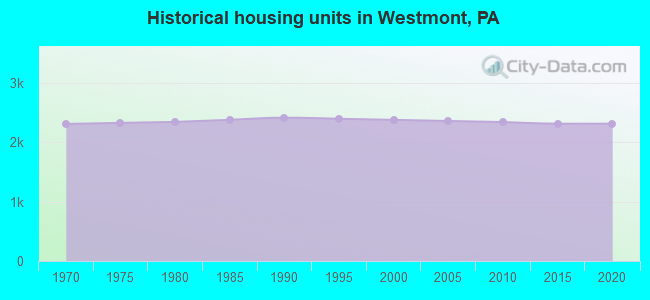
Population in 2022: 4,901 (100% urban, 0% rural).
Population change since 2000: -11.3%
| Males: 2,358 |  (48.1%) (48.1%) |
| Females: 2,543 |  (51.9%) (51.9%) |
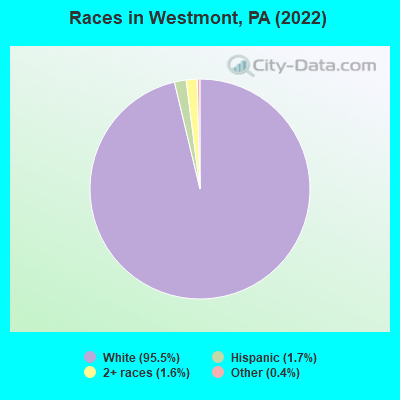
(12.2% for White Non-Hispanic residents, 100.0% for Black residents)
Business Search - 14 Million verified businesses
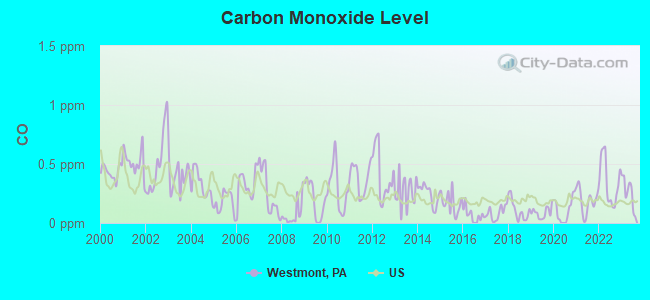
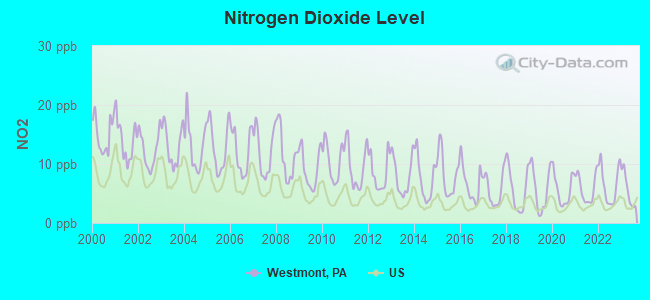
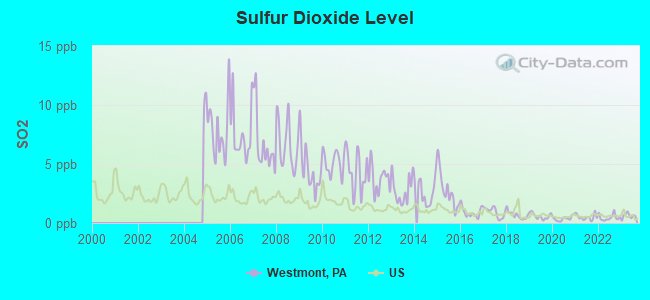
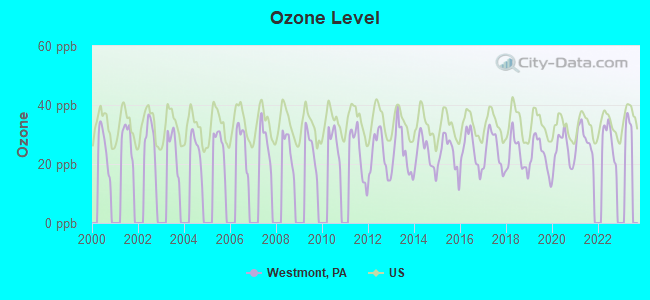
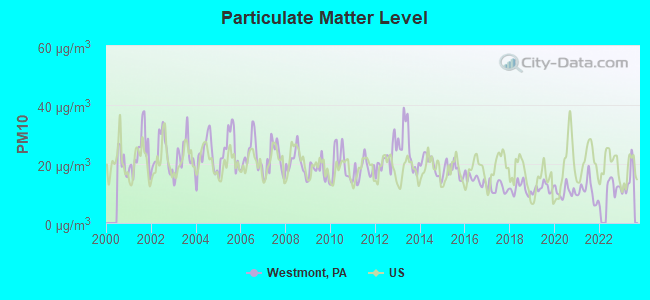
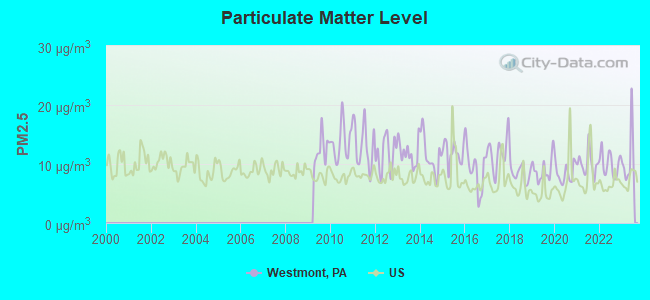
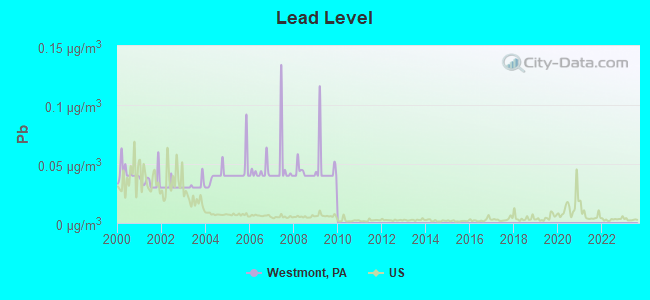
Data:
 Recent articles from our blog. Our writers, many of them Ph.D. graduates or candidates, create easy-to-read articles on a wide variety of topics.
Latest news from Westmont, PA collected exclusively by city-data.com from local newspapers, TV, and radio stations
Ancestries: German (36.5%), Irish (11.0%), Italian (9.7%), European (9.2%), Polish (6.6%), American (6.1%).
Current Local Time: EST time zone
Incorporated on 06/13/1892
Land area: 2.37 square miles.
Population density: 2,068 people per square mile (low).
49 residents are foreign born
| This borough: | 1.0% |
| Pennsylvania: | 7.3% |
Median real estate property taxes paid for housing units with mortgages in 2022: $4,016 (2.2%)
Median real estate property taxes paid for housing units with no mortgage in 2022: $3,595 (2.5%)
Nearest city with pop. 50,000+: Pittsburgh, PA  (54.8 miles , pop. 334,563).
Nearest city with pop. 1,000,000+: Philadelphia, PA (202.3 miles , pop. 1,517,550).
Nearest cities:
Latitude: 40.32 N, Longitude: 78.95 W
Area code commonly used in this area: 814
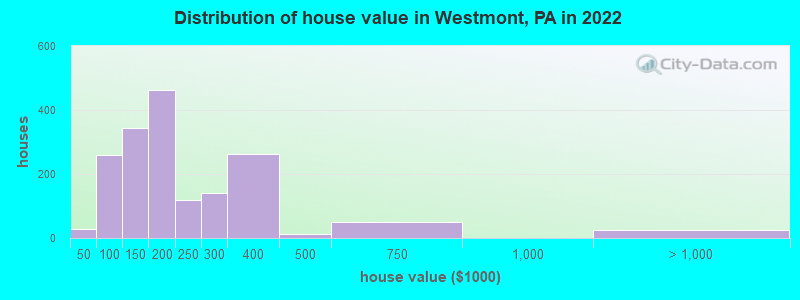
Property values in Westmont, PA
Unemployment in December 2023:
| Here: | 3.6% |
| Pennsylvania: | 2.9% |
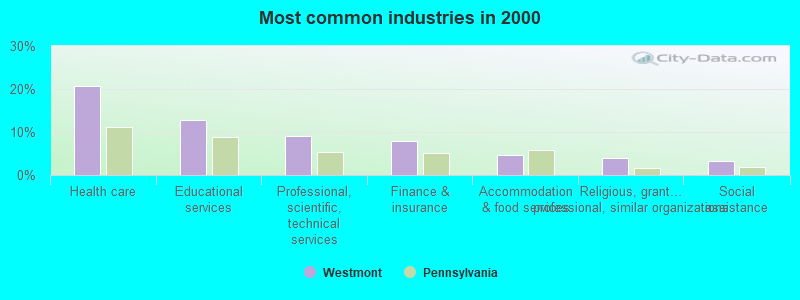
Most common industries in Westmont, PA (%)
Both
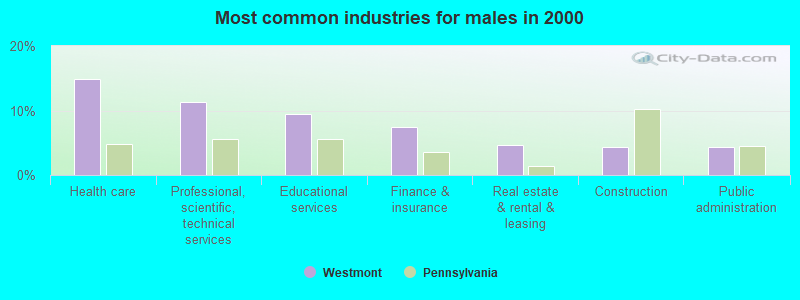
Males
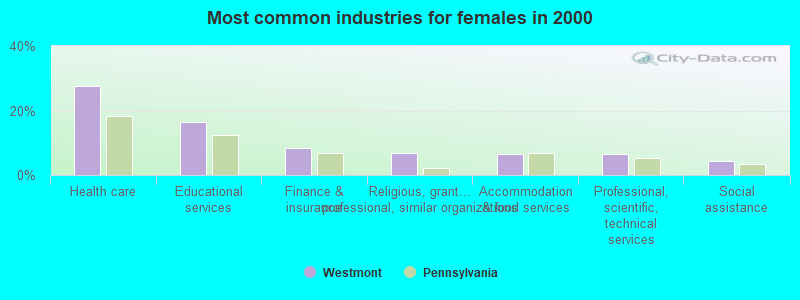
Females


- Health care (20.7%)
- Educational services (12.7%)
- Professional, scientific, technical services (9.1%)
- Finance & insurance (7.9%)
- Accommodation & food services (4.7%)
- Religious, grantmaking, civic, professional, similar organizations (3.9%)
- Social assistance (3.3%)

- Health care (14.9%)
- Professional, scientific, technical services (11.3%)
- Educational services (9.5%)
- Finance & insurance (7.4%)
- Real estate & rental & leasing (4.7%)
- Construction (4.4%)
- Public administration (4.3%)

- Health care (27.5%)
- Educational services (16.5%)
- Finance & insurance (8.5%)
- Religious, grantmaking, civic, professional, similar organizations (7.0%)
- Accommodation & food services (6.5%)
- Professional, scientific, technical services (6.5%)
- Social assistance (4.3%)
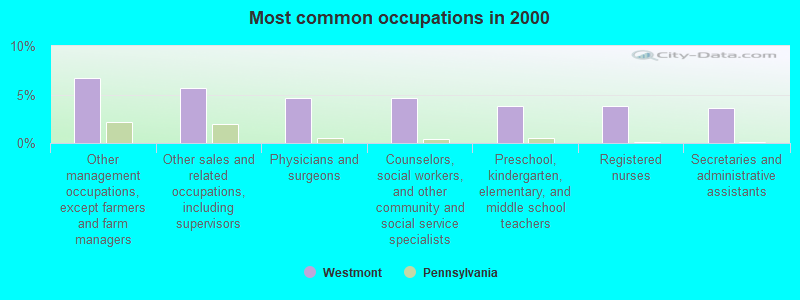
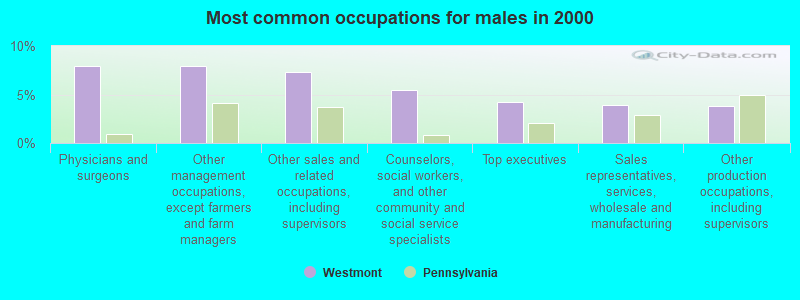
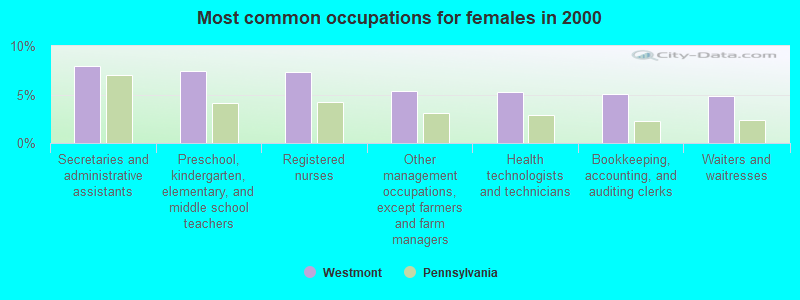
Most common occupations in Westmont, PA (%)
Both
Males
Females

- Other management occupations, except farmers and farm managers (6.7%)
- Other sales and related occupations, including supervisors (5.7%)
- Physicians and surgeons (4.6%)
- Counselors, social workers, and other community and social service specialists (4.6%)
- Preschool, kindergarten, elementary, and middle school teachers (3.8%)
- Registered nurses (3.8%)
- Secretaries and administrative assistants (3.6%)

- Physicians and surgeons (7.9%)
- Other management occupations, except farmers and farm managers (7.9%)
- Other sales and related occupations, including supervisors (7.3%)
- Counselors, social workers, and other community and social service specialists (5.5%)
- Top executives (4.2%)
- Sales representatives, services, wholesale and manufacturing (3.9%)
- Other production occupations, including supervisors (3.8%)

- Secretaries and administrative assistants (7.9%)
- Preschool, kindergarten, elementary, and middle school teachers (7.5%)
- Registered nurses (7.3%)
- Other management occupations, except farmers and farm managers (5.3%)
- Health technologists and technicians (5.2%)
- Bookkeeping, accounting, and auditing clerks (5.1%)
- Waiters and waitresses (4.8%)
Tornado activity:
Westmont-area historical tornado activity is slightly below Pennsylvania state average. It is 36% smaller than the overall U.S. average.
On 6/2/1998, a category F4 (max. wind speeds 207-260 mph) tornado 23.5 miles away from the Westmont borough center injured 5 people and caused $6 million in damages.
On 6/3/1980, a category F4 tornado 34.2 miles away from the borough center injured 140 people and caused between $50,000,000 and $500,000,000 in damages.
Earthquake activity:
Westmont-area historical earthquake activity is significantly above Pennsylvania state average. It is 59% smaller than the overall U.S. average.
On 8/23/2011 at 17:51:04, a magnitude 5.8 (5.8 MW, Depth: 3.7 mi, Class: Moderate, Intensity: VI - VII) earthquake occurred 175.3 miles away from Westmont center
On 9/25/1998 at 19:52:52, a magnitude 5.2 (4.8 MB, 4.3 MS, 5.2 LG, 4.5 MW, Depth: 3.1 mi) earthquake occurred 110.9 miles away from the city center
On 1/31/1986 at 16:46:43, a magnitude 5.0 (5.0 MB) earthquake occurred 145.7 miles away from Westmont center
On 1/16/1994 at 01:49:16, a magnitude 4.6 (4.6 MB, 4.6 LG, Depth: 3.1 mi, Class: Light, Intensity: IV - V) earthquake occurred 153.5 miles away from the city center
On 8/25/2011 at 05:07:52, a magnitude 4.5 (4.5 ML, Depth: 4.2 mi) earthquake occurred 172.3 miles away from the city center
On 7/27/1980 at 18:52:21, a magnitude 5.2 (5.1 MB, 4.7 MS, 5.0 UK, 5.2 UK) earthquake occurred 304.7 miles away from Westmont center
Magnitude types: regional Lg-wave magnitude (LG), body-wave magnitude (MB), local magnitude (ML), surface-wave magnitude (MS), moment magnitude (MW)
Natural disasters:
The number of natural disasters in Cambria County (14) is near the US average (15).
Major Disasters (Presidential) Declared: 9
Emergencies Declared: 5
Causes of natural disasters: Floods: 3, Snowstorms: 3, Winter Storms: 3, Hurricanes: 2, Storms: 2, Tropical Storms: 2, Blizzard: 1, Snowfall: 1, Other: 1 (Note: some incidents may be assigned to more than one category).
Hospitals and medical centers near Westmont:
- LUTHERAN HOME AT JOHNSTOWN, THE (Nursing Home, about 1 miles away; JOHNSTOWN, PA)
- PRESBYTERIAN HOME OF GREATER JOHNSTOWN (Nursing Home, about 1 miles away; JOHNSTOWN, PA)
- HIRAM G ANDREWS CNTR (Nursing Home, about 2 miles away; JOHNSTOWN, PA)
- COMMUNITY NURSING AND HOME HEALTH (Home Health Center, about 2 miles away; JOHNSTOWN, PA)
- UPMC LEE REGIONAL (Hospital, about 2 miles away; JOHNSTOWN, PA)
- MEMORIAL MEDICAL CENTER (Nursing Home, about 2 miles away; JOHNSTOWN, PA)
- LAURELWOOD CARE CENTER (Nursing Home, about 2 miles away; JOHNSTOWN, PA)
Amtrak station near Westmont:
- 2 miles: JOHNSTOWN (47 WALNUT ST.) . Services: ticket office, fully wheelchair accessible, enclosed waiting area, public restrooms, public payphones, vending machines, free short-term parking, free long-term parking, call for taxi service.
Colleges/universities with over 2000 students nearest to Westmont:
- University of Pittsburgh-Johnstown (about 8 miles; Johnstown, PA; Full-time enrollment: 2,815)
- Wyo Tech-Blairsville (about 18 miles; Blairsville, PA; FT enrollment: 2,602)
- Saint Francis University (about 21 miles; Loretto, PA; FT enrollment: 2,636)
- Indiana University of Pennsylvania-Main Campus (about 24 miles; Indiana, PA; FT enrollment: 14,471)
- Seton Hill University (about 33 miles; Greensburg, PA; FT enrollment: 2,167)
- Pennsylvania State University-Penn State Altoona (about 33 miles; Altoona, PA; FT enrollment: 3,656)
- Westmoreland County Community College (about 34 miles; Youngwood, PA; FT enrollment: 4,669)
User-submitted facts and corrections:
- The street name on the picture is spelled Luzerne
Average household size:| This borough: | 2.4 people |
| Pennsylvania: | 2.5 people |
Percentage of family households:| This borough: | 69.0% |
| Whole state: | 65.0% |
Percentage of households with unmarried partners:| This borough: | 3.9% |
| Whole state: | 6.6% |
Likely homosexual households (counted as self-reported same-sex unmarried-partner households)
- Lesbian couples: 0.4% of all households
- Gay men: 0.1% of all households
4 people in homes for the mentally retarded in 2000
2 people in religious group quarters in 2000
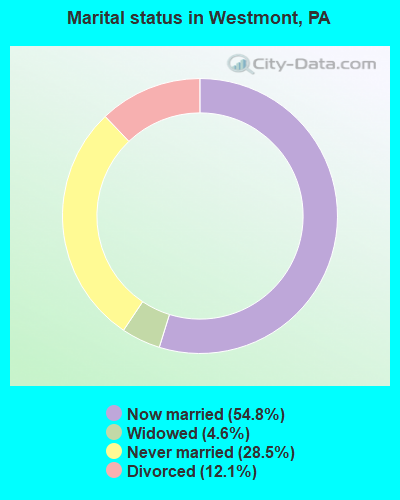
For population 15 years and over in Westmont:
- Never married: 28.5%
- Now married: 54.8%
- Separated: 0.0%
- Widowed: 4.6%
- Divorced: 12.1%
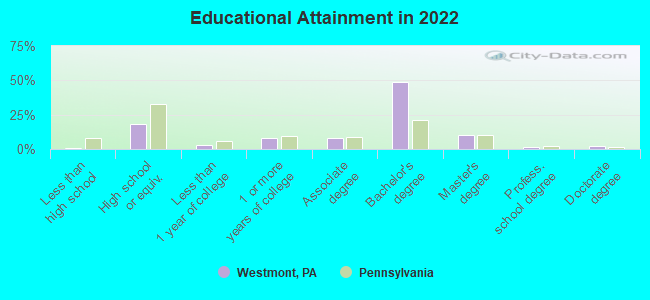
For population 25 years and over in Westmont:
- High school or higher: 99.1%
- Bachelor's degree or higher: 60.6%
- Graduate or professional degree: 15.3%
- Unemployed: 4.5%
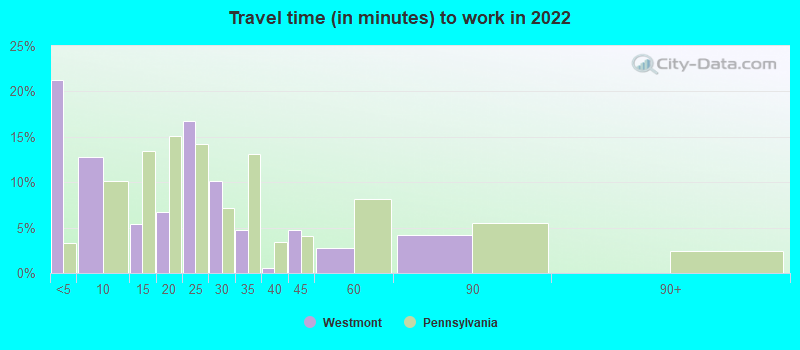
- Mean travel time to work (commute): 21.4 minutes
Education Gini index (Inequality in education)| Here: | 7.5 |
| Pennsylvania average: | 11.4 |
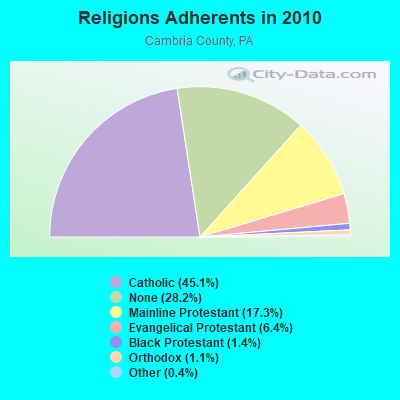
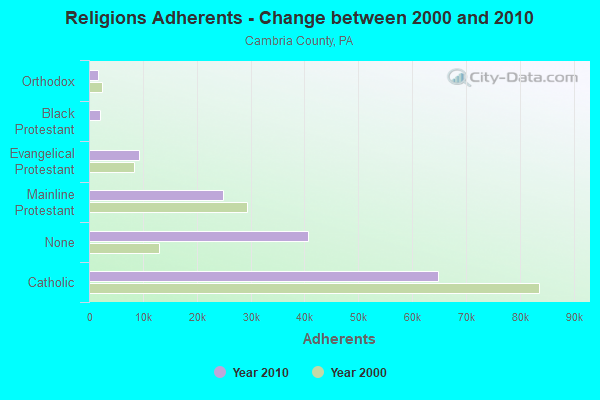
Religion statistics for Westmont, PA (based on Cambria County data)
| Religion | Adherents | Congregations |
|---|
| Catholic | 64,831 | 56 |
| Mainline Protestant | 24,819 | 101 |
| Evangelical Protestant | 9,208 | 67 |
| Black Protestant | 2,066 | 6 |
| Orthodox | 1,581 | 12 |
| Other | 609 | 5 |
| None | 40,565 | - |
Food Environment Statistics:
Number of grocery stores: 31| This county: | 2.14 / 10,000 pop. |
| Pennsylvania: | 2.04 / 10,000 pop. |
Number of supercenters and club stores: 1| Cambria County: | 0.07 / 10,000 pop. |
| Pennsylvania: | 0.09 / 10,000 pop. |
Number of convenience stores (no gas): 12| Cambria County: | 0.83 / 10,000 pop. |
| Pennsylvania: | 0.88 / 10,000 pop. |
Number of convenience stores (with gas): 38| Cambria County: | 2.62 / 10,000 pop. |
| Pennsylvania: | 2.52 / 10,000 pop. |
Number of full-service restaurants: 82| This county: | 5.66 / 10,000 pop. |
| Pennsylvania: | 7.12 / 10,000 pop. |
Adult diabetes rate: | This county: | 10.9% |
| Pennsylvania: | 9.1% |
Adult obesity rate: | This county: | 31.3% |
| Pennsylvania: | 27.2% |
Low-income preschool obesity rate: | This county: | 8.7% |
| Pennsylvania: | 11.5% |
Health and Nutrition:
Healthy diet rate: | Westmont: | 55.4% |
| State: | 50.2% |
Average overall health of teeth and gums: | Westmont: | 51.6% |
| State: | 47.1% |
Average BMI: | Westmont: | 27.6 |
| Pennsylvania: | 28.7 |
People feeling badly about themselves: | This city: | 15.3% |
| Pennsylvania: | 20.8% |
People not drinking alcohol at all: | Here: | 3.9% |
| Pennsylvania: | 10.9% |
Average hours sleeping at night:
Overweight people: | Westmont: | 29.8% |
| State: | 34.3% |
General health condition: | Westmont: | 59.0% |
| Pennsylvania: | 56.2% |
Average condition of hearing: | This city: | 75.4% |
| Pennsylvania: | 78.3% |
More about Health and Nutrition of Westmont, PA Residents
| Local government employment and payroll (March 2022) |
| Function |
Full-time employees |
Monthly full-time payroll |
Average yearly full-time wage |
Part-time employees |
Monthly part-time payroll |
| Streets and Highways |
7 | $40,810 | $69,960 | 0 | $0 |
| Police Protection - Officers |
4 | $32,963 | $98,889 | 4 | $6,699 |
| Financial Administration |
1 | $7,094 | $85,128 | 0 | $0 |
| Health |
1 | $6,006 | $72,072 | 0 | $0 |
| Totals for Government |
13 | $86,873 | $80,190 | 4 | $6,699 |
Westmont government finances - Expenditure in 2017 (per resident):
- Construction - Sewerage: $727,000 ($148.34)
Regular Highways: $78,000 ($15.92)
- Current Operations - Regular Highways: $922,000 ($188.12)
Police Protection: $757,000 ($154.46)
General - Other: $432,000 ($88.15)
Solid Waste Management: $283,000 ($57.74)
Sewerage: $276,000 ($56.32)
Central Staff Services: $155,000 ($31.63)
Local Fire Protection: $147,000 ($29.99)
Parks and Recreation: $112,000 ($22.85)
General Public Buildings: $33,000 ($6.73)
Financial Administration: $29,000 ($5.92)
Judicial and Legal Services: $10,000 ($2.04)
Transit Utilities: $8,000 ($1.63)
Libraries: $2,000 ($0.41)
- General - Interest on Debt: $1,000 ($0.20)
- Other Capital Outlay - Regular Highways: $180,000 ($36.73)
Sewerage: $43,000 ($8.77)
- Total Salaries and Wages: $801,000 ($163.44)
Westmont government finances - Revenue in 2017 (per resident):
- Charges - Sewerage: $1,175,000 ($239.75)
Solid Waste Management: $365,000 ($74.47)
- Local Intergovernmental - Highways: $11,000 ($2.24)
- Miscellaneous - General Revenue - Other: $113,000 ($23.06)
Rents: $25,000 ($5.10)
Fines and Forfeits: $7,000 ($1.43)
Interest Earnings: $2,000 ($0.41)
- State Intergovernmental - Highways: $168,000 ($34.28)
Other: $146,000 ($29.79)
General Local Government Support: $3,000 ($0.61)
- Tax - Property: $1,276,000 ($260.36)
Individual Income: $766,000 ($156.29)
Occupation and Business License - Other: $148,000 ($30.20)
Public Utility License: $95,000 ($19.38)
Documentary and Stock Transfer: $45,000 ($9.18)
Westmont government finances - Debt in 2017 (per resident):
- Long Term Debt - Beginning Outstanding - Unspecified Public Purpose: $29,000 ($5.92)
Issue, Unspecified Public Purpose: $29,000 ($5.92)
Retired Unspecified Public Purpose: $29,000 ($5.92)
Outstanding Unspecified Public Purpose: $29,000 ($5.92)
Westmont government finances - Cash and Securities in 2017 (per resident):
- Other Funds - Cash and Securities: $4,487,000 ($915.53)
Strongest AM radio stations in Westmont:
- WCRO (1230 AM; 1 kW; JOHNSTOWN, PA; Owner: GREATER JOHNSTOWN SCHOOL DISTRICT)
- WLYE (850 AM; 10 kW; JOHNSTOWN, PA; Owner: FOREVER OF JOHNSTOWN, INC.)
- WNTJ (1490 AM; 1 kW; JOHNSTOWN, PA; Owner: CLEAR CHANNEL BROADCASTING LICENSES, INC.)
- WVSC (990 AM; 10 kW; SOMERSET, PA; Owner: FOREVER OF JOHNSTOWN, INC.)
- WCCS (1160 AM; 10 kW; HOMER CITY, PA; Owner: RENDA RADIO, INC.)
- KDKA (1020 AM; 50 kW; PITTSBURGH, PA; Owner: INFINITY BROADCASTING OPERATIONS, INC.)
- WZSK (1040 AM; daytime; 10 kW; EVERETT, PA; Owner: NEW MILLENNIUM COMMUNICATIONS GROUP, INC.)
- WYSN (1330 AM; 5 kW; SOMERSET, PA; Owner: DAME BROADCASTING, LLC)
- WKHB (620 AM; 6 kW; IRWIN, PA; Owner: BROADCAST COMMUNICATIONS, INC.)
- WKMC (1370 AM; 5 kW; ROARING SPRING, PA; Owner: ALLEGHENY MOUNTAIN NETWORK)
- WWVA (1170 AM; 53 kW; WHEELING, WV; Owner: CAPSTAR TX LIMITED PARTNERSHIP)
- WAVL (910 AM; 5 kW; APOLLO, PA; Owner: EVANGEL HEIGHTS ASSEMBLY OF GOD)
- WFRB (560 AM; 5 kW; FROSTBURG, MD; Owner: WTBO-WKGO CORPORATION, L.L.C.)
Strongest FM radio stations in Westmont:
- WQEJ (89.7 FM; JOHNSTOWN, PA; Owner: WQED MULTIMEDIA)
- WFRJ (88.9 FM; JOHNSTOWN, PA; Owner: FAMILY STATIONS, INC.)
- WKYE (95.5 FM; JOHNSTOWN, PA; Owner: FOREVER OF JOHNSTOWN, INC.)
- WQKK (92.1 FM; JOHNSTOWN, PA; Owner: DAME BROADCASTING, LLC)
- WMTZ (96.5 FM; JOHNSTOWN, PA; Owner: CLEAR CHANNEL BROADCASTING LICENSES, INC.)
- W228AO (93.5 FM; JOHNSTOWN, PA; Owner: DAME BROADCASTING, LLC)
- WGLU (99.1 FM; EBENSBURG, PA; Owner: DAME BROADCASTING, LLC)
- WCCL (101.7 FM; CENTRAL CITY, PA; Owner: DAME BROADCASTING, LLC)
- WUZI-FM1 (105.7 FM; JOHNSTOWN, PA; Owner: FOREVER BROADCASTING, LLC)
- WBXQ (94.7 FM; CRESSON, PA; Owner: SOUNDS GOOD, INC.)
- WAYC (100.9 FM; BEDFORD, PA; Owner: CESSNA COMMUNICATIONS, INC.)
- WMAJ-FM (104.9 FM; HOLLIDAYSBURG, PA; Owner: FOREVER OF PA, LLC)
- WBVE (107.5 FM; BEDFORD, PA; Owner: CESSNA COMMUNICATIONS, INC.)
- W294AE (106.7 FM; ALTOONA, PA; Owner: THE PENNSYLVANIA STATE UNIVERSITY)
- W267AC (101.3 FM; ALTOONA, PA; Owner: ALLEGHENY MOUNTAIN NETWORK)
- WFGY (98.1 FM; ALTOONA, PA; Owner: FOREVER OF PA, LLC)
- WKYE-FM1 (95.5 FM; JOHNSTOWN, PA; Owner: WINSTON RADIO CORPORATION)
- WPRR (100.1 FM; ALTOONA, PA; Owner: VITAL LICENSES, LLC)
- WALY (103.9 FM; BELLWOOD, PA; Owner: FOREVER OF JOHNSTOWN, INC.)
- WPCL (97.3 FM; NORTHERN CAMBRIA, PA; Owner: HE'S ALIVE INCORPORATED)
TV broadcast stations around Westmont:
- WJAC-TV (Channel 6; JOHNSTOWN, PA; Owner: WPXI-TV HOLDINGS, INC.)
- WNPA (Channel 19; JEANNETTE, PA; Owner: VIACOM STATIONS GROUP OF PITTSBURGH INC.)
- WLLS-LP (Channel 49; INDIANA, PA; Owner: LARRY L. SCHRECONGOST)
- WWCP-TV (Channel 8; JOHNSTOWN, PA; Owner: PEAK MEDIA OF PA LICENSEE LLC)
- WTAE-TV (Channel 4; PITTSBURGH, PA; Owner: WTAE HEARST-ARGYLE TV, INC. (CA CORP.))
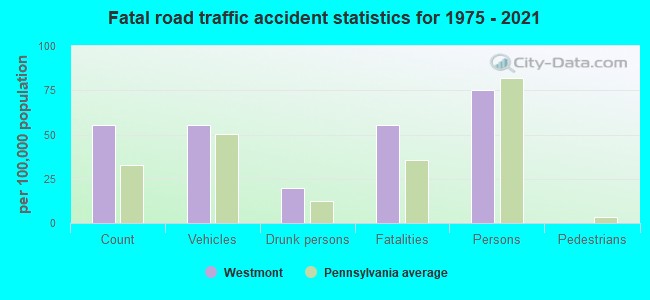
Westmont fatal accident list:
Aug 4, 2013 01:20 AM, Emmett Dr, Lat: 40.319064, Lon: -78.955600, Vehicles: 1, Persons: 2, Fatalities: 1, Drunk persons involved: 1
May 30, 2001 02:45 PM, Sr-271, Vehicles: 1, Persons: 1, Fatalities: 1
Oct 14, 1990 02:43 AM, 271, Vehicles: 1, Persons: 1, Fatalities: 1
- National Bridge Inventory (NBI) Statistics
- 3Number of bridges
- 13ft / 3.6mTotal length
- $1,399,000Total costs
- 3,002Total average daily traffic
- 101Total average daily truck traffic
- 3,480Total future (year 2032) average daily traffic
FCC Registered Antenna Towers:
5
- KELLYE E ABERNATHY, Montour Street & Reservoir Park Road (Lat: 40.320833 Lon: -78.927778), Type: 89.6, Overall height: 89.6 m, Registrant: Cingular Wireless LLC, Kellye.E.Abernathy@cingular.Com, , Plano, Phone: (469) 229-7422
- David C Jatlow, Montour Street & Reservoir Park Road (Lat: 40.320833 Lon: -78.927778), Type: 89.6, Overall height: 89.6 m, Registrant: New Cingular Wireless Services, Inc., Kellye.E.Abernathy@cingular.Com, , Dalla-s, Phone: (972) 733-2092
- DAVID C JATLOW, Montour Street & Reservoir Park Road (Lat: 40.320833 Lon: -78.927778), Type: 89.6, Overall height: 89.6 m, Registrant: Cingular Wireless LLC, Kellye.E.Abernathy, , Dalla-s, Phone: (972) 733-2092
- Dane F Ershen, Montour Street & Reservoir Park Road (Lat: 40.320833 Lon: -78.927778), Type: 89.6, Overall height: 89.6 m, Registrant: At&t Mobility LLC, Ka8805@att.Com, , Plano, Phone: (469) 229-7422
- Montour Street & Reservoir Park Road (Lat: 40.320833 Lon: -78.927778), Type: 89.6, Overall height: 89.6 m, Registrant: At&t Wireless Services, Inc., Esther.Hilliard@attws.Com, , Washi-ngton, Phone: (202) 223-9222
FCC Registered Microwave Towers:
3
- A4F0831A, Reservoir Park Road (Lat: 40.321306 Lon: -78.927417), Type: Mtower, Structure height: 85.3 m, Overall height: 89.3 m, Call Sign: WQVY782,
Assigned Frequencies: 19475.0 MHz, 19475.0 MHz, 19475.0 MHz, 19475.0 MHz, 19475.0 MHz, 19475.0 MHz, 19475.0 MHz, 19475.0 MHz, 19475.0 MHz, Grant Date: 06/17/2015, Expiration Date: 06/17/2025, Certifier: David Werblow, Registrant: T-Mobile Usa, Inc., 12920 Se 38th Street, Bellevue, WA 98006, Phone: (425) 383-8401, Fax: (425) 383-4040, Email:
- Plaza Drive, Plaza Drive (Lat: 40.323361 Lon: -78.955000), Type: Ltower, Structure height: 16.3 m, Call Sign: WRDB292,
Assigned Frequencies: 945.000 MHz, Grant Date: 03/18/2019, Expiration Date: 08/01/2030, Certifier: Lynn A Deppen, Registrant: Fm Radio Licenses, LLC, One Forever Drive, Hollidaysburg, PA 16648-3029, Phone: (814) 941-9800, Fax: (814) 943-2754, Email:
- PLAZA DRIVE, Plaza Drive (Lat: 40.323361 Lon: -78.955000), Type: Mast, Structure height: 16.3 m, Call Sign: WRDC865,
Assigned Frequencies: 948.000 MHz, Grant Date: 03/29/2019, Expiration Date: 08/01/2030, Certifier: Lynn A Deppen, Registrant: Fm Radio Licenses, LLC, One Forever Drive, Hollidaysburg, PA 16648-3029, Phone: (814) 941-9800, Email:
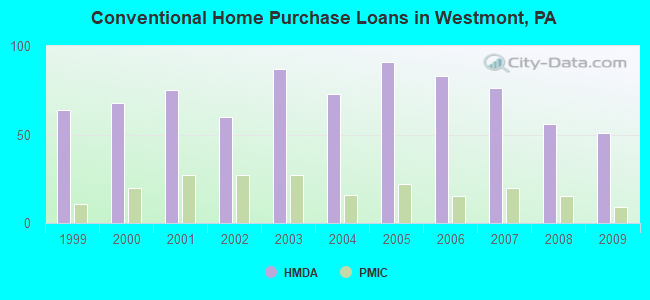
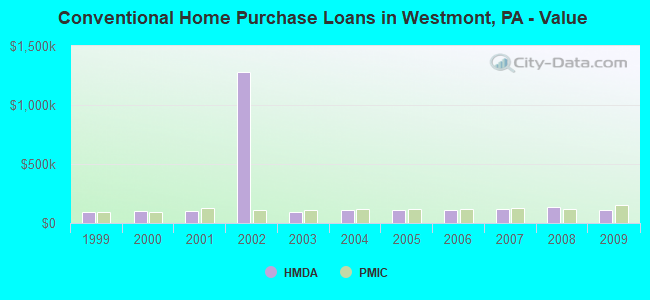
Home Mortgage Disclosure Act Aggregated Statistics For Year 2009
(Based on 1 full tract)
|
| A) FHA, FSA/RHS & VA
Home Purchase Loans | B) Conventional
Home Purchase Loans | C) Refinancings
| D) Home Improvement Loans
| F) Non-occupant Loans on
< 5 Family Dwellings (A B C & D) |
|---|
| Number | Average Value | Number | Average Value | Number | Average Value | Number | Average Value | Number | Average Value |
|---|
| LOANS ORIGINATED | 15 | $111,800 | 51 | $108,706 | 93 | $128,688 | 30 | $30,700 | 10 | $104,500 |
| APPLICATIONS APPROVED, NOT ACCEPTED | 1 | $74,000 | 1 | $128,000 | 9 | $176,222 | 2 | $63,000 | 0 | $0 |
| APPLICATIONS DENIED | 0 | $0 | 1 | $19,000 | 26 | $147,500 | 6 | $65,500 | 1 | $19,000 |
| APPLICATIONS WITHDRAWN | 3 | $158,667 | 2 | $87,000 | 17 | $163,647 | 1 | $25,000 | 2 | $127,000 |
| FILES CLOSED FOR INCOMPLETENESS | 1 | $125,000 | 0 | $0 | 2 | $125,500 | 2 | $27,500 | 0 | $0 |
Aggregated Statistics For Year 2008
(Based on 1 full tract)
|
| A) FHA, FSA/RHS & VA
Home Purchase Loans | B) Conventional
Home Purchase Loans | C) Refinancings
| D) Home Improvement Loans
| F) Non-occupant Loans on
< 5 Family Dwellings (A B C & D) |
|---|
| Number | Average Value | Number | Average Value | Number | Average Value | Number | Average Value | Number | Average Value |
|---|
| LOANS ORIGINATED | 19 | $126,684 | 56 | $134,107 | 59 | $92,237 | 29 | $51,966 | 9 | $62,222 |
| APPLICATIONS APPROVED, NOT ACCEPTED | 0 | $0 | 4 | $229,750 | 8 | $157,375 | 0 | $0 | 1 | $320,000 |
| APPLICATIONS DENIED | 1 | $61,000 | 6 | $57,000 | 34 | $155,647 | 13 | $80,308 | 1 | $60,000 |
| APPLICATIONS WITHDRAWN | 2 | $149,500 | 3 | $170,333 | 15 | $163,533 | 2 | $85,000 | 0 | $0 |
| FILES CLOSED FOR INCOMPLETENESS | 0 | $0 | 0 | $0 | 4 | $110,000 | 1 | $115,000 | 0 | $0 |
Aggregated Statistics For Year 2007
(Based on 1 full tract)
|
| A) FHA, FSA/RHS & VA
Home Purchase Loans | B) Conventional
Home Purchase Loans | C) Refinancings
| D) Home Improvement Loans
| F) Non-occupant Loans on
< 5 Family Dwellings (A B C & D) |
|---|
| Number | Average Value | Number | Average Value | Number | Average Value | Number | Average Value | Number | Average Value |
|---|
| LOANS ORIGINATED | 15 | $125,733 | 76 | $120,987 | 58 | $92,707 | 33 | $33,061 | 11 | $68,364 |
| APPLICATIONS APPROVED, NOT ACCEPTED | 0 | $0 | 5 | $55,600 | 8 | $73,750 | 4 | $80,500 | 2 | $84,500 |
| APPLICATIONS DENIED | 2 | $119,000 | 3 | $131,000 | 58 | $117,328 | 13 | $51,538 | 1 | $86,000 |
| APPLICATIONS WITHDRAWN | 2 | $129,000 | 4 | $169,750 | 13 | $95,769 | 7 | $30,286 | 1 | $30,000 |
| FILES CLOSED FOR INCOMPLETENESS | 0 | $0 | 1 | $124,000 | 3 | $90,333 | 0 | $0 | 0 | $0 |
Aggregated Statistics For Year 2006
(Based on 1 full tract)
|
| A) FHA, FSA/RHS & VA
Home Purchase Loans | B) Conventional
Home Purchase Loans | C) Refinancings
| D) Home Improvement Loans
| F) Non-occupant Loans on
< 5 Family Dwellings (A B C & D) |
|---|
| Number | Average Value | Number | Average Value | Number | Average Value | Number | Average Value | Number | Average Value |
|---|
| LOANS ORIGINATED | 18 | $120,000 | 83 | $110,952 | 84 | $98,774 | 33 | $24,818 | 11 | $99,364 |
| APPLICATIONS APPROVED, NOT ACCEPTED | 0 | $0 | 13 | $93,462 | 12 | $91,833 | 1 | $20,000 | 3 | $40,333 |
| APPLICATIONS DENIED | 0 | $0 | 6 | $79,500 | 51 | $111,745 | 14 | $27,429 | 1 | $75,000 |
| APPLICATIONS WITHDRAWN | 3 | $111,667 | 7 | $90,286 | 20 | $101,850 | 1 | $60,000 | 2 | $60,000 |
| FILES CLOSED FOR INCOMPLETENESS | 0 | $0 | 1 | $128,000 | 3 | $191,333 | 0 | $0 | 0 | $0 |
Aggregated Statistics For Year 2005
(Based on 1 full tract)
|
| A) FHA, FSA/RHS & VA
Home Purchase Loans | B) Conventional
Home Purchase Loans | C) Refinancings
| D) Home Improvement Loans
| F) Non-occupant Loans on
< 5 Family Dwellings (A B C & D) |
|---|
| Number | Average Value | Number | Average Value | Number | Average Value | Number | Average Value | Number | Average Value |
|---|
| LOANS ORIGINATED | 7 | $130,571 | 91 | $114,341 | 101 | $94,455 | 32 | $43,844 | 18 | $88,000 |
| APPLICATIONS APPROVED, NOT ACCEPTED | 0 | $0 | 3 | $78,667 | 20 | $113,150 | 3 | $11,667 | 0 | $0 |
| APPLICATIONS DENIED | 0 | $0 | 11 | $106,909 | 68 | $106,824 | 13 | $45,077 | 3 | $50,667 |
| APPLICATIONS WITHDRAWN | 0 | $0 | 8 | $141,125 | 38 | $120,500 | 5 | $139,400 | 2 | $129,500 |
| FILES CLOSED FOR INCOMPLETENESS | 0 | $0 | 2 | $179,000 | 11 | $114,727 | 0 | $0 | 0 | $0 |
Aggregated Statistics For Year 2004
(Based on 1 full tract)
|
| A) FHA, FSA/RHS & VA
Home Purchase Loans | B) Conventional
Home Purchase Loans | C) Refinancings
| D) Home Improvement Loans
| E) Loans on Dwellings For 5+ Families
| F) Non-occupant Loans on
< 5 Family Dwellings (A B C & D) | G) Loans On Manufactured
Home Dwelling (A B C & D) |
|---|
| Number | Average Value | Number | Average Value | Number | Average Value | Number | Average Value | Number | Average Value | Number | Average Value | Number | Average Value |
|---|
| LOANS ORIGINATED | 9 | $89,556 | 73 | $107,575 | 117 | $92,513 | 39 | $42,462 | 0 | $0 | 15 | $85,133 | 1 | $50,000 |
| APPLICATIONS APPROVED, NOT ACCEPTED | 1 | $60,000 | 6 | $78,500 | 21 | $85,238 | 5 | $41,000 | 0 | $0 | 0 | $0 | 0 | $0 |
| APPLICATIONS DENIED | 0 | $0 | 5 | $90,800 | 49 | $115,653 | 14 | $33,071 | 1 | $40,000 | 2 | $39,000 | 0 | $0 |
| APPLICATIONS WITHDRAWN | 0 | $0 | 6 | $153,500 | 40 | $98,250 | 1 | $50,000 | 0 | $0 | 4 | $172,500 | 1 | $13,000 |
| FILES CLOSED FOR INCOMPLETENESS | 0 | $0 | 1 | $98,000 | 17 | $129,647 | 0 | $0 | 0 | $0 | 1 | $90,000 | 0 | $0 |
Aggregated Statistics For Year 2003
(Based on 1 full tract)
|
| A) FHA, FSA/RHS & VA
Home Purchase Loans | B) Conventional
Home Purchase Loans | C) Refinancings
| D) Home Improvement Loans
| F) Non-occupant Loans on
< 5 Family Dwellings (A B C & D) |
|---|
| Number | Average Value | Number | Average Value | Number | Average Value | Number | Average Value | Number | Average Value |
|---|
| LOANS ORIGINATED | 18 | $117,556 | 87 | $97,184 | 275 | $96,640 | 52 | $34,269 | 21 | $73,857 |
| APPLICATIONS APPROVED, NOT ACCEPTED | 0 | $0 | 5 | $119,400 | 22 | $106,591 | 5 | $49,400 | 0 | $0 |
| APPLICATIONS DENIED | 3 | $85,000 | 8 | $92,750 | 46 | $127,652 | 3 | $29,000 | 2 | $62,000 |
| APPLICATIONS WITHDRAWN | 1 | $136,000 | 8 | $100,375 | 41 | $104,415 | 4 | $43,750 | 0 | $0 |
| FILES CLOSED FOR INCOMPLETENESS | 1 | $136,000 | 0 | $0 | 6 | $126,167 | 1 | $50,000 | 0 | $0 |
Aggregated Statistics For Year 2002
(Based on 1 full tract)
|
| A) FHA, FSA/RHS & VA
Home Purchase Loans | B) Conventional
Home Purchase Loans | C) Refinancings
| D) Home Improvement Loans
| F) Non-occupant Loans on
< 5 Family Dwellings (A B C & D) |
|---|
| Number | Average Value | Number | Average Value | Number | Average Value | Number | Average Value | Number | Average Value |
|---|
| LOANS ORIGINATED | 8 | $89,375 | 60 | $1,279,450 | 179 | $173,620 | 44 | $288,636 | 2 | $68,000 |
| APPLICATIONS APPROVED, NOT ACCEPTED | 1 | $73,000 | 3 | $56,667 | 16 | $89,625 | 3 | $27,000 | 4 | $93,250 |
| APPLICATIONS DENIED | 3 | $122,333 | 4 | $29,000 | 32 | $52,406 | 7 | $12,143 | 0 | $0 |
| APPLICATIONS WITHDRAWN | 1 | $71,000 | 2 | $8,175,000 | 28 | $80,143 | 2 | $21,000 | 0 | $0 |
| FILES CLOSED FOR INCOMPLETENESS | 0 | $0 | 1 | $233,000 | 7 | $98,143 | 0 | $0 | 0 | $0 |
Aggregated Statistics For Year 2001
(Based on 1 full tract)
|
| A) FHA, FSA/RHS & VA
Home Purchase Loans | B) Conventional
Home Purchase Loans | C) Refinancings
| D) Home Improvement Loans
| F) Non-occupant Loans on
< 5 Family Dwellings (A B C & D) |
|---|
| Number | Average Value | Number | Average Value | Number | Average Value | Number | Average Value | Number | Average Value |
|---|
| LOANS ORIGINATED | 14 | $94,857 | 75 | $104,587 | 110 | $96,591 | 58 | $22,086 | 8 | $70,000 |
| APPLICATIONS APPROVED, NOT ACCEPTED | 0 | $0 | 4 | $78,250 | 18 | $64,611 | 6 | $24,667 | 2 | $31,000 |
| APPLICATIONS DENIED | 0 | $0 | 8 | $43,625 | 26 | $70,462 | 12 | $13,917 | 0 | $0 |
| APPLICATIONS WITHDRAWN | 0 | $0 | 5 | $88,000 | 17 | $77,706 | 5 | $17,400 | 1 | $140,000 |
| FILES CLOSED FOR INCOMPLETENESS | 0 | $0 | 0 | $0 | 6 | $106,500 | 1 | $20,000 | 0 | $0 |
Aggregated Statistics For Year 2000
(Based on 1 full tract)
|
| A) FHA, FSA/RHS & VA
Home Purchase Loans | B) Conventional
Home Purchase Loans | C) Refinancings
| D) Home Improvement Loans
| F) Non-occupant Loans on
< 5 Family Dwellings (A B C & D) |
|---|
| Number | Average Value | Number | Average Value | Number | Average Value | Number | Average Value | Number | Average Value |
|---|
| LOANS ORIGINATED | 9 | $82,778 | 68 | $101,456 | 41 | $70,707 | 32 | $25,719 | 4 | $65,250 |
| APPLICATIONS APPROVED, NOT ACCEPTED | 1 | $114,000 | 2 | $66,500 | 14 | $67,214 | 0 | $0 | 0 | $0 |
| APPLICATIONS DENIED | 0 | $0 | 3 | $65,333 | 19 | $51,895 | 9 | $12,889 | 1 | $50,000 |
| APPLICATIONS WITHDRAWN | 0 | $0 | 4 | $101,500 | 11 | $56,000 | 1 | $8,000 | 1 | $44,000 |
| FILES CLOSED FOR INCOMPLETENESS | 0 | $0 | 0 | $0 | 4 | $50,000 | 0 | $0 | 0 | $0 |
Aggregated Statistics For Year 1999
(Based on 1 full tract)
|
| A) FHA, FSA/RHS & VA
Home Purchase Loans | B) Conventional
Home Purchase Loans | C) Refinancings
| D) Home Improvement Loans
| F) Non-occupant Loans on
< 5 Family Dwellings (A B C & D) |
|---|
| Number | Average Value | Number | Average Value | Number | Average Value | Number | Average Value | Number | Average Value |
|---|
| LOANS ORIGINATED | 10 | $75,644 | 64 | $92,804 | 97 | $81,059 | 51 | $29,187 | 6 | $79,772 |
| APPLICATIONS APPROVED, NOT ACCEPTED | 0 | $0 | 3 | $130,297 | 16 | $45,146 | 2 | $2,435 | 0 | $0 |
| APPLICATIONS DENIED | 0 | $0 | 5 | $115,026 | 39 | $66,411 | 7 | $52,083 | 2 | $27,295 |
| APPLICATIONS WITHDRAWN | 1 | $46,790 | 6 | $84,970 | 15 | $65,051 | 2 | $68,235 | 1 | $59,460 |
| FILES CLOSED FOR INCOMPLETENESS | 0 | $0 | 0 | $0 | 4 | $75,060 | 0 | $0 | 0 | $0 |
Detailed HMDA statistics for the following Tracts:
0113.00
Private Mortgage Insurance Companies Aggregated Statistics For Year 2009
(Based on 1 full tract)
|
| A) Conventional
Home Purchase Loans | B) Refinancings
|
|---|
| Number | Average Value | Number | Average Value |
|---|
| LOANS ORIGINATED | 9 | $152,556 | 3 | $173,000 |
| APPLICATIONS APPROVED, NOT ACCEPTED | 2 | $212,000 | 3 | $178,667 |
| APPLICATIONS DENIED | 0 | $0 | 1 | $105,000 |
| APPLICATIONS WITHDRAWN | 1 | $173,000 | 0 | $0 |
| FILES CLOSED FOR INCOMPLETENESS | 0 | $0 | 0 | $0 |
Aggregated Statistics For Year 2008
(Based on 1 full tract)
|
| A) Conventional
Home Purchase Loans | B) Refinancings
| C) Non-occupant Loans on
< 5 Family Dwellings (A & B) |
|---|
| Number | Average Value | Number | Average Value | Number | Average Value |
|---|
| LOANS ORIGINATED | 15 | $118,733 | 6 | $159,167 | 1 | $127,000 |
| APPLICATIONS APPROVED, NOT ACCEPTED | 3 | $223,333 | 2 | $222,500 | 0 | $0 |
| APPLICATIONS DENIED | 0 | $0 | 1 | $105,000 | 0 | $0 |
| APPLICATIONS WITHDRAWN | 1 | $127,000 | 0 | $0 | 1 | $127,000 |
| FILES CLOSED FOR INCOMPLETENESS | 0 | $0 | 0 | $0 | 0 | $0 |
Aggregated Statistics For Year 2007
(Based on 1 full tract)
|
| A) Conventional
Home Purchase Loans | B) Refinancings
| C) Non-occupant Loans on
< 5 Family Dwellings (A & B) |
|---|
| Number | Average Value | Number | Average Value | Number | Average Value |
|---|
| LOANS ORIGINATED | 20 | $126,500 | 5 | $122,800 | 1 | $20,000 |
| APPLICATIONS APPROVED, NOT ACCEPTED | 1 | $349,000 | 1 | $138,000 | 0 | $0 |
| APPLICATIONS DENIED | 1 | $163,000 | 0 | $0 | 0 | $0 |
| APPLICATIONS WITHDRAWN | 0 | $0 | 2 | $228,000 | 0 | $0 |
| FILES CLOSED FOR INCOMPLETENESS | 0 | $0 | 0 | $0 | 0 | $0 |
Aggregated Statistics For Year 2006
(Based on 1 full tract)
|
| A) Conventional
Home Purchase Loans | B) Refinancings
| C) Non-occupant Loans on
< 5 Family Dwellings (A & B) |
|---|
| Number | Average Value | Number | Average Value | Number | Average Value |
|---|
| LOANS ORIGINATED | 15 | $122,667 | 4 | $121,500 | 2 | $70,000 |
| APPLICATIONS APPROVED, NOT ACCEPTED | 0 | $0 | 0 | $0 | 0 | $0 |
| APPLICATIONS DENIED | 0 | $0 | 0 | $0 | 0 | $0 |
| APPLICATIONS WITHDRAWN | 0 | $0 | 0 | $0 | 0 | $0 |
| FILES CLOSED FOR INCOMPLETENESS | 0 | $0 | 0 | $0 | 0 | $0 |
Aggregated Statistics For Year 2005
(Based on 1 full tract)
|
| A) Conventional
Home Purchase Loans | B) Refinancings
| C) Non-occupant Loans on
< 5 Family Dwellings (A & B) |
|---|
| Number | Average Value | Number | Average Value | Number | Average Value |
|---|
| LOANS ORIGINATED | 22 | $119,455 | 10 | $151,200 | 1 | $171,000 |
| APPLICATIONS APPROVED, NOT ACCEPTED | 4 | $102,000 | 1 | $138,000 | 0 | $0 |
| APPLICATIONS DENIED | 0 | $0 | 0 | $0 | 0 | $0 |
| APPLICATIONS WITHDRAWN | 0 | $0 | 0 | $0 | 0 | $0 |
| FILES CLOSED FOR INCOMPLETENESS | 0 | $0 | 1 | $230,000 | 0 | $0 |
Aggregated Statistics For Year 2004
(Based on 1 full tract)
|
| A) Conventional
Home Purchase Loans | B) Refinancings
| C) Non-occupant Loans on
< 5 Family Dwellings (A & B) |
|---|
| Number | Average Value | Number | Average Value | Number | Average Value |
|---|
| LOANS ORIGINATED | 16 | $119,062 | 5 | $162,400 | 1 | $65,000 |
| APPLICATIONS APPROVED, NOT ACCEPTED | 3 | $161,000 | 2 | $111,500 | 0 | $0 |
| APPLICATIONS DENIED | 0 | $0 | 0 | $0 | 0 | $0 |
| APPLICATIONS WITHDRAWN | 1 | $177,000 | 0 | $0 | 0 | $0 |
| FILES CLOSED FOR INCOMPLETENESS | 0 | $0 | 0 | $0 | 0 | $0 |
Aggregated Statistics For Year 2003
(Based on 1 full tract)
|
| A) Conventional
Home Purchase Loans | B) Refinancings
| C) Non-occupant Loans on
< 5 Family Dwellings (A & B) |
|---|
| Number | Average Value | Number | Average Value | Number | Average Value |
|---|
| LOANS ORIGINATED | 27 | $106,852 | 17 | $116,118 | 2 | $79,500 |
| APPLICATIONS APPROVED, NOT ACCEPTED | 2 | $73,500 | 8 | $133,875 | 0 | $0 |
| APPLICATIONS DENIED | 0 | $0 | 0 | $0 | 0 | $0 |
| APPLICATIONS WITHDRAWN | 1 | $230,000 | 0 | $0 | 0 | $0 |
| FILES CLOSED FOR INCOMPLETENESS | 0 | $0 | 0 | $0 | 0 | $0 |
Aggregated Statistics For Year 2002
(Based on 1 full tract)
|
| A) Conventional
Home Purchase Loans | B) Refinancings
|
|---|
| Number | Average Value | Number | Average Value |
|---|
| LOANS ORIGINATED | 27 | $110,889 | 11 | $104,727 |
| APPLICATIONS APPROVED, NOT ACCEPTED | 3 | $118,000 | 2 | $179,500 |
| APPLICATIONS DENIED | 0 | $0 | 1 | $82,000 |
| APPLICATIONS WITHDRAWN | 0 | $0 | 0 | $0 |
| FILES CLOSED FOR INCOMPLETENESS | 0 | $0 | 0 | $0 |
Aggregated Statistics For Year 2001
(Based on 1 full tract)
|
| A) Conventional
Home Purchase Loans | B) Refinancings
| C) Non-occupant Loans on
< 5 Family Dwellings (A & B) |
|---|
| Number | Average Value | Number | Average Value | Number | Average Value |
|---|
| LOANS ORIGINATED | 27 | $123,074 | 4 | $93,000 | 1 | $72,000 |
| APPLICATIONS APPROVED, NOT ACCEPTED | 1 | $140,000 | 0 | $0 | 0 | $0 |
| APPLICATIONS DENIED | 0 | $0 | 0 | $0 | 0 | $0 |
| APPLICATIONS WITHDRAWN | 1 | $136,000 | 0 | $0 | 0 | $0 |
| FILES CLOSED FOR INCOMPLETENESS | 0 | $0 | 0 | $0 | 0 | $0 |
Aggregated Statistics For Year 2000
(Based on 1 full tract)
|
| A) Conventional
Home Purchase Loans |
|---|
| Number | Average Value |
|---|
| LOANS ORIGINATED | 20 | $94,200 |
| APPLICATIONS APPROVED, NOT ACCEPTED | 2 | $127,500 |
| APPLICATIONS DENIED | 0 | $0 |
| APPLICATIONS WITHDRAWN | 0 | $0 |
| FILES CLOSED FOR INCOMPLETENESS | 0 | $0 |
Aggregated Statistics For Year 1999
(Based on 1 full tract)
|
| A) Conventional
Home Purchase Loans | B) Refinancings
|
|---|
| Number | Average Value | Number | Average Value |
|---|
| LOANS ORIGINATED | 11 | $91,985 | 4 | $92,362 |
| APPLICATIONS APPROVED, NOT ACCEPTED | 2 | $82,860 | 1 | $126,720 |
| APPLICATIONS DENIED | 0 | $0 | 0 | $0 |
| APPLICATIONS WITHDRAWN | 0 | $0 | 0 | $0 |
| FILES CLOSED FOR INCOMPLETENESS | 0 | $0 | 0 | $0 |
Detailed PMIC statistics for the following Tracts:
0113.00
Westmont compared to Pennsylvania state average:
- Median house value below state average.
- Unemployed percentage significantly below state average.
- Black race population percentage significantly below state average.
- Hispanic race population percentage significantly below state average.
- Median age above state average.
- Foreign-born population percentage significantly below state average.
- Renting percentage below state average.
- Number of rooms per house above state average.
- Percentage of population with a bachelor's degree or higher significantly above state average.
- #27 on the list of "Top 101 cities with largest percentage of males in industries: health care and social assistance (population 5,000+)"
- #97 on the list of "Top 101 cities with largest percentage of females in industries: health care and social assistance (population 5,000+)"
- #98 on the list of "Top 101 cities with largest percentage of males in occupations: health diagnosing and treating practitioners and other technical occupations (population 5,000+)"
- #101 on the list of "Top 101 cities with largest percentage of males in occupations: computer and mathematical occupations (population 5,000+)"
- #54 (15905) on the list of "Top 101 zip codes with the largest percentage of Slovak first ancestries (pop 5,000+)"
- #7 on the list of "Top 101 counties with the lowest percentage of residents relocating from other counties between 2010 and 2011"
- #18 on the list of "Top 101 counties with the lowest percentage of residents relocating to other counties in 2011"
- #23 on the list of "Top 101 counties with the lowest Ozone (1-hour) air pollution readings in 2012 (ppm)"
- #24 on the list of "Top 101 counties with the highest number of deaths per 1000 residents 2007-2013 (pop. 50,000+)"
- #38 on the list of "Top 101 counties with the lowest number of births per 1000 residents 2007-2013"