Spry, Pennsylvania
Submit your own pictures of this place and show them to the world
- OSM Map
- General Map
- Google Map
- MSN Map
- OSM Map
- General Map
- Google Map
- MSN Map
- OSM Map
- General Map
- Google Map
- MSN Map
- OSM Map
- General Map
- Google Map
- MSN Map
Please wait while loading the map...
Population in 2010: 4,891.
Population change since 2000: -0.2%
| Males: 2,200 |  (45.0%) (45.0%) |
| Females: 2,691 |  (55.0%) (55.0%) |
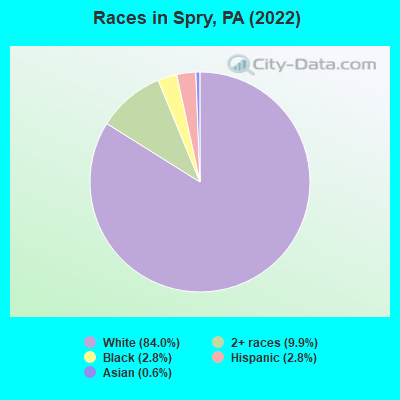
(7.9% for White Non-Hispanic residents, 52.0% for Hispanic or Latino residents, 100.0% for other race residents)
Business Search - 14 Million verified businesses
Data:
 Recent articles from our blog. Our writers, many of them Ph.D. graduates or candidates, create easy-to-read articles on a wide variety of topics.
Latest news from Spry, PA collected exclusively by city-data.com from local newspapers, TV, and radio stations
Ancestries: German (42.8%), Italian (7.1%), Irish (6.3%), American (6.2%), Pennsylvania German (5.1%), English (3.0%).
Current Local Time: EST time zone
Land area: 2.58 square miles.
Population density: 1,898 people per square mile (low).
61 residents are foreign born
| This place: | 1.3% |
| Pennsylvania: | 7.3% |
Median real estate property taxes paid for housing units with mortgages in 2022: $3,697 (1.6%)
Median real estate property taxes paid for housing units with no mortgage in 2022: $3,881 (1.6%)
Nearest city with pop. 50,000+: Lancaster, PA  (22.1 miles , pop. 56,348).
Nearest city with pop. 200,000+: Baltimore, MD (42.0 miles , pop. 651,154).
Nearest city with pop. 1,000,000+: Philadelphia, PA (82.0 miles , pop. 1,517,550).
Nearest cities:
Latitude: 39.91 N, Longitude: 76.69 W
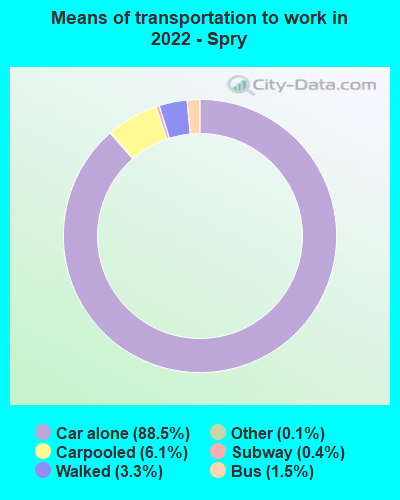
Daytime population change due to commuting: +719 (+15.0%)
Workers who live and work in this place: 389 (14.6%)
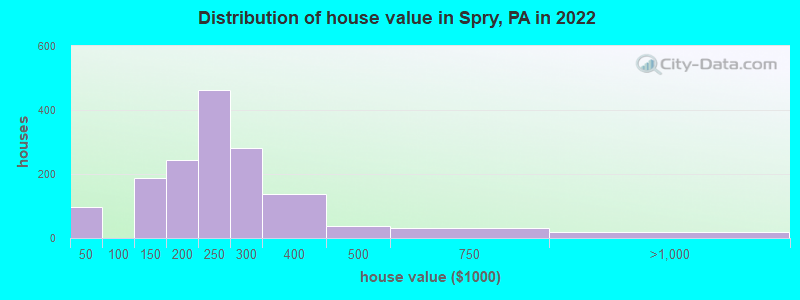
Property values in Spry, PA
Unemployment in December 2023:
| Here: | 2.5% |
| Pennsylvania: | 2.9% |
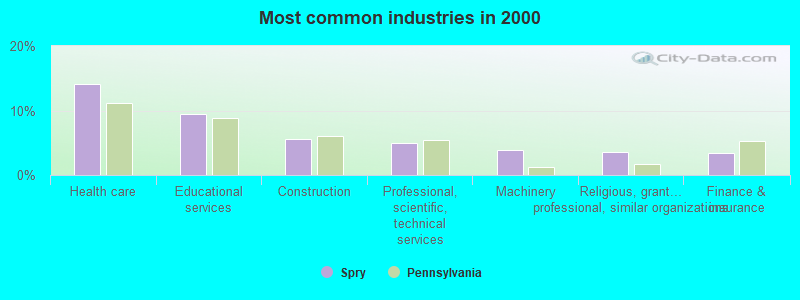
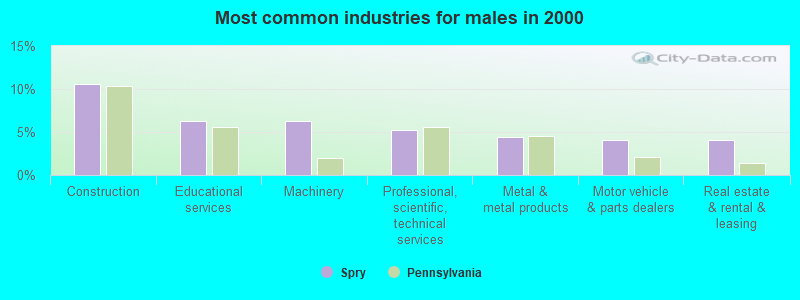
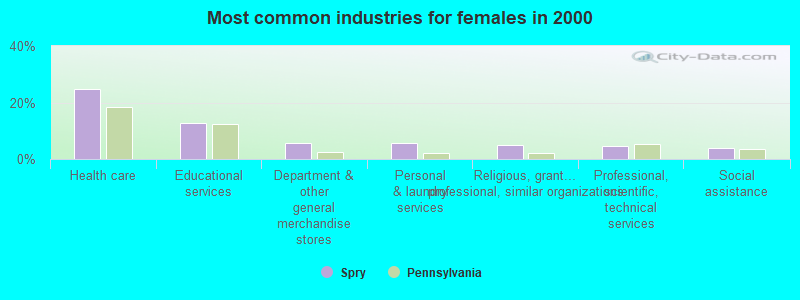
Most common industries in Spry, PA (%)
Both
Males
Females


- Health care (14.2%)
- Educational services (9.4%)
- Construction (5.6%)
- Professional, scientific, technical services (4.9%)
- Machinery (3.8%)
- Religious, grantmaking, civic, professional, similar organizations (3.6%)
- Finance & insurance (3.5%)

- Construction (10.6%)
- Educational services (6.2%)
- Machinery (6.2%)
- Professional, scientific, technical services (5.2%)
- Metal & metal products (4.5%)
- Motor vehicle & parts dealers (4.1%)
- Real estate & rental & leasing (4.1%)

- Health care (24.8%)
- Educational services (12.7%)
- Department & other general merchandise stores (5.8%)
- Personal & laundry services (5.7%)
- Religious, grantmaking, civic, professional, similar organizations (5.1%)
- Professional, scientific, technical services (4.6%)
- Social assistance (3.7%)
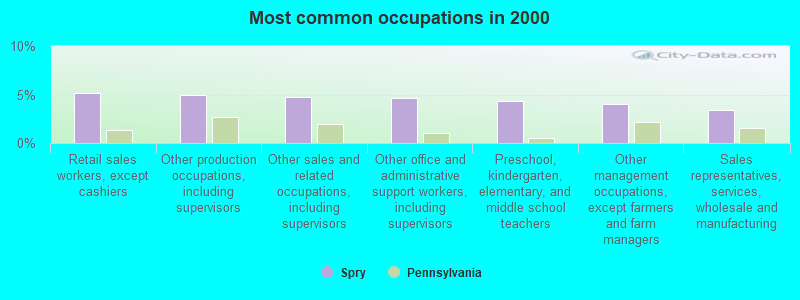
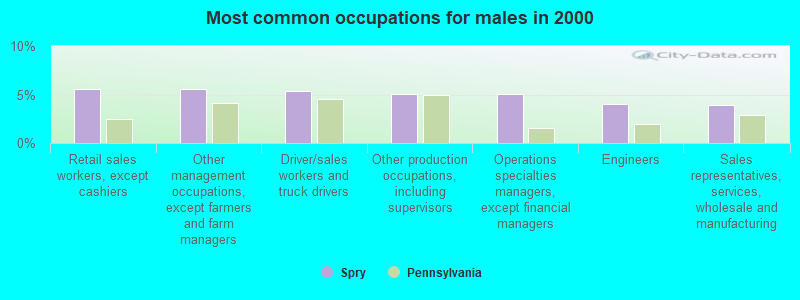
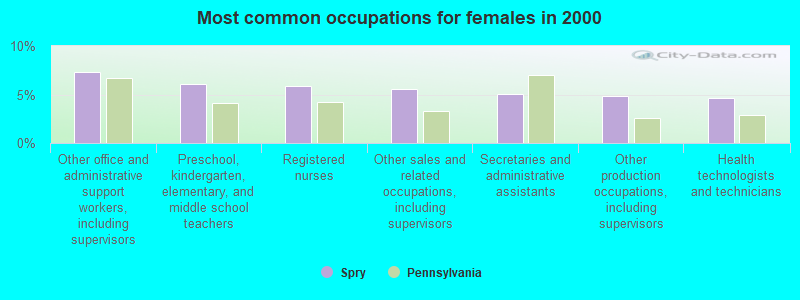
Most common occupations in Spry, PA (%)
Both
Males
Females

- Retail sales workers, except cashiers (5.1%)
- Other production occupations, including supervisors (5.0%)
- Other sales and related occupations, including supervisors (4.7%)
- Other office and administrative support workers, including supervisors (4.7%)
- Preschool, kindergarten, elementary, and middle school teachers (4.3%)
- Other management occupations, except farmers and farm managers (4.0%)
- Sales representatives, services, wholesale and manufacturing (3.4%)

- Retail sales workers, except cashiers (5.6%)
- Other management occupations, except farmers and farm managers (5.5%)
- Driver/sales workers and truck drivers (5.4%)
- Other production occupations, including supervisors (5.1%)
- Operations specialties managers, except financial managers (5.0%)
- Engineers (4.0%)
- Sales representatives, services, wholesale and manufacturing (3.9%)

- Other office and administrative support workers, including supervisors (7.3%)
- Preschool, kindergarten, elementary, and middle school teachers (6.1%)
- Registered nurses (5.9%)
- Other sales and related occupations, including supervisors (5.6%)
- Secretaries and administrative assistants (5.1%)
- Other production occupations, including supervisors (4.8%)
- Health technologists and technicians (4.6%)
Tornado activity:
Spry-area historical tornado activity is slightly above Pennsylvania state average. It is 19% greater than the overall U.S. average.
On 4/5/1952, a category F3 (max. wind speeds 158-206 mph) tornado 3.1 miles away from the Spry place center injured 4 people and caused between $500,000 and $5,000,000 in damages.
On 6/7/1980, a category F3 tornado 17.7 miles away from the place center caused between $50,000 and $500,000 in damages.
Earthquake activity:
Spry-area historical earthquake activity is significantly above Pennsylvania state average. It is 60% smaller than the overall U.S. average.
On 8/23/2011 at 17:51:04, a magnitude 5.8 (5.8 MW, Depth: 3.7 mi, Class: Moderate, Intensity: VI - VII) earthquake occurred 154.0 miles away from the city center
On 1/16/1994 at 01:49:16, a magnitude 4.6 (4.6 MB, 4.6 LG, Depth: 3.1 mi, Class: Light, Intensity: IV - V) earthquake occurred 44.9 miles away from the city center
On 9/25/1998 at 19:52:52, a magnitude 5.2 (4.8 MB, 4.3 MS, 5.2 LG, 4.5 MW, Depth: 3.1 mi) earthquake occurred 223.0 miles away from Spry center
On 1/16/1994 at 00:42:43, a magnitude 4.2 (4.2 MB, 4.0 LG, Depth: 3.1 mi) earthquake occurred 46.0 miles away from the city center
On 10/7/1983 at 10:18:46, a magnitude 5.3 (5.1 MB, 5.3 LG, 5.1 ML) earthquake occurred 304.4 miles away from the city center
On 8/25/2011 at 05:07:52, a magnitude 4.5 (4.5 ML, Depth: 4.2 mi) earthquake occurred 152.4 miles away from Spry center
Magnitude types: regional Lg-wave magnitude (LG), body-wave magnitude (MB), local magnitude (ML), surface-wave magnitude (MS), moment magnitude (MW)
Natural disasters:
The number of natural disasters in York County (18) is near the US average (15).
Major Disasters (Presidential) Declared: 13
Emergencies Declared: 5
Causes of natural disasters: Winter Storms: 5, Floods: 3, Hurricanes: 3, Snowstorms: 3, Storms: 3, Tropical Storms: 3, Blizzard: 1, Heavy Rain: 1, Snowfall: 1, Tropical Depression: 1, Other: 1 (Note: some incidents may be assigned to more than one category).
Hospitals and medical centers near Spry:
- OSS ORTHOPAEDIC HOSPITAL Acute Care Hospitals (about 1 miles away; YORK, PA)
- MANORCARE HEALTH SERVICES-YORK SOUTH (Nursing Home, about 2 miles away; YORK, PA)
- MANORCARE HEALTH SERVICES-DALLASTOWN (Nursing Home, about 3 miles away; DALLASTOWN, PA)
- REST HAVEN-YORK (Nursing Home, about 3 miles away; YORK, PA)
- YORK HOSPITAL Acute Care Hospitals (about 3 miles away; YORK, PA)
- MISERICORDIA NURSING AND REHABILITATION CENTER (Nursing Home, about 4 miles away; YORK, PA)
- COLONIAL MANOR NURSING HOME (Nursing Home, about 4 miles away; YORK, PA)
Amtrak stations near Spry:
- 17 miles: ELIZABETHTOWN (WILSON AVE.) . Services: public payphones, free short-term parking, free long-term parking, call for taxi service.
- 17 miles: MOUNT JOY (DELTA & HENRY STS.) . Services: public payphones, free short-term parking, call for taxi service, public transit connection.
Colleges/universities with over 2000 students nearest to Spry:
- York College Pennsylvania (about 4 miles; York, PA; Full-time enrollment: 5,140)
- YTI Career Institute-York (about 6 miles; York, PA; FT enrollment: 2,212)
- Millersville University of Pennsylvania (about 19 miles; Millersville, PA; FT enrollment: 7,743)
- Pennsylvania State University-Penn State Harrisburg (about 21 miles; Middletown, PA; FT enrollment: 3,797)
- Franklin and Marshall College (about 22 miles; Lancaster, PA; FT enrollment: 2,585)
- Messiah College (about 24 miles; Mechanicsburg, PA; FT enrollment: 3,035)
- McDaniel College (about 29 miles; Westminster, MD; FT enrollment: 2,558)
Average household size:| This place: | 2.3 people |
| Pennsylvania: | 2.5 people |
Percentage of family households:| This place: | 66.7% |
| Whole state: | 65.0% |
Percentage of households with unmarried partners:| This place: | 7.4% |
| Whole state: | 6.6% |
Likely homosexual households (counted as self-reported same-sex unmarried-partner households)
- Lesbian couples: 0.5% of all households
- Gay men: 0.2% of all households
77 people in homes for the mentally retarded in 2000
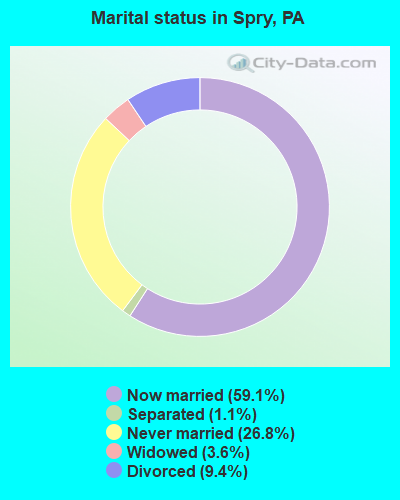
For population 15 years and over in Spry:
- Never married: 26.8%
- Now married: 59.1%
- Separated: 1.1%
- Widowed: 3.6%
- Divorced: 9.4%
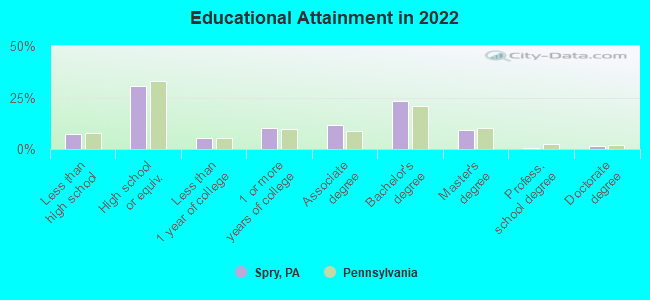
For population 25 years and over in Spry:
- High school or higher: 91.5%
- Bachelor's degree or higher: 34.1%
- Graduate or professional degree: 10.4%
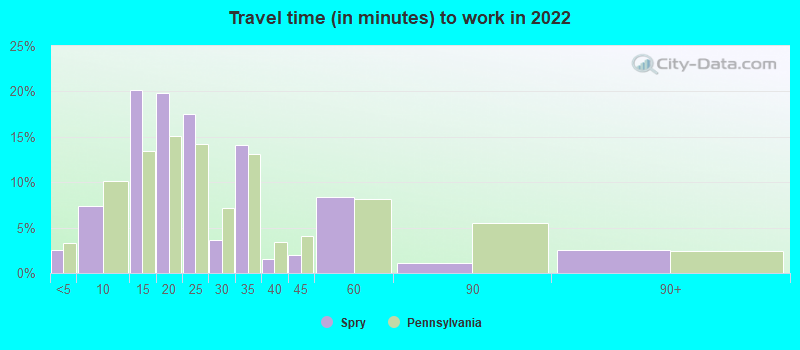
- Unemployed: 4.0%
- Mean travel time to work (commute): 17.5 minutes
Education Gini index (Inequality in education)| Here: | 10.3 |
| Pennsylvania average: | 11.4 |
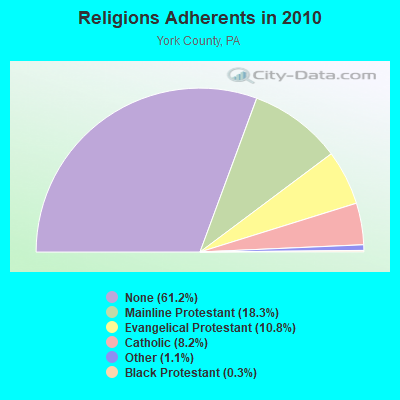
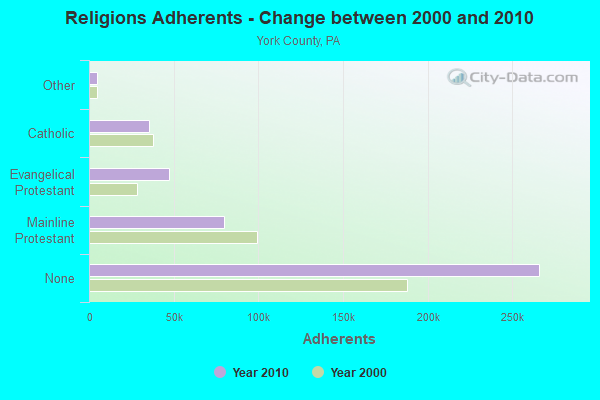
Religion statistics for Spry, PA (based on York County data)
| Religion | Adherents | Congregations |
|---|
| Mainline Protestant | 79,653 | 217 |
| Evangelical Protestant | 47,150 | 222 |
| Catholic | 35,605 | 13 |
| Other | 4,815 | 24 |
| Black Protestant | 1,339 | 10 |
| Orthodox | 400 | 2 |
| None | 266,010 | - |
Food Environment Statistics:
Number of grocery stores: 62| This county: | 1.47 / 10,000 pop. |
| State: | 2.04 / 10,000 pop. |
Number of supercenters and club stores: 5| This county: | 0.12 / 10,000 pop. |
| Pennsylvania: | 0.09 / 10,000 pop. |
Number of convenience stores (no gas): 17| This county: | 0.40 / 10,000 pop. |
| State: | 0.88 / 10,000 pop. |
Number of convenience stores (with gas): 113| York County: | 2.69 / 10,000 pop. |
| State: | 2.52 / 10,000 pop. |
Number of full-service restaurants: 231| Here: | 5.49 / 10,000 pop. |
| State: | 7.12 / 10,000 pop. |
Adult diabetes rate: | This county: | 8.7% |
| Pennsylvania: | 9.1% |
Adult obesity rate: | York County: | 28.7% |
| Pennsylvania: | 27.2% |
Low-income preschool obesity rate: | York County: | 11.9% |
| Pennsylvania: | 11.5% |
Health and Nutrition:
Average overall health of teeth and gums: | This city: | 43.3% |
| State: | 47.1% |
Average BMI: | Here: | 29.1 |
| Pennsylvania: | 28.7 |
People feeling badly about themselves: | Spry: | 23.0% |
| Pennsylvania: | 20.8% |
People not drinking alcohol at all: | This city: | 11.3% |
| Pennsylvania: | 10.9% |
Average hours sleeping at night:
Overweight people: | Spry: | 36.6% |
| Pennsylvania: | 34.3% |
General health condition:
Average condition of hearing: | Spry: | 76.1% |
| Pennsylvania: | 78.3% |
More about Health and Nutrition of Spry, PA Residents
5.22% of this county's 2021 resident taxpayers lived in other counties in 2020 ($59,504 average adjusted gross income)
| Here: | 5.22% |
| Pennsylvania average: | 5.27% |
0.03% of residents moved from foreign countries ($236 average AGI)| York County: | 0.03% |
| Pennsylvania average: | 0.01% |
Top counties from which taxpayers relocated into this county between 2020 and 2021:
4.60% of this county's 2020 resident taxpayers moved to other counties in 2021 ($64,703 average adjusted gross income)
| Here: | 4.60% |
| Pennsylvania average: | 5.44% |
0.02% of residents moved to foreign countries ($241 average AGI)| York County: | 0.02% |
| Pennsylvania average: | 0.01% |
Top counties to which taxpayers relocated from this county between 2020 and 2021:
Strongest AM radio stations in Spry:
- WSBA (910 AM; 5 kW; YORK, PA; Owner: WSBA LICO, INC.)
- WOYK (1350 AM; 5 kW; YORK, PA; Owner: WOYK, INC.)
- WCBM (680 AM; 50 kW; BALTIMORE, MD; Owner: WCBM MARYLAND, INC.)
- WBAL (1090 AM; 50 kW; BALTIMORE, MD; Owner: HEARST RADIO, INC.)
- WGOP (700 AM; daytime; 25 kW; WALKERSVILLE, MD; Owner: BIRACH BROADCASTING CORPORATION)
- WQXA (1250 AM; 1 kW; YORK, PA)
- WTHM (1440 AM; 1 kW; RED LION, PA; Owner: PIONEER BROADCASTING CORPORATION)
- WWLG (1370 AM; 50 kW; BALTIMORE, MD; Owner: M-10 BROADCASTING, INC.)
- WVCH (740 AM; 50 kW; CHESTER, PA; Owner: WVCH COMMUNICATIONS, INC.)
- WMET (1150 AM; 50 kW; GAITHERSBURG, MD; Owner: BELTWAY ACQUISITION CORPORATION)
- WHVR (1280 AM; 5 kW; HANOVER, PA)
- WTEM (980 AM; 50 kW; WASHINGTON, DC; Owner: AMFM RADIO LICENSES, L.L.C.)
- WWJZ (640 AM; 50 kW; MOUNT HOLLY, NJ; Owner: ABC, INC.)
Strongest FM radio stations in Spry:
- WSOX (96.1 FM; RED LION, PA; Owner: LANCASTER-YORK BROADCASTING, LLC)
- WROZ (101.3 FM; LANCASTER, PA; Owner: HALL COMMUNICATIONS, INC.)
- WARM-FM (103.3 FM; YORK, PA; Owner: WSBA LICO, INC.)
- WQXA-FM (105.7 FM; YORK, PA; Owner: CITADEL BROADCASTING COMPANY)
- W220BX (91.9 FM; MARIETTA, PA; Owner: CALVARY CHAPEL OF TWIN FALLS, INC.)
- WHBO (92.7 FM; STARVIEW, PA; Owner: HALL COMMUNICATIONS, INC.)
- WYCR (98.5 FM; YORK-HANOVER, PA; Owner: RADIO HANOVER, INC.)
- WGTY (107.7 FM; GETTYSBURG, PA; Owner: TIMES AND NEWS PUBLISHING COMPANY)
- WCAT-FM (106.7 FM; HERSHEY, PA; Owner: CITADEL BROADCASTING COMPANY)
- WITF-FM (89.5 FM; HARRISBURG, PA; Owner: WITF, INC.)
- WLAN-FM (96.9 FM; LANCASTER, PA; Owner: CLEAR CHANNEL BROADCASTING LICENSES, INC.)
- WTPA (93.5 FM; MECHANICSBURG, PA; Owner: CUMULUS LICENSING CORP.)
- W214AC (90.7 FM; YORK, ETC., PA; Owner: TEMPLE UNIVERSITY, ETC.)
- WDAC (94.5 FM; LANCASTER, PA; Owner: WDAC RADIO COMPANY)
- WIOV-FM (105.1 FM; EPHRATA, PA; Owner: REGENT BROADCASTING OF LANCASTER, INC.)
- WWMX (106.5 FM; BALTIMORE, MD; Owner: INFINITY RADIO OPERATIONS INC.)
- WRVV (97.3 FM; HARRISBURG, PA; Owner: CLEAR CHANNEL BROADCASTING LICENSES, INC.)
- WHKF (99.3 FM; HARRISBURG, PA; Owner: CLEAR CHANNEL BROADCASTING LICENSES, INC.)
- WLIF (101.9 FM; BALTIMORE, MD; Owner: INFINITY WLIF, INC.)
- WZBA (100.7 FM; WESTMINSTER, MD; Owner: SHAMROCK COMMUNICATIONS, INC.)
TV broadcast stations around Spry:
- W23AY (Channel 23; YORK, PA; Owner: WIRELESS CABLE TV OF PA, INC.)
- WPMT (Channel 43; YORK, PA; Owner: TRIBUNE TELEVISION COMPANY)
- WGAL (Channel 8; LANCASTER, PA; Owner: WGAL HEARST-ARGYLE TELEVISION, INC.)
- WGCB-TV (Channel 49; RED LION, PA; Owner: RED LION BROADCASTING CO., INC.)
- WLYH-TV (Channel 15; LANCASTER, PA; Owner: TELEVISION STATION GROUP LICENSE SUBSIDIARY, LLC)
- WMPB (Channel 67; BALTIMORE, MD; Owner: MARYLAND PUBLIC BROADCASTING COMMISSION)
- WBAL-TV (Channel 11; BALTIMORE, MD; Owner: WBAL HEARST-ARGYLE TV, INC. (CA CORP.))
- WMAR-TV (Channel 2; BALTIMORE, MD; Owner: SCRIPPS HOWARD BROADCASTING COMPANY)
- WBFF (Channel 45; BALTIMORE, MD; Owner: CHESAPEAKE TELEVISION LICENSEE, LLC)
- WNUV (Channel 54; BALTIMORE, MD; Owner: BALTIMORE (WNUV-TV) LICENSEE, INC.)
- WJZ-TV (Channel 13; BALTIMORE, MD; Owner: VIACOM INC.)
- WITF-TV (Channel 33; HARRISBURG, PA; Owner: WITF, INC.)
- WHTM-TV (Channel 27; HARRISBURG, PA; Owner: HARRISBURG TELEVISION, INC.)
- WHP-TV (Channel 21; HARRISBURG, PA; Owner: CLEAR CHANNEL BROADCASTING LICENSES, INC.)
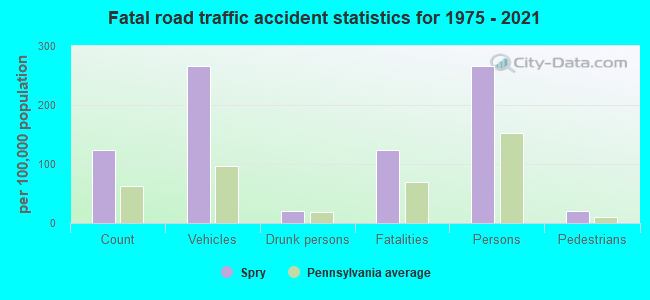
Spry fatal accident list:
Apr 18, 2021 04:03 PM, I-83 Vfw Of Us Mem Hwy, Lat: 39.916828, Lon: -76.704431, Vehicles: 5, Persons: 4, Pedestrians: 1, Fatalities: 1
Sep 4, 2013 10:04 AM, Saint Charles Way, Lat: 39.930019, Lon: -76.690053, Vehicles: 1, Persons: 1, Fatalities: 1
Dec 7, 2006 04:19 PM, Sr-74, Allegheny Dr, Lat: 39.909280, Lon: -76.681170, Vehicles: 2, Persons: 2, Fatalities: 1
Oct 12, 2004 02:49 PM, Sr-74, Lat: 39.929174, Lon: -76.687016, Vehicles: 1, Persons: 1, Fatalities: 1
Feb 10, 2000 09:35 PM, Sr-74, Lat: 39.907261, Lon: -76.679932, Vehicles: 2, Persons: 3, Fatalities: 1
May 18, 1999 11:08 PM, Sr-74, Lat: 39.907261, Lon: -76.679932, Vehicles: 2, Persons: 2, Fatalities: 1, Drunk persons involved: 1
- National Bridge Inventory (NBI) Statistics
- 16Number of bridges
- 85ft / 25.8mTotal length
- $4,066,000Total costs
- 246,732Total average daily traffic
- 32,225Total average daily truck traffic


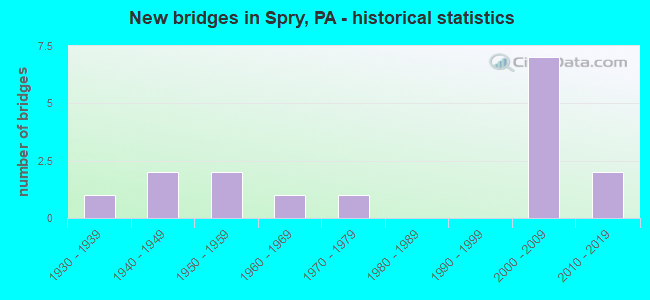
- New bridges - historical statistics
- 11930-1939
- 21940-1949
- 21950-1959
- 11960-1969
- 11970-1979
- 72000-2009
- 22010-2019
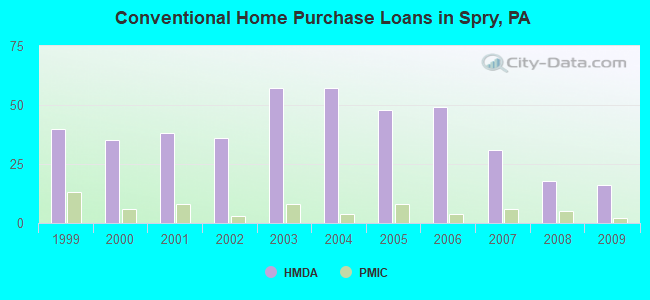
Home Mortgage Disclosure Act Aggregated Statistics For Year 2009
(Based on 1 partial tract)
|
| A) FHA, FSA/RHS & VA
Home Purchase Loans | B) Conventional
Home Purchase Loans | C) Refinancings
| D) Home Improvement Loans
| F) Non-occupant Loans on
< 5 Family Dwellings (A B C & D) | G) Loans On Manufactured
Home Dwelling (A B C & D) |
|---|
| Number | Average Value | Number | Average Value | Number | Average Value | Number | Average Value | Number | Average Value | Number | Average Value |
|---|
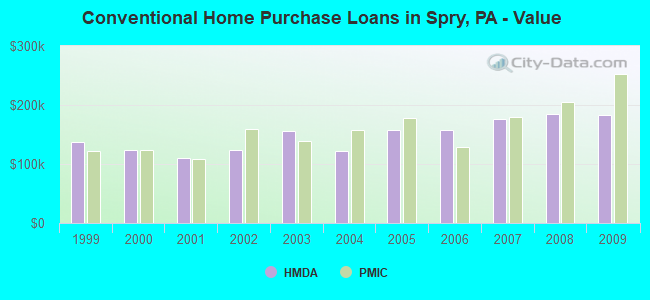
| LOANS ORIGINATED | 16 | $187,699 | 16 | $182,810 | 74 | $181,219 | 10 | $77,388 | 3 | $157,857 | 0 | $0 |
| APPLICATIONS APPROVED, NOT ACCEPTED | 1 | $107,990 | 1 | $96,160 | 7 | $205,683 | 0 | $0 | 0 | $0 | 0 | $0 |
| APPLICATIONS DENIED | 2 | $104,750 | 3 | $137,883 | 16 | $184,766 | 1 | $65,250 | 1 | $63,350 | 1 | $17,940 |
| APPLICATIONS WITHDRAWN | 0 | $0 | 1 | $78,990 | 11 | $190,245 | 2 | $37,205 | 0 | $0 | 0 | $0 |
| FILES CLOSED FOR INCOMPLETENESS | 0 | $0 | 0 | $0 | 5 | $161,340 | 0 | $0 | 0 | $0 | 0 | $0 |
Aggregated Statistics For Year 2008
(Based on 1 partial tract)
|
| A) FHA, FSA/RHS & VA
Home Purchase Loans | B) Conventional
Home Purchase Loans | C) Refinancings
| D) Home Improvement Loans
| F) Non-occupant Loans on
< 5 Family Dwellings (A B C & D) | G) Loans On Manufactured
Home Dwelling (A B C & D) |
|---|
| Number | Average Value | Number | Average Value | Number | Average Value | Number | Average Value | Number | Average Value | Number | Average Value |
|---|
| LOANS ORIGINATED | 6 | $176,872 | 18 | $184,016 | 46 | $147,712 | 10 | $56,782 | 4 | $151,878 | 1 | $144,630 |
| APPLICATIONS APPROVED, NOT ACCEPTED | 0 | $0 | 2 | $147,105 | 7 | $164,251 | 1 | $132,420 | 0 | $0 | 0 | $0 |
| APPLICATIONS DENIED | 0 | $0 | 1 | $24,040 | 27 | $159,085 | 8 | $93,158 | 0 | $0 | 1 | $28,240 |
| APPLICATIONS WITHDRAWN | 1 | $125,160 | 2 | $363,855 | 13 | $178,501 | 2 | $106,275 | 1 | $137,380 | 0 | $0 |
| FILES CLOSED FOR INCOMPLETENESS | 0 | $0 | 0 | $0 | 3 | $203,773 | 0 | $0 | 0 | $0 | 0 | $0 |
Aggregated Statistics For Year 2007
(Based on 1 partial tract)
|
| A) FHA, FSA/RHS & VA
Home Purchase Loans | B) Conventional
Home Purchase Loans | C) Refinancings
| D) Home Improvement Loans
| F) Non-occupant Loans on
< 5 Family Dwellings (A B C & D) | G) Loans On Manufactured
Home Dwelling (A B C & D) |
|---|
| Number | Average Value | Number | Average Value | Number | Average Value | Number | Average Value | Number | Average Value | Number | Average Value |
|---|
| LOANS ORIGINATED | 3 | $212,807 | 31 | $176,582 | 46 | $153,718 | 15 | $50,320 | 5 | $179,504 | 1 | $9,160 |
| APPLICATIONS APPROVED, NOT ACCEPTED | 0 | $0 | 3 | $139,793 | 7 | $138,194 | 3 | $54,187 | 1 | $99,600 | 0 | $0 |
| APPLICATIONS DENIED | 0 | $0 | 4 | $80,708 | 22 | $173,610 | 6 | $61,310 | 1 | $136,230 | 1 | $35,870 |
| APPLICATIONS WITHDRAWN | 0 | $0 | 1 | $151,500 | 13 | $141,222 | 3 | $39,303 | 0 | $0 | 0 | $0 |
| FILES CLOSED FOR INCOMPLETENESS | 0 | $0 | 0 | $0 | 5 | $192,174 | 0 | $0 | 0 | $0 | 0 | $0 |
Aggregated Statistics For Year 2006
(Based on 1 partial tract)
|
| A) FHA, FSA/RHS & VA
Home Purchase Loans | B) Conventional
Home Purchase Loans | C) Refinancings
| D) Home Improvement Loans
| F) Non-occupant Loans on
< 5 Family Dwellings (A B C & D) | G) Loans On Manufactured
Home Dwelling (A B C & D) |
|---|
| Number | Average Value | Number | Average Value | Number | Average Value | Number | Average Value | Number | Average Value | Number | Average Value |
|---|
| LOANS ORIGINATED | 2 | $229,150 | 49 | $158,239 | 58 | $140,159 | 19 | $58,304 | 5 | $96,240 | 1 | $32,820 |
| APPLICATIONS APPROVED, NOT ACCEPTED | 0 | $0 | 4 | $114,385 | 9 | $120,501 | 2 | $20,605 | 0 | $0 | 1 | $36,250 |
| APPLICATIONS DENIED | 0 | $0 | 5 | $122,646 | 20 | $167,102 | 8 | $42,644 | 1 | $49,230 | 1 | $12,590 |
| APPLICATIONS WITHDRAWN | 0 | $0 | 3 | $131,780 | 23 | $183,284 | 2 | $33,390 | 1 | $64,870 | 0 | $0 |
| FILES CLOSED FOR INCOMPLETENESS | 0 | $0 | 1 | $93,490 | 5 | $193,930 | 0 | $0 | 0 | $0 | 0 | $0 |
Aggregated Statistics For Year 2005
(Based on 1 partial tract)
|
| A) FHA, FSA/RHS & VA
Home Purchase Loans | B) Conventional
Home Purchase Loans | C) Refinancings
| D) Home Improvement Loans
| F) Non-occupant Loans on
< 5 Family Dwellings (A B C & D) |
|---|
| Number | Average Value | Number | Average Value | Number | Average Value | Number | Average Value | Number | Average Value |
|---|
| LOANS ORIGINATED | 3 | $171,083 | 48 | $157,490 | 60 | $136,632 | 12 | $69,006 | 6 | $110,347 |
| APPLICATIONS APPROVED, NOT ACCEPTED | 0 | $0 | 4 | $77,178 | 9 | $125,716 | 2 | $53,235 | 0 | $0 |
| APPLICATIONS DENIED | 0 | $0 | 3 | $157,857 | 31 | $148,319 | 6 | $62,900 | 0 | $0 |
| APPLICATIONS WITHDRAWN | 0 | $0 | 3 | $117,533 | 26 | $143,496 | 2 | $44,840 | 0 | $0 |
| FILES CLOSED FOR INCOMPLETENESS | 0 | $0 | 0 | $0 | 5 | $134,094 | 1 | $17,940 | 0 | $0 |
Aggregated Statistics For Year 2004
(Based on 1 partial tract)
|
| A) FHA, FSA/RHS & VA
Home Purchase Loans | B) Conventional
Home Purchase Loans | C) Refinancings
| D) Home Improvement Loans
| F) Non-occupant Loans on
< 5 Family Dwellings (A B C & D) | G) Loans On Manufactured
Home Dwelling (A B C & D) |
|---|
| Number | Average Value | Number | Average Value | Number | Average Value | Number | Average Value | Number | Average Value | Number | Average Value |
|---|
| LOANS ORIGINATED | 5 | $157,678 | 57 | $121,463 | 69 | $133,306 | 13 | $33,904 | 7 | $130,561 | 0 | $0 |
| APPLICATIONS APPROVED, NOT ACCEPTED | 0 | $0 | 4 | $156,170 | 11 | $183,480 | 2 | $38,160 | 0 | $0 | 0 | $0 |
| APPLICATIONS DENIED | 0 | $0 | 2 | $138,710 | 27 | $117,434 | 9 | $39,304 | 1 | $42,360 | 1 | $41,210 |
| APPLICATIONS WITHDRAWN | 0 | $0 | 5 | $113,564 | 18 | $128,451 | 2 | $28,430 | 1 | $43,880 | 0 | $0 |
| FILES CLOSED FOR INCOMPLETENESS | 0 | $0 | 1 | $38,540 | 8 | $131,986 | 1 | $29,380 | 0 | $0 | 0 | $0 |
Aggregated Statistics For Year 2003
(Based on 1 partial tract)
|
| A) FHA, FSA/RHS & VA
Home Purchase Loans | B) Conventional
Home Purchase Loans | C) Refinancings
| D) Home Improvement Loans
| F) Non-occupant Loans on
< 5 Family Dwellings (A B C & D) |
|---|
| Number | Average Value | Number | Average Value | Number | Average Value | Number | Average Value | Number | Average Value |
|---|
| LOANS ORIGINATED | 8 | $124,449 | 57 | $156,530 | 177 | $130,057 | 11 | $35,385 | 7 | $131,979 |
| APPLICATIONS APPROVED, NOT ACCEPTED | 0 | $0 | 3 | $91,330 | 19 | $128,338 | 1 | $38,160 | 2 | $67,925 |
| APPLICATIONS DENIED | 0 | $0 | 6 | $157,028 | 19 | $109,740 | 5 | $12,288 | 0 | $0 |
| APPLICATIONS WITHDRAWN | 0 | $0 | 2 | $112,955 | 15 | $146,891 | 1 | $18,700 | 0 | $0 |
| FILES CLOSED FOR INCOMPLETENESS | 0 | $0 | 1 | $171,340 | 3 | $119,440 | 1 | $16,030 | 0 | $0 |
Aggregated Statistics For Year 2002
(Based on 1 partial tract)
|
| A) FHA, FSA/RHS & VA
Home Purchase Loans | B) Conventional
Home Purchase Loans | C) Refinancings
| D) Home Improvement Loans
| F) Non-occupant Loans on
< 5 Family Dwellings (A B C & D) |
|---|
| Number | Average Value | Number | Average Value | Number | Average Value | Number | Average Value | Number | Average Value |
|---|
| LOANS ORIGINATED | 9 | $111,512 | 36 | $123,755 | 97 | $135,315 | 10 | $23,278 | 4 | $139,475 |
| APPLICATIONS APPROVED, NOT ACCEPTED | 1 | $89,680 | 3 | $140,683 | 14 | $111,591 | 1 | $21,370 | 2 | $86,625 |
| APPLICATIONS DENIED | 1 | $119,060 | 3 | $56,603 | 13 | $98,775 | 1 | $3,430 | 0 | $0 |
| APPLICATIONS WITHDRAWN | 0 | $0 | 3 | $107,740 | 13 | $126,075 | 3 | $14,120 | 0 | $0 |
| FILES CLOSED FOR INCOMPLETENESS | 0 | $0 | 0 | $0 | 3 | $127,073 | 0 | $0 | 0 | $0 |
Aggregated Statistics For Year 2001
(Based on 1 partial tract)
|
| A) FHA, FSA/RHS & VA
Home Purchase Loans | B) Conventional
Home Purchase Loans | C) Refinancings
| D) Home Improvement Loans
| F) Non-occupant Loans on
< 5 Family Dwellings (A B C & D) |
|---|
| Number | Average Value | Number | Average Value | Number | Average Value | Number | Average Value | Number | Average Value |
|---|
| LOANS ORIGINATED | 12 | $110,568 | 38 | $110,694 | 71 | $130,437 | 13 | $38,806 | 2 | $86,625 |
| APPLICATIONS APPROVED, NOT ACCEPTED | 0 | $0 | 3 | $84,717 | 8 | $91,489 | 3 | $21,497 | 0 | $0 |
| APPLICATIONS DENIED | 1 | $62,200 | 3 | $77,973 | 12 | $129,394 | 3 | $23,787 | 0 | $0 |
| APPLICATIONS WITHDRAWN | 1 | $92,350 | 3 | $86,750 | 12 | $91,934 | 3 | $29,510 | 0 | $0 |
| FILES CLOSED FOR INCOMPLETENESS | 0 | $0 | 0 | $0 | 4 | $121,350 | 0 | $0 | 0 | $0 |
Aggregated Statistics For Year 2000
(Based on 1 partial tract)
|
| A) FHA, FSA/RHS & VA
Home Purchase Loans | B) Conventional
Home Purchase Loans | C) Refinancings
| D) Home Improvement Loans
| F) Non-occupant Loans on
< 5 Family Dwellings (A B C & D) |
|---|
| Number | Average Value | Number | Average Value | Number | Average Value | Number | Average Value | Number | Average Value |
|---|
| LOANS ORIGINATED | 8 | $93,301 | 35 | $124,489 | 22 | $94,567 | 10 | $19,500 | 3 | $49,100 |
| APPLICATIONS APPROVED, NOT ACCEPTED | 0 | $0 | 5 | $123,410 | 9 | $89,761 | 3 | $19,970 | 0 | $0 |
| APPLICATIONS DENIED | 1 | $116,770 | 7 | $75,557 | 12 | $68,720 | 5 | $49,302 | 0 | $0 |
| APPLICATIONS WITHDRAWN | 1 | $89,680 | 2 | $64,110 | 5 | $114,708 | 1 | $32,050 | 0 | $0 |
| FILES CLOSED FOR INCOMPLETENESS | 0 | $0 | 0 | $0 | 0 | $0 | 0 | $0 | 0 | $0 |
Aggregated Statistics For Year 1999
(Based on 1 partial tract)
|
| A) FHA, FSA/RHS & VA
Home Purchase Loans | B) Conventional
Home Purchase Loans | C) Refinancings
| D) Home Improvement Loans
| F) Non-occupant Loans on
< 5 Family Dwellings (A B C & D) |
|---|
| Number | Average Value | Number | Average Value | Number | Average Value | Number | Average Value | Number | Average Value |
|---|
| LOANS ORIGINATED | 7 | $104,827 | 40 | $137,980 | 47 | $98,216 | 12 | $40,576 | 2 | $90,725 |
| APPLICATIONS APPROVED, NOT ACCEPTED | 0 | $0 | 3 | $31,827 | 12 | $90,282 | 1 | $24,730 | 0 | $0 |
| APPLICATIONS DENIED | 0 | $0 | 2 | $69,995 | 13 | $72,130 | 6 | $16,483 | 1 | $62,770 |
| APPLICATIONS WITHDRAWN | 0 | $0 | 4 | $134,948 | 11 | $110,904 | 1 | $69,610 | 0 | $0 |
| FILES CLOSED FOR INCOMPLETENESS | 0 | $0 | 1 | $122,870 | 1 | $132,380 | 0 | $0 | 0 | $0 |
Detailed HMDA statistics for the following Tracts:
0228.00
Private Mortgage Insurance Companies Aggregated Statistics For Year 2009
(Based on 1 partial tract)
|
| A) Conventional
Home Purchase Loans |
|---|
| Number | Average Value |
|---|
| LOANS ORIGINATED | 2 | $252,240 |
| APPLICATIONS APPROVED, NOT ACCEPTED | 1 | $116,390 |
| APPLICATIONS DENIED | 2 | $174,775 |
| APPLICATIONS WITHDRAWN | 0 | $0 |
| FILES CLOSED FOR INCOMPLETENESS | 0 | $0 |
Aggregated Statistics For Year 2008
(Based on 1 partial tract)
|
| A) Conventional
Home Purchase Loans | B) Refinancings
|
|---|
| Number | Average Value | Number | Average Value |
|---|
| LOANS ORIGINATED | 5 | $205,682 | 5 | $175,842 |
| APPLICATIONS APPROVED, NOT ACCEPTED | 0 | $0 | 1 | $277,040 |
| APPLICATIONS DENIED | 0 | $0 | 0 | $0 |
| APPLICATIONS WITHDRAWN | 0 | $0 | 0 | $0 |
| FILES CLOSED FOR INCOMPLETENESS | 0 | $0 | 0 | $0 |
Aggregated Statistics For Year 2007
(Based on 1 partial tract)
|
| A) Conventional
Home Purchase Loans | B) Refinancings
|
|---|
| Number | Average Value | Number | Average Value |
|---|
| LOANS ORIGINATED | 6 | $179,797 | 3 | $199,830 |
| APPLICATIONS APPROVED, NOT ACCEPTED | 0 | $0 | 2 | $139,285 |
| APPLICATIONS DENIED | 0 | $0 | 0 | $0 |
| APPLICATIONS WITHDRAWN | 0 | $0 | 0 | $0 |
| FILES CLOSED FOR INCOMPLETENESS | 0 | $0 | 0 | $0 |
Aggregated Statistics For Year 2006
(Based on 1 partial tract)
|
| A) Conventional
Home Purchase Loans | B) Refinancings
|
|---|
| Number | Average Value | Number | Average Value |
|---|
| LOANS ORIGINATED | 4 | $128,122 | 2 | $238,690 |
| APPLICATIONS APPROVED, NOT ACCEPTED | 2 | $224,190 | 0 | $0 |
| APPLICATIONS DENIED | 0 | $0 | 0 | $0 |
| APPLICATIONS WITHDRAWN | 0 | $0 | 0 | $0 |
| FILES CLOSED FOR INCOMPLETENESS | 0 | $0 | 0 | $0 |
Aggregated Statistics For Year 2005
(Based on 1 partial tract)
|
| A) Conventional
Home Purchase Loans | B) Refinancings
| C) Non-occupant Loans on
< 5 Family Dwellings (A & B) |
|---|
| Number | Average Value | Number | Average Value | Number | Average Value |
|---|
| LOANS ORIGINATED | 8 | $178,111 | 3 | $132,923 | 1 | $82,430 |
| APPLICATIONS APPROVED, NOT ACCEPTED | 1 | $90,060 | 1 | $150,730 | 0 | $0 |
| APPLICATIONS DENIED | 0 | $0 | 0 | $0 | 0 | $0 |
| APPLICATIONS WITHDRAWN | 0 | $0 | 0 | $0 | 0 | $0 |
| FILES CLOSED FOR INCOMPLETENESS | 0 | $0 | 0 | $0 | 0 | $0 |
Aggregated Statistics For Year 2004
(Based on 1 partial tract)
|
| A) Conventional
Home Purchase Loans | B) Refinancings
| C) Non-occupant Loans on
< 5 Family Dwellings (A & B) |
|---|
| Number | Average Value | Number | Average Value | Number | Average Value |
|---|
| LOANS ORIGINATED | 4 | $158,460 | 5 | $121,884 | 0 | $0 |
| APPLICATIONS APPROVED, NOT ACCEPTED | 2 | $144,245 | 2 | $143,670 | 0 | $0 |
| APPLICATIONS DENIED | 0 | $0 | 0 | $0 | 0 | $0 |
| APPLICATIONS WITHDRAWN | 1 | $59,150 | 0 | $0 | 1 | $59,150 |
| FILES CLOSED FOR INCOMPLETENESS | 0 | $0 | 0 | $0 | 0 | $0 |
Aggregated Statistics For Year 2003
(Based on 1 partial tract)
|
| A) Conventional
Home Purchase Loans | B) Refinancings
|
|---|
| Number | Average Value | Number | Average Value |
|---|
| LOANS ORIGINATED | 8 | $139,761 | 15 | $139,665 |
| APPLICATIONS APPROVED, NOT ACCEPTED | 2 | $180,880 | 2 | $117,915 |
| APPLICATIONS DENIED | 0 | $0 | 0 | $0 |
| APPLICATIONS WITHDRAWN | 0 | $0 | 0 | $0 |
| FILES CLOSED FOR INCOMPLETENESS | 0 | $0 | 0 | $0 |
Aggregated Statistics For Year 2002
(Based on 1 partial tract)
|
| A) Conventional
Home Purchase Loans | B) Refinancings
|
|---|
| Number | Average Value | Number | Average Value |
|---|
| LOANS ORIGINATED | 3 | $159,380 | 6 | $121,477 |
| APPLICATIONS APPROVED, NOT ACCEPTED | 1 | $162,560 | 0 | $0 |
| APPLICATIONS DENIED | 0 | $0 | 0 | $0 |
| APPLICATIONS WITHDRAWN | 0 | $0 | 0 | $0 |
| FILES CLOSED FOR INCOMPLETENESS | 0 | $0 | 0 | $0 |
Aggregated Statistics For Year 2001
(Based on 1 partial tract)
|
| A) Conventional
Home Purchase Loans | B) Refinancings
|
|---|
| Number | Average Value | Number | Average Value |
|---|
| LOANS ORIGINATED | 8 | $107,850 | 8 | $124,211 |
| APPLICATIONS APPROVED, NOT ACCEPTED | 1 | $185,080 | 1 | $99,220 |
| APPLICATIONS DENIED | 0 | $0 | 0 | $0 |
| APPLICATIONS WITHDRAWN | 0 | $0 | 0 | $0 |
| FILES CLOSED FOR INCOMPLETENESS | 0 | $0 | 0 | $0 |
Aggregated Statistics For Year 2000
(Based on 1 partial tract)
|
| A) Conventional
Home Purchase Loans | B) Refinancings
|
|---|
| Number | Average Value | Number | Average Value |
|---|
| LOANS ORIGINATED | 6 | $124,147 | 2 | $130,315 |
| APPLICATIONS APPROVED, NOT ACCEPTED | 1 | $41,590 | 0 | $0 |
| APPLICATIONS DENIED | 0 | $0 | 0 | $0 |
| APPLICATIONS WITHDRAWN | 0 | $0 | 0 | $0 |
| FILES CLOSED FOR INCOMPLETENESS | 0 | $0 | 0 | $0 |
Aggregated Statistics For Year 1999
(Based on 1 partial tract)
|
| A) Conventional
Home Purchase Loans | B) Refinancings
|
|---|
| Number | Average Value | Number | Average Value |
|---|
| LOANS ORIGINATED | 13 | $122,665 | 4 | $101,758 |
| APPLICATIONS APPROVED, NOT ACCEPTED | 1 | $104,610 | 1 | $107,270 |
| APPLICATIONS DENIED | 0 | $0 | 0 | $0 |
| APPLICATIONS WITHDRAWN | 0 | $0 | 0 | $0 |
| FILES CLOSED FOR INCOMPLETENESS | 0 | $0 | 0 | $0 |
Detailed PMIC statistics for the following Tracts:
0228.00
Spry compared to Pennsylvania state average:
- Unemployed percentage significantly below state average.
- Black race population percentage significantly below state average.
- Hispanic race population percentage significantly below state average.
- Foreign-born population percentage significantly below state average.
- Length of stay since moving in significantly above state average.
- House age below state average.
- #36 on the list of "Top 101 cities with the most residents born in Other Western Asia (population 500+)"
- #74 on the list of "Top 101 cities with the largest percentage of people in homes for the mentally retarded (population 1,000+)"
- #16 on the list of "Top 101 counties with the most Mainline Protestant congregations"
- #29 on the list of "Top 101 counties with the most Mainline Protestant adherents"
- #81 on the list of "Top 101 counties with the lowest percentage of residents relocating to other counties in 2011"
- #95 on the list of "Top 101 counties with the lowest number of infant deaths per 1000 residents 2007-2013 (pop. 50,000+)"