Pleasant Hills, Maryland
Submit your own pictures of this place and show them to the world
- OSM Map
- General Map
- Google Map
- MSN Map
- OSM Map
- General Map
- Google Map
- MSN Map
- OSM Map
- General Map
- Google Map
- MSN Map
- OSM Map
- General Map
- Google Map
- MSN Map
Please wait while loading the map...
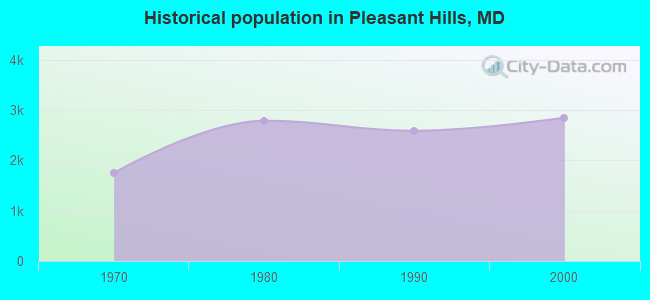
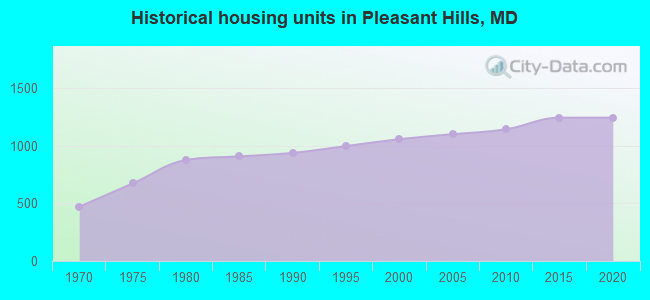
Population in 2010: 3,379.
Population change since 2000: +18.5%
| Males: 1,705 |  (50.5%) (50.5%) |
| Females: 1,674 |  (49.5%) (49.5%) |
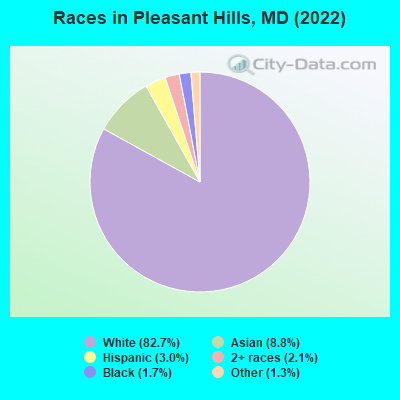
(0.9% for White Non-Hispanic residents, 30.3% for Black residents)
Business Search - 14 Million verified businesses
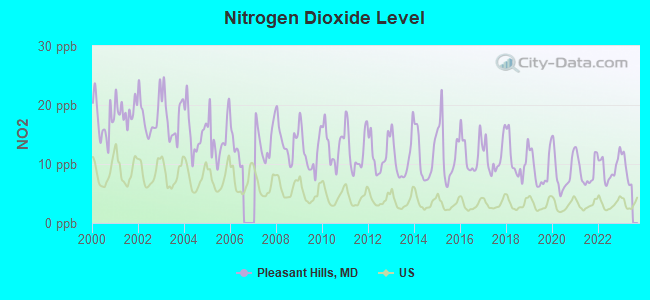
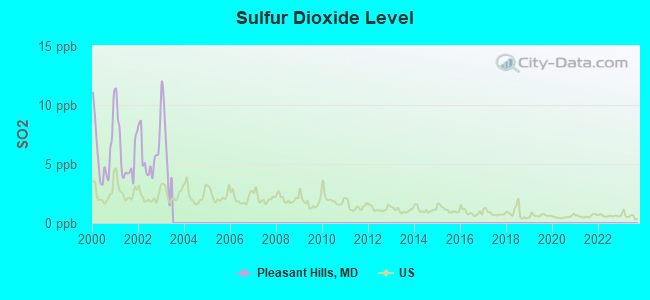
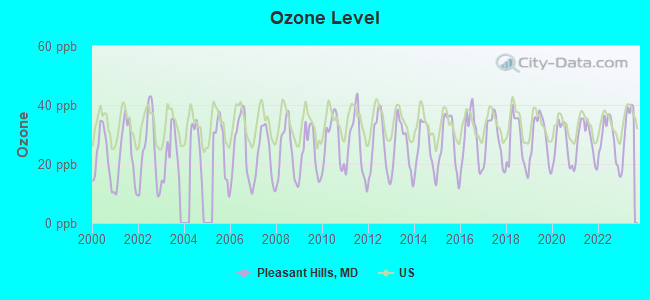
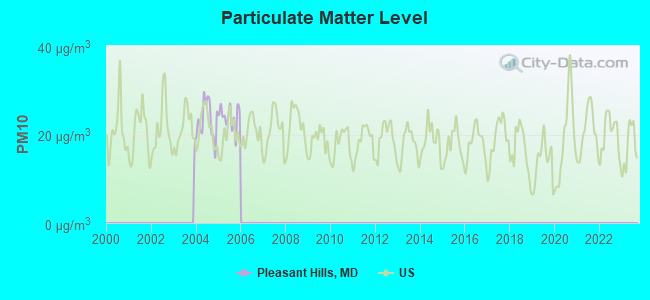
Data:
 Recent articles from our blog. Our writers, many of them Ph.D. graduates or candidates, create easy-to-read articles on a wide variety of topics.
Latest news from Pleasant Hills, MD collected exclusively by city-data.com from local newspapers, TV, and radio stations
Ancestries: German (20.1%), English (10.0%), Italian (7.0%), European (6.3%), Irish (5.7%), Polish (5.1%).
Current Local Time: EST time zone
Land area: 4.37 square miles.
Population density: 773 people per square mile (low).
210 residents are foreign born (4.0% Asia, 0.8% Europe).
| This place: | 5.3% |
| Maryland: | 15.7% |
Median real estate property taxes paid for housing units with mortgages in 2022: $3,681 (0.8%)
Median real estate property taxes paid for housing units with no mortgage in 2022: $3,803 (0.9%)
Nearest city with pop. 50,000+: Towson, MD  (13.1 miles , pop. 51,793).
Nearest city with pop. 200,000+: Baltimore, MD (17.1 miles , pop. 651,154).
Nearest city with pop. 1,000,000+: Philadelphia, PA (75.3 miles , pop. 1,517,550).
Nearest cities:
Latitude: 39.49 N, Longitude: 76.39 W
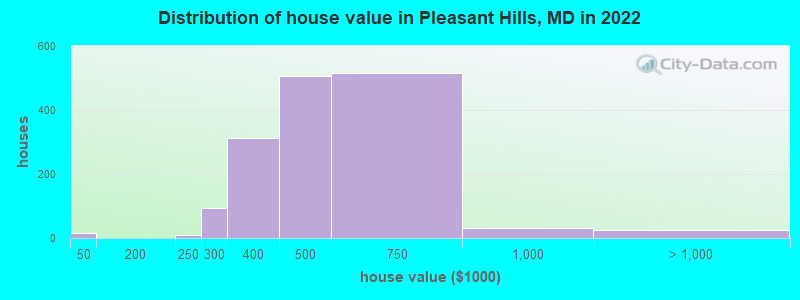
Property values in Pleasant Hills, MD
Unemployment in December 2023:
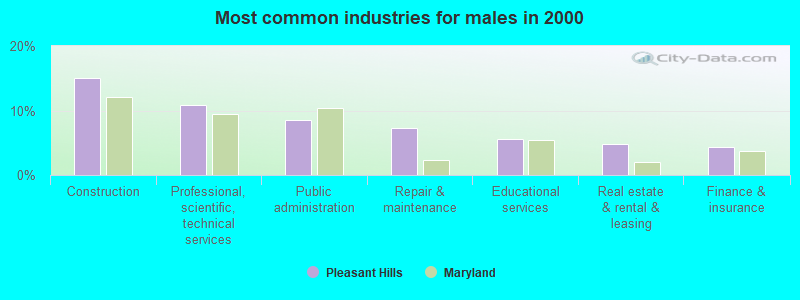
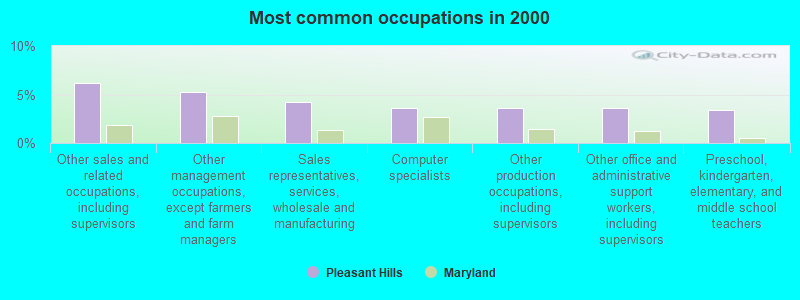
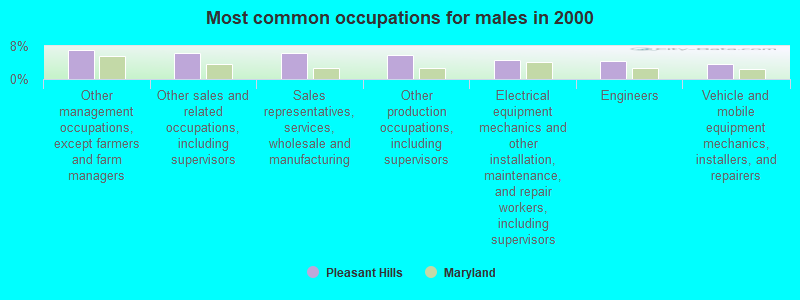
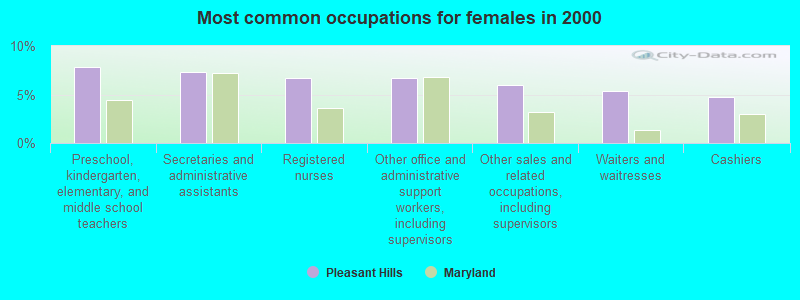
Most common occupations in Pleasant Hills, MD (%)
Both
Males
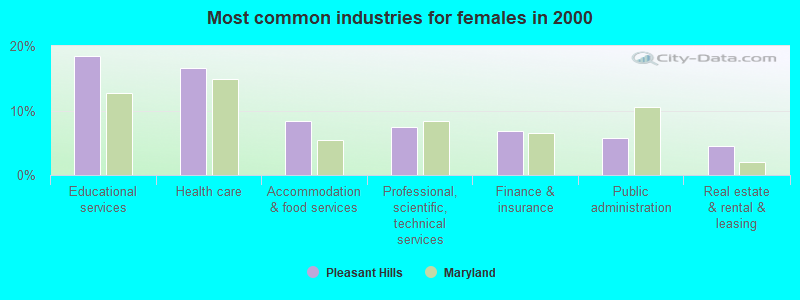
Females


- Other sales and related occupations, including supervisors (6.2%)
- Other management occupations, except farmers and farm managers (5.2%)
- Sales representatives, services, wholesale and manufacturing (4.3%)
- Computer specialists (3.6%)
- Other production occupations, including supervisors (3.6%)
- Other office and administrative support workers, including supervisors (3.6%)
- Preschool, kindergarten, elementary, and middle school teachers (3.4%)

- Other management occupations, except farmers and farm managers (7.1%)
- Other sales and related occupations, including supervisors (6.4%)
- Sales representatives, services, wholesale and manufacturing (6.4%)
- Other production occupations, including supervisors (5.8%)
- Electrical equipment mechanics and other installation, maintenance, and repair workers, including supervisors (4.7%)
- Engineers (4.3%)
- Vehicle and mobile equipment mechanics, installers, and repairers (3.7%)

- Preschool, kindergarten, elementary, and middle school teachers (7.8%)
- Secretaries and administrative assistants (7.3%)
- Registered nurses (6.7%)
- Other office and administrative support workers, including supervisors (6.7%)
- Other sales and related occupations, including supervisors (6.0%)
- Waiters and waitresses (5.4%)
- Cashiers (4.7%)
Tornado activity:
Pleasant Hills-area historical tornado activity is slightly above Maryland state average. It is 19% greater than the overall U.S. average.
On 6/9/1961, a category F3 (max. wind speeds 158-206 mph) tornado 21.4 miles away from the Pleasant Hills place center caused between $50,000 and $500,000 in damages.
On 9/24/2001, a category F3 tornado 29.2 miles away from the place center killed 2 people and injured 55 people and caused $101 million in damages.
Earthquake activity:
Pleasant Hills-area historical earthquake activity is significantly above Maryland state average. It is 61% smaller than the overall U.S. average.
On 8/23/2011 at 17:51:04, a magnitude 5.8 (5.8 MW, Depth: 3.7 mi, Class: Moderate, Intensity: VI - VII) earthquake occurred 137.1 miles away from the city center
On 1/16/1994 at 01:49:16, a magnitude 4.6 (4.6 MB, 4.6 LG, Depth: 3.1 mi, Class: Light, Intensity: IV - V) earthquake occurred 61.4 miles away from Pleasant Hills center
On 9/25/1998 at 19:52:52, a magnitude 5.2 (4.8 MB, 4.3 MS, 5.2 LG, 4.5 MW, Depth: 3.1 mi) earthquake occurred 252.0 miles away from the city center
On 1/16/1994 at 00:42:43, a magnitude 4.2 (4.2 MB, 4.0 LG, Depth: 3.1 mi) earthquake occurred 61.7 miles away from Pleasant Hills center
On 8/25/2011 at 05:07:52, a magnitude 4.5 (4.5 ML, Depth: 4.2 mi) earthquake occurred 136.1 miles away from the city center
On 11/30/2017 at 21:47:31, a magnitude 4.1 (4.1 MW, Depth: 6.1 mi) earthquake occurred 55.2 miles away from the city center
Magnitude types: regional Lg-wave magnitude (LG), body-wave magnitude (MB), local magnitude (ML), surface-wave magnitude (MS), moment magnitude (MW)
Natural disasters:
The number of natural disasters in Harford County (17) is near the US average (15).
Major Disasters (Presidential) Declared: 12
Emergencies Declared: 5
Causes of natural disasters: Hurricanes: 7, Snowstorms: 4, Winter Storms: 4, Tropical Storms: 2, Blizzard: 1, Flood: 1, Snowfall: 1, Storm: 1, Other: 1 (Note: some incidents may be assigned to more than one category).
Hospitals and medical centers near Pleasant Hills:
- DAVITA - BELAIR (Dialysis Facility, about 4 miles away; BEL AIR, MD)
- HARFORD HHA/HOSPICE (Hospital, about 5 miles away; BEL AIR, MD)
- FOREST HILL HEALTH AND REHABILITATION CENTER (Nursing Home, about 6 miles away; FOREST HILL, MD)
- FOREST LANDING DIALYSIS (Dialysis Facility, about 7 miles away; FOREST HILL, MD)
- GLEN MEADOWS RETIREMENT COM. (Nursing Home, about 8 miles away; GLEN ARM, MD)
- COMPREHENSIVE HOME HEALTH SERVICES (Home Health Center, about 8 miles away; BALTIMORE, MD)
- LORIEN HEALTH SYSTEMS - RIVERSIDE (Nursing Home, about 8 miles away; BELCAMP, MD)
Amtrak stations near Pleasant Hills:
- 13 miles: ABERDEEN (S. PHILADELPHIA & BELAIR AVE.) . Services: free short-term parking, intercity bus service.
- 18 miles: BALTIMORE (1500 N. CHARLES ST.) . Services: ticket office, fully wheelchair accessible, enclosed waiting area, public restrooms, public payphones, full-service food facilities, snack bar, vending machines, ATM, paid short-term parking, paid long-term parking, call for car rental service, taxi stand, public transit connection.
Operable nuclear power plants near Pleasant Hills:
- 18 miles: Peach Bottom 2 and 3 in Delta, PA.
Colleges/universities with over 2000 students nearest to Pleasant Hills:
- Harford Community College (about 8 miles; Bel Air, MD; Full-time enrollment: 4,530)
- The Community College of Baltimore County (about 11 miles; Baltimore, MD; FT enrollment: 15,217)
- Towson University (about 14 miles; Towson, MD; FT enrollment: 19,618)
- Morgan State University (about 15 miles; Baltimore, MD; FT enrollment: 7,113)
- Loyola University Maryland (about 16 miles; Baltimore, MD; FT enrollment: 5,215)
- Johns Hopkins University (about 17 miles; Baltimore, MD; FT enrollment: 20,568)
- Stevenson University (about 17 miles; Stevenson, MD; FT enrollment: 3,862)
Average household size:| This place: | 2.9 people |
| Maryland: | 2.6 people |
Percentage of family households:| This place: | 82.8% |
| Whole state: | 67.1% |
Percentage of households with unmarried partners:| This place: | 4.1% |
| Whole state: | 6.4% |
Likely homosexual households (counted as self-reported same-sex unmarried-partner households)
- Lesbian couples: 0.3% of all households
- Gay men: 0.4% of all households
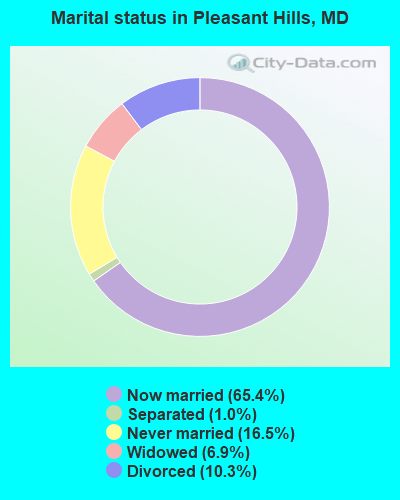
For population 15 years and over in Pleasant Hills:
- Never married: 16.5%
- Now married: 65.4%
- Separated: 1.0%
- Widowed: 6.9%
- Divorced: 10.3%
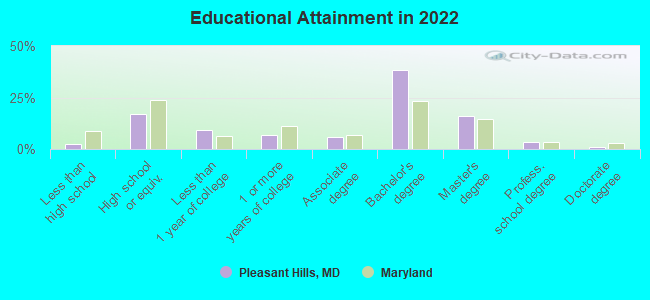
For population 25 years and over in Pleasant Hills:
- High school or higher: 97.3%
- Bachelor's degree or higher: 57.6%
- Graduate or professional degree: 20.5%
- Unemployed: 2.4%
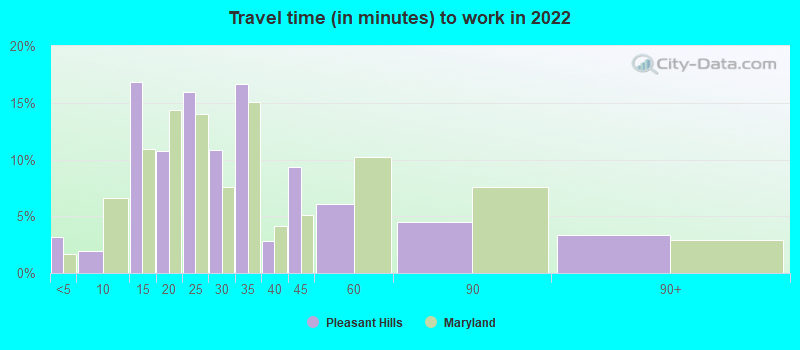
- Mean travel time to work (commute): 28.9 minutes
Education Gini index (Inequality in education)| Here: | 8.9 |
| Maryland average: | 12.7 |
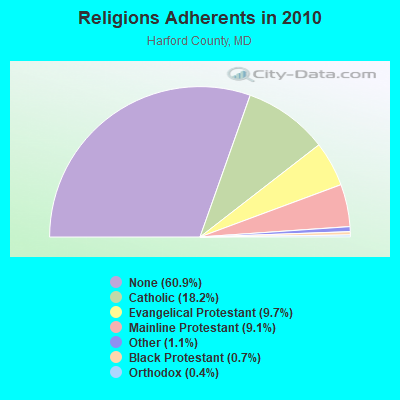
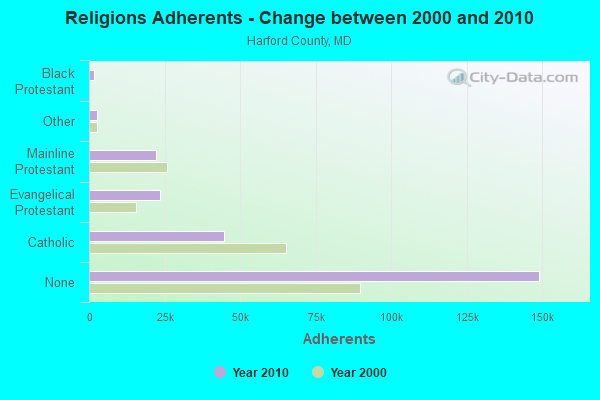
Religion statistics for Pleasant Hills, MD (based on Harford County data)
| Religion | Adherents | Congregations |
|---|
| Catholic | 44,618 | 9 |
| Evangelical Protestant | 23,645 | 97 |
| Mainline Protestant | 22,305 | 65 |
| Other | 2,675 | 10 |
| Black Protestant | 1,628 | 9 |
| Orthodox | 900 | 2 |
| None | 149,055 | - |
Food Environment Statistics:
Number of grocery stores: 35| Harford County: | 1.46 / 10,000 pop. |
| Maryland: | 1.96 / 10,000 pop. |
Number of supercenters and club stores: 1| Harford County: | 0.04 / 10,000 pop. |
| State: | 0.07 / 10,000 pop. |
Number of convenience stores (no gas): 31| Harford County: | 1.29 / 10,000 pop. |
| Maryland: | 1.22 / 10,000 pop. |
Number of convenience stores (with gas): 57| Harford County: | 2.38 / 10,000 pop. |
| State: | 2.05 / 10,000 pop. |
Number of full-service restaurants: 106| This county: | 4.43 / 10,000 pop. |
| State: | 5.40 / 10,000 pop. |
Adult diabetes rate: | Harford County: | 8.9% |
| Maryland: | 9.1% |
Adult obesity rate: | This county: | 27.3% |
| State: | 26.7% |
Low-income preschool obesity rate: | Harford County: | 14.5% |
| Maryland: | 15.5% |
Health and Nutrition:
Healthy diet rate: | Pleasant Hills: | 50.3% |
| Maryland: | 50.1% |
Average overall health of teeth and gums:
People feeling badly about themselves: | This city: | 19.1% |
| State: | 20.0% |
People not drinking alcohol at all: | This city: | 8.3% |
| Maryland: | 11.3% |
Average hours sleeping at night:
Overweight people: | Pleasant Hills: | 29.9% |
| Maryland: | 34.1% |
General health condition:
Average condition of hearing:
More about Health and Nutrition of Pleasant Hills, MD Residents
6.78% of this county's 2021 resident taxpayers lived in other counties in 2020 ($70,993 average adjusted gross income)
| Here: | 6.78% |
| Maryland average: | 7.42% |
0.05% of residents moved from foreign countries ($677 average AGI)| Harford County: | 0.05% |
| Maryland average: | 0.05% |
Top counties from which taxpayers relocated into this county between 2020 and 2021:
6.41% of this county's 2020 resident taxpayers moved to other counties in 2021 ($73,548 average adjusted gross income)
| Here: | 6.41% |
| Maryland average: | 7.91% |
0.03% of residents moved to foreign countries ($452 average AGI)| Harford County: | 0.03% |
| Maryland average: | 0.04% |
Top counties to which taxpayers relocated from this county between 2020 and 2021:
Strongest AM radio stations in Pleasant Hills:
- WWLG (1370 AM; 50 kW; BALTIMORE, MD; Owner: M-10 BROADCASTING, INC.)
- WCBM (680 AM; 50 kW; BALTIMORE, MD; Owner: WCBM MARYLAND, INC.)
- WBAL (1090 AM; 50 kW; BALTIMORE, MD; Owner: HEARST RADIO, INC.)
- WGOP (700 AM; daytime; 25 kW; WALKERSVILLE, MD; Owner: BIRACH BROADCASTING CORPORATION)
- WNST (1570 AM; 5 kW; TOWSON, MD)
- WBIS (1190 AM; 50 kW; ANNAPOLIS, MD; Owner: NATIONS RADIO, LLC)
- WTEM (980 AM; 50 kW; WASHINGTON, DC; Owner: AMFM RADIO LICENSES, L.L.C.)
- WCAO (600 AM; 5 kW; BALTIMORE, MD; Owner: CITICASTERS LICENSES, L.P.)
- WVCH (740 AM; 50 kW; CHESTER, PA; Owner: WVCH COMMUNICATIONS, INC.)
- WMET (1150 AM; 50 kW; GAITHERSBURG, MD; Owner: BELTWAY ACQUISITION CORPORATION)
- WBGR (860 AM; 2 kW; BALTIMORE, MD; Owner: INFINITY RADIO OPERATIONS INC.)
- WTOP (1500 AM; 50 kW; WASHINGTON, DC; Owner: BONNEVILLE HOLDING COMPANY)
- WJSS (1330 AM; 5 kW; HAVRE DE GRACE, MD; Owner: PEOPLES BROADCAST NETWORK, LLC)
Strongest FM radio stations in Pleasant Hills:
- WSMJ (104.3 FM; BALTIMORE, MD; Owner: CITICASTERS LICENSES, L.P.)
- WLIF (101.9 FM; BALTIMORE, MD; Owner: INFINITY WLIF, INC.)
- WWMX (106.5 FM; BALTIMORE, MD; Owner: INFINITY RADIO OPERATIONS INC.)
- WIYY (97.9 FM; BALTIMORE, MD; Owner: HEARST RADIO, INC.)
- WZBA (100.7 FM; WESTMINSTER, MD; Owner: SHAMROCK COMMUNICATIONS, INC.)
- WXYV (105.7 FM; CATONSVILLE, MD; Owner: INFINITY RADIO OPERATIONS INC.)
- WHFC (91.1 FM; BEL AIR, MD; Owner: HARFORD COMMUNITY COLLEGE)
- WXCY (103.7 FM; HAVRE DE GRACE, MD; Owner: DELMARVA BROADCASTING COMPANY)
- WPOC (93.1 FM; BALTIMORE, MD; Owner: CITICASTERS LICENSES, L.P.)
- WERQ-FM (92.3 FM; BALTIMORE, MD; Owner: RADIO ONE LICENSES, LLC)
- WSOX (96.1 FM; RED LION, PA; Owner: LANCASTER-YORK BROADCASTING, LLC)
- WARM-FM (103.3 FM; YORK, PA; Owner: WSBA LICO, INC.)
- WBJC (91.5 FM; BALTIMORE, MD; Owner: BALTIMORE CITY COMMUNITY COLLEGE)
- WROZ (101.3 FM; LANCASTER, PA; Owner: HALL COMMUNICATIONS, INC.)
- WYPR (88.1 FM; BALTIMORE, MD; Owner: WYPR LICENSE HOLDING LLC)
- WDAC (94.5 FM; LANCASTER, PA; Owner: WDAC RADIO COMPANY)
- WQSR (102.7 FM; BALTIMORE, MD; Owner: INFINITY OF CHESAPEAKE LICENSEE CORP.)
- WRBS (95.1 FM; BALTIMORE, MD; Owner: PETER & JOHN RADIO FELLOWSHIP, INC.)
- WTMD (89.7 FM; TOWSON, MD; Owner: TOWSON UNIVERSITY)
- WYCR (98.5 FM; YORK-HANOVER, PA; Owner: RADIO HANOVER, INC.)
TV broadcast stations around Pleasant Hills:
- WBAL-TV (Channel 11; BALTIMORE, MD; Owner: WBAL HEARST-ARGYLE TV, INC. (CA CORP.))
- WMAR-TV (Channel 2; BALTIMORE, MD; Owner: SCRIPPS HOWARD BROADCASTING COMPANY)
- WBFF (Channel 45; BALTIMORE, MD; Owner: CHESAPEAKE TELEVISION LICENSEE, LLC)
- WNUV (Channel 54; BALTIMORE, MD; Owner: BALTIMORE (WNUV-TV) LICENSEE, INC.)
- WJZ-TV (Channel 13; BALTIMORE, MD; Owner: VIACOM INC.)
- WMPB (Channel 67; BALTIMORE, MD; Owner: MARYLAND PUBLIC BROADCASTING COMMISSION)
- WUTB (Channel 24; BALTIMORE, MD; Owner: FOX TELEVISION STATIONS, INC.)
- WTSD-CA (Channel 14; WILMINGTON, DE; Owner: PRIORITY COMMUNICATIONS MINISTRIES, INC.)
- WMPT (Channel 22; ANNAPOLIS, MD; Owner: MARYLAND PUBLIC BROADCASTING COMMISSION)
- WPMT (Channel 43; YORK, PA; Owner: TRIBUNE TELEVISION COMPANY)
- WMJF-LP (Channel 16; TOWSON, MD; Owner: TOWSON UNIVERSITY)
- National Bridge Inventory (NBI) Statistics
- 2Number of bridges
- 13ft / 4.5mTotal length
- 23,113Total average daily traffic
- 1,155Total average daily truck traffic
- 34,375Total future (year 2028) average daily traffic
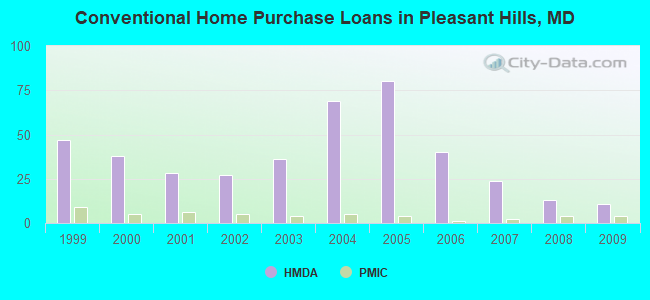
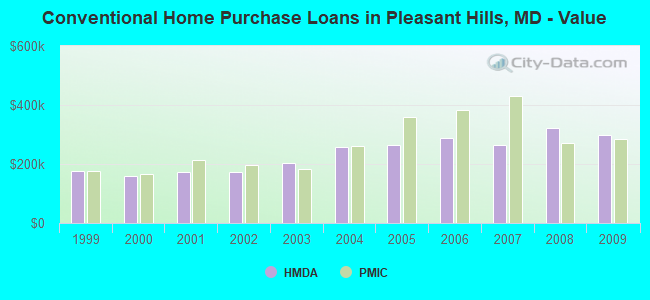
Home Mortgage Disclosure Act Aggregated Statistics For Year 2009
(Based on 1 partial tract)
|
| A) FHA, FSA/RHS & VA
Home Purchase Loans | B) Conventional
Home Purchase Loans | C) Refinancings
| D) Home Improvement Loans
| F) Non-occupant Loans on
< 5 Family Dwellings (A B C & D) | G) Loans On Manufactured
Home Dwelling (A B C & D) |
|---|
| Number | Average Value | Number | Average Value | Number | Average Value | Number | Average Value | Number | Average Value | Number | Average Value |
|---|
| LOANS ORIGINATED | 10 | $306,361 | 11 | $297,741 | 98 | $265,835 | 5 | $120,482 | 6 | $453,272 | 0 | $0 |
| APPLICATIONS APPROVED, NOT ACCEPTED | 0 | $0 | 2 | $250,220 | 8 | $280,621 | 1 | $16,990 | 1 | $145,330 | 0 | $0 |
| APPLICATIONS DENIED | 2 | $272,195 | 0 | $0 | 16 | $263,261 | 1 | $140,640 | 0 | $0 | 1 | $70,910 |
| APPLICATIONS WITHDRAWN | 1 | $193,380 | 1 | $102,550 | 19 | $302,314 | 1 | $150,020 | 0 | $0 | 0 | $0 |
| FILES CLOSED FOR INCOMPLETENESS | 1 | $155,880 | 1 | $210,960 | 5 | $292,062 | 1 | $152,360 | 0 | $0 | 0 | $0 |
Aggregated Statistics For Year 2008
(Based on 1 partial tract)
|
| A) FHA, FSA/RHS & VA
Home Purchase Loans | B) Conventional
Home Purchase Loans | C) Refinancings
| D) Home Improvement Loans
| F) Non-occupant Loans on
< 5 Family Dwellings (A B C & D) |
|---|
| Number | Average Value | Number | Average Value | Number | Average Value | Number | Average Value | Number | Average Value |
|---|
| LOANS ORIGINATED | 2 | $364,785 | 13 | $321,985 | 43 | $263,250 | 8 | $132,290 | 2 | $308,530 |
| APPLICATIONS APPROVED, NOT ACCEPTED | 1 | $171,700 | 2 | $184,590 | 6 | $260,672 | 2 | $239,965 | 1 | $316,440 |
| APPLICATIONS DENIED | 0 | $0 | 1 | $244,360 | 10 | $252,976 | 5 | $68,796 | 0 | $0 |
| APPLICATIONS WITHDRAWN | 0 | $0 | 2 | $226,195 | 10 | $273,369 | 1 | $368,010 | 0 | $0 |
| FILES CLOSED FOR INCOMPLETENESS | 0 | $0 | 1 | $29,300 | 1 | $309,410 | 0 | $0 | 1 | $215,650 |
Aggregated Statistics For Year 2007
(Based on 1 partial tract)
|
| A) FHA, FSA/RHS & VA
Home Purchase Loans | B) Conventional
Home Purchase Loans | C) Refinancings
| D) Home Improvement Loans
| F) Non-occupant Loans on
< 5 Family Dwellings (A B C & D) |
|---|
| Number | Average Value | Number | Average Value | Number | Average Value | Number | Average Value | Number | Average Value |
|---|
| LOANS ORIGINATED | 1 | $155,290 | 24 | $262,919 | 45 | $235,780 | 8 | $131,558 | 2 | $212,425 |
| APPLICATIONS APPROVED, NOT ACCEPTED | 0 | $0 | 2 | $292,415 | 8 | $228,686 | 2 | $152,360 | 0 | $0 |
| APPLICATIONS DENIED | 0 | $0 | 1 | $371,520 | 18 | $367,650 | 3 | $170,917 | 0 | $0 |
| APPLICATIONS WITHDRAWN | 0 | $0 | 1 | $107,240 | 14 | $317,361 | 1 | $87,900 | 0 | $0 |
| FILES CLOSED FOR INCOMPLETENESS | 0 | $0 | 0 | $0 | 4 | $342,518 | 0 | $0 | 0 | $0 |
Aggregated Statistics For Year 2006
(Based on 1 partial tract)
|
| A) FHA, FSA/RHS & VA
Home Purchase Loans | B) Conventional
Home Purchase Loans | C) Refinancings
| D) Home Improvement Loans
| F) Non-occupant Loans on
< 5 Family Dwellings (A B C & D) |
|---|
| Number | Average Value | Number | Average Value | Number | Average Value | Number | Average Value | Number | Average Value |
|---|
| LOANS ORIGINATED | 1 | $183,420 | 40 | $287,052 | 61 | $223,429 | 9 | $99,360 | 2 | $486,965 |
| APPLICATIONS APPROVED, NOT ACCEPTED | 0 | $0 | 2 | $272,785 | 11 | $271,797 | 1 | $13,480 | 0 | $0 |
| APPLICATIONS DENIED | 0 | $0 | 2 | $159,100 | 16 | $279,046 | 4 | $114,710 | 1 | $251,980 |
| APPLICATIONS WITHDRAWN | 0 | $0 | 5 | $184,356 | 19 | $228,478 | 2 | $126,285 | 0 | $0 |
| FILES CLOSED FOR INCOMPLETENESS | 0 | $0 | 2 | $271,610 | 5 | $313,862 | 2 | $55,670 | 0 | $0 |
Aggregated Statistics For Year 2005
(Based on 1 partial tract)
|
| A) FHA, FSA/RHS & VA
Home Purchase Loans | B) Conventional
Home Purchase Loans | C) Refinancings
| D) Home Improvement Loans
| F) Non-occupant Loans on
< 5 Family Dwellings (A B C & D) | G) Loans On Manufactured
Home Dwelling (A B C & D) |
|---|
| Number | Average Value | Number | Average Value | Number | Average Value | Number | Average Value | Number | Average Value | Number | Average Value |
|---|
| LOANS ORIGINATED | 1 | $165,840 | 80 | $264,696 | 67 | $261,417 | 12 | $114,270 | 9 | $205,556 | 1 | $113,100 |
| APPLICATIONS APPROVED, NOT ACCEPTED | 0 | $0 | 4 | $317,905 | 10 | $265,985 | 1 | $41,610 | 1 | $84,380 | 1 | $16,410 |
| APPLICATIONS DENIED | 0 | $0 | 7 | $250,976 | 28 | $311,815 | 2 | $94,640 | 1 | $131,260 | 0 | $0 |
| APPLICATIONS WITHDRAWN | 0 | $0 | 17 | $247,706 | 24 | $231,739 | 2 | $181,365 | 6 | $181,172 | 0 | $0 |
| FILES CLOSED FOR INCOMPLETENESS | 0 | $0 | 3 | $341,443 | 6 | $340,662 | 0 | $0 | 0 | $0 | 0 | $0 |
Aggregated Statistics For Year 2004
(Based on 1 partial tract)
|
| A) FHA, FSA/RHS & VA
Home Purchase Loans | B) Conventional
Home Purchase Loans | C) Refinancings
| D) Home Improvement Loans
| F) Non-occupant Loans on
< 5 Family Dwellings (A B C & D) | G) Loans On Manufactured
Home Dwelling (A B C & D) |
|---|
| Number | Average Value | Number | Average Value | Number | Average Value | Number | Average Value | Number | Average Value | Number | Average Value |
|---|
| LOANS ORIGINATED | 0 | $0 | 69 | $258,044 | 65 | $197,861 | 12 | $32,035 | 4 | $204,952 | 0 | $0 |
| APPLICATIONS APPROVED, NOT ACCEPTED | 0 | $0 | 5 | $236,510 | 4 | $184,882 | 1 | $35,160 | 0 | $0 | 0 | $0 |
| APPLICATIONS DENIED | 1 | $58,600 | 8 | $240,552 | 13 | $181,795 | 4 | $52,300 | 1 | $150,020 | 1 | $44,540 |
| APPLICATIONS WITHDRAWN | 0 | $0 | 15 | $285,617 | 13 | $217,135 | 2 | $35,160 | 1 | $168,770 | 0 | $0 |
| FILES CLOSED FOR INCOMPLETENESS | 0 | $0 | 1 | $471,730 | 1 | $234,400 | 1 | $152,360 | 0 | $0 | 0 | $0 |
Aggregated Statistics For Year 2003
(Based on 1 partial tract)
|
| A) FHA, FSA/RHS & VA
Home Purchase Loans | B) Conventional
Home Purchase Loans | C) Refinancings
| D) Home Improvement Loans
| F) Non-occupant Loans on
< 5 Family Dwellings (A B C & D) |
|---|
| Number | Average Value | Number | Average Value | Number | Average Value | Number | Average Value | Number | Average Value |
|---|
| LOANS ORIGINATED | 1 | $206,270 | 36 | $202,756 | 195 | $176,362 | 5 | $34,926 | 4 | $134,488 |
| APPLICATIONS APPROVED, NOT ACCEPTED | 0 | $0 | 4 | $199,972 | 19 | $176,694 | 1 | $57,430 | 1 | $158,220 |
| APPLICATIONS DENIED | 0 | $0 | 4 | $201,585 | 13 | $151,413 | 2 | $44,245 | 0 | $0 |
| APPLICATIONS WITHDRAWN | 0 | $0 | 1 | $157,050 | 19 | $179,778 | 3 | $30,277 | 1 | $46,290 |
| FILES CLOSED FOR INCOMPLETENESS | 0 | $0 | 1 | $80,280 | 5 | $153,650 | 0 | $0 | 0 | $0 |
Aggregated Statistics For Year 2002
(Based on 1 partial tract)
|
| A) FHA, FSA/RHS & VA
Home Purchase Loans | B) Conventional
Home Purchase Loans | C) Refinancings
| D) Home Improvement Loans
| F) Non-occupant Loans on
< 5 Family Dwellings (A B C & D) |
|---|
| Number | Average Value | Number | Average Value | Number | Average Value | Number | Average Value | Number | Average Value |
|---|
| LOANS ORIGINATED | 2 | $138,590 | 27 | $174,389 | 108 | $181,806 | 6 | $41,508 | 1 | $116,030 |
| APPLICATIONS APPROVED, NOT ACCEPTED | 0 | $0 | 2 | $122,180 | 6 | $201,388 | 4 | $14,210 | 0 | $0 |
| APPLICATIONS DENIED | 0 | $0 | 1 | $309,990 | 19 | $151,095 | 2 | $20,510 | 2 | $150,015 |
| APPLICATIONS WITHDRAWN | 0 | $0 | 2 | $181,955 | 17 | $187,348 | 1 | $120,130 | 0 | $0 |
| FILES CLOSED FOR INCOMPLETENESS | 0 | $0 | 1 | $160,560 | 1 | $102,550 | 0 | $0 | 0 | $0 |
Aggregated Statistics For Year 2001
(Based on 1 partial tract)
|
| A) FHA, FSA/RHS & VA
Home Purchase Loans | B) Conventional
Home Purchase Loans | C) Refinancings
| D) Home Improvement Loans
| F) Non-occupant Loans on
< 5 Family Dwellings (A B C & D) |
|---|
| Number | Average Value | Number | Average Value | Number | Average Value | Number | Average Value | Number | Average Value |
|---|
| LOANS ORIGINATED | 4 | $155,438 | 28 | $173,247 | 64 | $166,158 | 8 | $31,205 | 2 | $164,960 |
| APPLICATIONS APPROVED, NOT ACCEPTED | 1 | $118,960 | 4 | $173,602 | 6 | $126,772 | 1 | $2,340 | 0 | $0 |
| APPLICATIONS DENIED | 0 | $0 | 3 | $263,897 | 13 | $177,964 | 1 | $11,720 | 1 | $110,750 |
| APPLICATIONS WITHDRAWN | 0 | $0 | 4 | $182,245 | 7 | $180,153 | 1 | $43,950 | 0 | $0 |
| FILES CLOSED FOR INCOMPLETENESS | 0 | $0 | 0 | $0 | 1 | $125,990 | 0 | $0 | 0 | $0 |
Aggregated Statistics For Year 2000
(Based on 1 partial tract)
|
| A) FHA, FSA/RHS & VA
Home Purchase Loans | B) Conventional
Home Purchase Loans | C) Refinancings
| D) Home Improvement Loans
| F) Non-occupant Loans on
< 5 Family Dwellings (A B C & D) |
|---|
| Number | Average Value | Number | Average Value | Number | Average Value | Number | Average Value | Number | Average Value |
|---|
| LOANS ORIGINATED | 3 | $151,773 | 38 | $160,780 | 12 | $137,271 | 6 | $24,905 | 1 | $90,240 |
| APPLICATIONS APPROVED, NOT ACCEPTED | 0 | $0 | 2 | $130,090 | 3 | $150,993 | 2 | $53,035 | 0 | $0 |
| APPLICATIONS DENIED | 0 | $0 | 4 | $125,258 | 4 | $58,748 | 1 | $15,240 | 0 | $0 |
| APPLICATIONS WITHDRAWN | 1 | $101,960 | 2 | $132,435 | 5 | $124,466 | 1 | $69,730 | 0 | $0 |
| FILES CLOSED FOR INCOMPLETENESS | 0 | $0 | 0 | $0 | 0 | $0 | 0 | $0 | 0 | $0 |
Aggregated Statistics For Year 1999
(Based on 1 partial tract)
|
| A) FHA, FSA/RHS & VA
Home Purchase Loans | B) Conventional
Home Purchase Loans | C) Refinancings
| D) Home Improvement Loans
| F) Non-occupant Loans on
< 5 Family Dwellings (A B C & D) |
|---|
| Number | Average Value | Number | Average Value | Number | Average Value | Number | Average Value | Number | Average Value |
|---|
| LOANS ORIGINATED | 2 | $186,755 | 47 | $176,610 | 49 | $125,575 | 7 | $33,276 | 0 | $0 |
| APPLICATIONS APPROVED, NOT ACCEPTED | 0 | $0 | 3 | $217,830 | 8 | $106,464 | 1 | $4,120 | 1 | $125,290 |
| APPLICATIONS DENIED | 0 | $0 | 2 | $82,055 | 12 | $129,796 | 2 | $11,765 | 2 | $88,230 |
| APPLICATIONS WITHDRAWN | 1 | $82,350 | 3 | $180,773 | 4 | $118,228 | 2 | $140,580 | 0 | $0 |
| FILES CLOSED FOR INCOMPLETENESS | 0 | $0 | 0 | $0 | 2 | $137,640 | 0 | $0 | 0 | $0 |
Detailed HMDA statistics for the following Tracts:
3034.00
Private Mortgage Insurance Companies Aggregated Statistics For Year 2009
(Based on 1 partial tract)
|
| A) Conventional
Home Purchase Loans | B) Refinancings
|
|---|
| Number | Average Value | Number | Average Value |
|---|
| LOANS ORIGINATED | 4 | $283,918 | 0 | $0 |
| APPLICATIONS APPROVED, NOT ACCEPTED | 1 | $200,410 | 0 | $0 |
| APPLICATIONS DENIED | 0 | $0 | 1 | $385,590 |
| APPLICATIONS WITHDRAWN | 0 | $0 | 1 | $453,560 |
| FILES CLOSED FOR INCOMPLETENESS | 0 | $0 | 0 | $0 |
Aggregated Statistics For Year 2008
(Based on 1 partial tract)
|
| A) Conventional
Home Purchase Loans | B) Refinancings
|
|---|
| Number | Average Value | Number | Average Value |
|---|
| LOANS ORIGINATED | 4 | $271,025 | 1 | $342,810 |
| APPLICATIONS APPROVED, NOT ACCEPTED | 0 | $0 | 1 | $449,460 |
| APPLICATIONS DENIED | 0 | $0 | 1 | $236,160 |
| APPLICATIONS WITHDRAWN | 0 | $0 | 0 | $0 |
| FILES CLOSED FOR INCOMPLETENESS | 0 | $0 | 1 | $172,280 |
Aggregated Statistics For Year 2007
(Based on 1 partial tract)
|
| A) Conventional
Home Purchase Loans | B) Refinancings
|
|---|
| Number | Average Value | Number | Average Value |
|---|
| LOANS ORIGINATED | 2 | $431,005 | 3 | $401,020 |
| APPLICATIONS APPROVED, NOT ACCEPTED | 1 | $128,330 | 1 | $696,170 |
| APPLICATIONS DENIED | 0 | $0 | 0 | $0 |
| APPLICATIONS WITHDRAWN | 0 | $0 | 0 | $0 |
| FILES CLOSED FOR INCOMPLETENESS | 0 | $0 | 0 | $0 |
Aggregated Statistics For Year 2006
(Based on 1 partial tract)
|
| A) Conventional
Home Purchase Loans | B) Refinancings
|
|---|
| Number | Average Value | Number | Average Value |
|---|
| LOANS ORIGINATED | 1 | $382,070 | 2 | $258,135 |
| APPLICATIONS APPROVED, NOT ACCEPTED | 1 | $127,160 | 1 | $242,600 |
| APPLICATIONS DENIED | 0 | $0 | 0 | $0 |
| APPLICATIONS WITHDRAWN | 0 | $0 | 1 | $175,210 |
| FILES CLOSED FOR INCOMPLETENESS | 0 | $0 | 0 | $0 |
Aggregated Statistics For Year 2005
(Based on 1 partial tract)
|
| A) Conventional
Home Purchase Loans | B) Refinancings
| D) Loans On Manufactured
Home Dwelling (A & B) |
|---|
| Number | Average Value | Number | Average Value | Number | Average Value |
|---|
| LOANS ORIGINATED | 4 | $359,510 | 1 | $209,790 | 1 | $113,100 |
| APPLICATIONS APPROVED, NOT ACCEPTED | 1 | $373,280 | 0 | $0 | 0 | $0 |
| APPLICATIONS DENIED | 0 | $0 | 0 | $0 | 0 | $0 |
| APPLICATIONS WITHDRAWN | 0 | $0 | 0 | $0 | 0 | $0 |
| FILES CLOSED FOR INCOMPLETENESS | 0 | $0 | 0 | $0 | 0 | $0 |
Aggregated Statistics For Year 2004
(Based on 1 partial tract)
|
| A) Conventional
Home Purchase Loans | B) Refinancings
| C) Non-occupant Loans on
< 5 Family Dwellings (A & B) |
|---|
| Number | Average Value | Number | Average Value | Number | Average Value |
|---|
| LOANS ORIGINATED | 5 | $262,646 | 3 | $255,300 | 1 | $200,410 |
| APPLICATIONS APPROVED, NOT ACCEPTED | 1 | $458,840 | 1 | $92,590 | 0 | $0 |
| APPLICATIONS DENIED | 0 | $0 | 0 | $0 | 0 | $0 |
| APPLICATIONS WITHDRAWN | 1 | $243,780 | 1 | $137,120 | 0 | $0 |
| FILES CLOSED FOR INCOMPLETENESS | 0 | $0 | 0 | $0 | 0 | $0 |
Aggregated Statistics For Year 2003
(Based on 1 partial tract)
|
| A) Conventional
Home Purchase Loans | B) Refinancings
|
|---|
| Number | Average Value | Number | Average Value |
|---|
| LOANS ORIGINATED | 4 | $183,710 | 5 | $250,104 |
| APPLICATIONS APPROVED, NOT ACCEPTED | 0 | $0 | 3 | $171,893 |
| APPLICATIONS DENIED | 0 | $0 | 0 | $0 |
| APPLICATIONS WITHDRAWN | 0 | $0 | 1 | $124,820 |
| FILES CLOSED FOR INCOMPLETENESS | 0 | $0 | 0 | $0 |
Aggregated Statistics For Year 2002
(Based on 1 partial tract)
|
| A) Conventional
Home Purchase Loans | B) Refinancings
| C) Non-occupant Loans on
< 5 Family Dwellings (A & B) |
|---|
| Number | Average Value | Number | Average Value | Number | Average Value |
|---|
| LOANS ORIGINATED | 5 | $195,958 | 5 | $205,334 | 1 | $116,030 |
| APPLICATIONS APPROVED, NOT ACCEPTED | 1 | $123,060 | 1 | $145,330 | 0 | $0 |
| APPLICATIONS DENIED | 0 | $0 | 1 | $161,150 | 0 | $0 |
| APPLICATIONS WITHDRAWN | 0 | $0 | 1 | $170,530 | 1 | $78,520 |
| FILES CLOSED FOR INCOMPLETENESS | 0 | $0 | 0 | $0 | 0 | $0 |
Aggregated Statistics For Year 2001
(Based on 1 partial tract)
|
| A) Conventional
Home Purchase Loans | B) Refinancings
| C) Non-occupant Loans on
< 5 Family Dwellings (A & B) |
|---|
| Number | Average Value | Number | Average Value | Number | Average Value |
|---|
| LOANS ORIGINATED | 6 | $212,230 | 5 | $164,900 | 2 | $164,960 |
| APPLICATIONS APPROVED, NOT ACCEPTED | 2 | $166,130 | 1 | $78,520 | 1 | $221,510 |
| APPLICATIONS DENIED | 0 | $0 | 0 | $0 | 0 | $0 |
| APPLICATIONS WITHDRAWN | 0 | $0 | 0 | $0 | 0 | $0 |
| FILES CLOSED FOR INCOMPLETENESS | 1 | $110,750 | 0 | $0 | 0 | $0 |
Aggregated Statistics For Year 2000
(Based on 1 partial tract)
|
| A) Conventional
Home Purchase Loans |
|---|
| Number | Average Value |
|---|
| LOANS ORIGINATED | 5 | $167,010 |
| APPLICATIONS APPROVED, NOT ACCEPTED | 0 | $0 |
| APPLICATIONS DENIED | 0 | $0 |
| APPLICATIONS WITHDRAWN | 1 | $161,150 |
| FILES CLOSED FOR INCOMPLETENESS | 0 | $0 |
Aggregated Statistics For Year 1999
(Based on 1 partial tract)
|
| A) Conventional
Home Purchase Loans | B) Refinancings
|
|---|
| Number | Average Value | Number | Average Value |
|---|
| LOANS ORIGINATED | 9 | $177,767 | 4 | $152,932 |
| APPLICATIONS APPROVED, NOT ACCEPTED | 2 | $113,525 | 1 | $204,690 |
| APPLICATIONS DENIED | 0 | $0 | 0 | $0 |
| APPLICATIONS WITHDRAWN | 1 | $161,760 | 0 | $0 |
| FILES CLOSED FOR INCOMPLETENESS | 0 | $0 | 0 | $0 |
Detailed PMIC statistics for the following Tracts:
3034.00
Pleasant Hills compared to Maryland state average:
- Unemployed percentage significantly below state average.
- Black race population percentage significantly below state average.
- Hispanic race population percentage below state average.
- Median age significantly above state average.
- Foreign-born population percentage below state average.
- Renting percentage significantly below state average.
- Length of stay since moving in above state average.
- Number of rooms per house above state average.
- House age below state average.
- Percentage of population with a bachelor's degree or higher above state average.