Parkside, Pennsylvania
Submit your own pictures of this borough and show them to the world
- OSM Map
- General Map
- Google Map
- MSN Map
- OSM Map
- General Map
- Google Map
- MSN Map
- OSM Map
- General Map
- Google Map
- MSN Map
- OSM Map
- General Map
- Google Map
- MSN Map
Please wait while loading the map...
Population in 2022: 2,299 (100% urban, 0% rural).
Population change since 2000: +1.4%
| Males: 998 |  (43.4%) (43.4%) |
| Females: 1,301 |  (56.6%) (56.6%) |
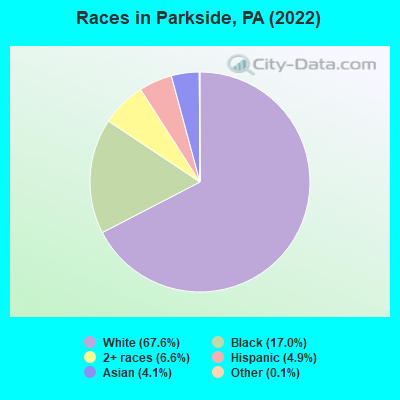
(10.4% for White Non-Hispanic residents, 3.3% for Black residents)
Business Search - 14 Million verified businesses
Data:
Full-time law enforcement employees in 2021, including police officers: 1 (1 officers - 1 male; 0 female).
| Officers per 1,000 residents here: | 0.43 |
| Pennsylvania average: | 2.55 |
 Recent articles from our blog. Our writers, many of them Ph.D. graduates or candidates, create easy-to-read articles on a wide variety of topics.
Latest news from Parkside, PA collected exclusively by city-data.com from local newspapers, TV, and radio stations
Ancestries: Irish (13.6%), German (7.7%), English (5.8%), Polish (4.5%), European (3.7%), Scottish (1.9%).
Current Local Time: EST time zone
Incorporated on 06/26/1919
Land area: 0.21 square miles.
Population density: 11,052 people per square mile (high).
86 residents are foreign born (3.3% Asia).
| This borough: | 4.2% |
| Pennsylvania: | 7.3% |
Median real estate property taxes paid for housing units with mortgages in 2022: $3,896 (2.0%)
Median real estate property taxes paid for housing units with no mortgage in 2022: $3,441 (1.9%)
Nearest city with pop. 50,000+: Brandywine, DE (8.3 miles  , pop. 78,620).
Nearest city with pop. 200,000+: Philadelphia, PA (15.4 miles , pop. 1,517,550).
Nearest cities:
Latitude: 39.87 N, Longitude: 75.38 W
Unemployment in December 2023:
| Here: | 2.7% |
| Pennsylvania: | 2.9% |
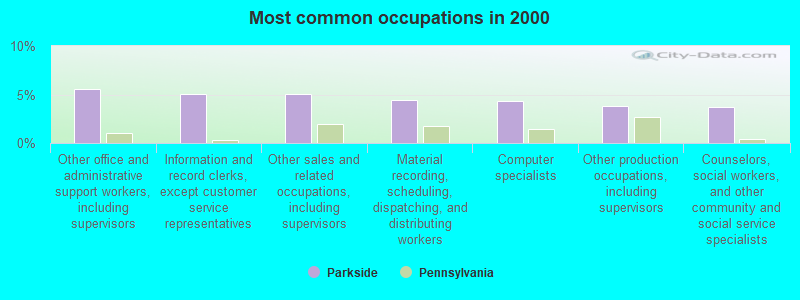
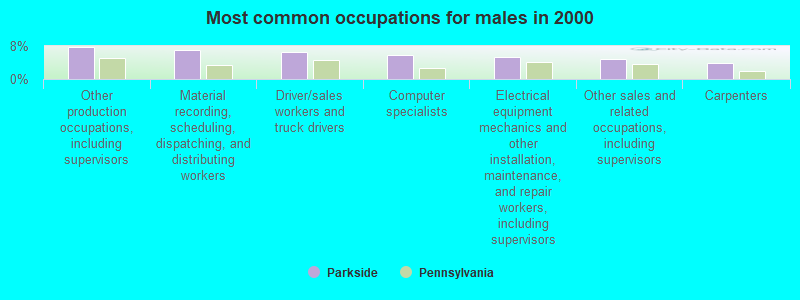
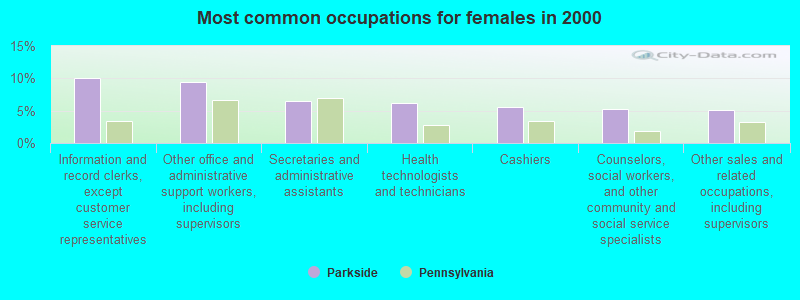
Most common occupations in Parkside, PA (%)
Both
Males
Females


- Other office and administrative support workers, including supervisors (5.5%)
- Information and record clerks, except customer service representatives (5.0%)
- Other sales and related occupations, including supervisors (5.0%)
- Material recording, scheduling, dispatching, and distributing workers (4.5%)
- Computer specialists (4.3%)
- Other production occupations, including supervisors (3.9%)
- Counselors, social workers, and other community and social service specialists (3.7%)

- Other production occupations, including supervisors (7.7%)
- Material recording, scheduling, dispatching, and distributing workers (7.1%)
- Driver/sales workers and truck drivers (6.6%)
- Computer specialists (5.9%)
- Electrical equipment mechanics and other installation, maintenance, and repair workers, including supervisors (5.4%)
- Other sales and related occupations, including supervisors (4.9%)
- Carpenters (4.0%)

- Information and record clerks, except customer service representatives (10.1%)
- Other office and administrative support workers, including supervisors (9.4%)
- Secretaries and administrative assistants (6.6%)
- Health technologists and technicians (6.2%)
- Cashiers (5.5%)
- Counselors, social workers, and other community and social service specialists (5.3%)
- Other sales and related occupations, including supervisors (5.1%)
Tornado activity:
Parkside-area historical tornado activity is slightly above Pennsylvania state average. It is 4% greater than the overall U.S. average.
On 3/22/1955, a category F3 (max. wind speeds 158-206 mph) tornado 13.6 miles away from the Parkside borough center killed one person and caused between $50,000 and $500,000 in damages.
On 4/28/1961, a category F3 tornado 17.0 miles away from the borough center caused between $5000 and $50,000 in damages.
Earthquake activity:
Parkside-area historical earthquake activity is significantly above Pennsylvania state average. It is 65% smaller than the overall U.S. average.
On 8/23/2011 at 17:51:04, a magnitude 5.8 (5.8 MW, Depth: 3.7 mi, Class: Moderate, Intensity: VI - VII) earthquake occurred 193.1 miles away from Parkside center
On 1/16/1994 at 01:49:16, a magnitude 4.6 (4.6 MB, 4.6 LG, Depth: 3.1 mi, Class: Light, Intensity: IV - V) earthquake occurred 47.4 miles away from Parkside center
On 1/16/1994 at 00:42:43, a magnitude 4.2 (4.2 MB, 4.0 LG, Depth: 3.1 mi) earthquake occurred 46.1 miles away from the city center
On 11/30/2017 at 21:47:31, a magnitude 4.1 (4.1 MW, Depth: 6.1 mi) earthquake occurred 46.4 miles away from Parkside center
On 10/7/1983 at 10:18:46, a magnitude 5.3 (5.1 MB, 5.3 LG, 5.1 ML) earthquake occurred 287.6 miles away from the city center
On 9/25/1998 at 19:52:52, a magnitude 5.2 (4.8 MB, 4.3 MS, 5.2 LG, 4.5 MW, Depth: 3.1 mi) earthquake occurred 286.1 miles away from Parkside center
Magnitude types: regional Lg-wave magnitude (LG), body-wave magnitude (MB), local magnitude (ML), surface-wave magnitude (MS), moment magnitude (MW)
Natural disasters:
The number of natural disasters in Delaware County (21) is greater than the US average (15).
Major Disasters (Presidential) Declared: 15
Emergencies Declared: 6
Causes of natural disasters: Hurricanes: 5, Floods: 4, Winter Storms: 4, Storms: 3, Tropical Storms: 3, Snowstorms: 2, Blizzard: 1, Snowfall: 1, Tropical Depression: 1, Water Shortage: 1, Other: 1 (Note: some incidents may be assigned to more than one category).
![Parkside topographic map]()
Hospitals and medical centers near Parkside:
- THE BELVEDERE CENTER, GENESIS HEALTHCARE (Nursing Home, about 1 miles away; CHESTER, PA)
- CHESTER CARE CENTER (Nursing Home, about 1 miles away; CHESTER, PA)
- ELWYN NETHER PROVIDENCE (Hospital, about 2 miles away; WALLINGFORD, PA)
- ELWYN INC/WOODLYN (Hospital, about 2 miles away; WOODLYN, PA)
- FRESENIUS MEDICAL CARE SWARTHMORE (Dialysis Facility, about 3 miles away; SWARTHMORE, PA)
- COMMUNITY HOSPITAL OF CHESTER (Hospital, about 3 miles away; CHESTER, PA)
- WALLINGFORD NURSING AND REHAB (Nursing Home, about 3 miles away; WALLINGFORD, PA)
Amtrak stations near Parkside:
- 11 miles: ARDMORE (STATION RD. & LANCASTER AVE.) . Services: enclosed waiting area, public restrooms, public payphones, paid short-term parking, call for car rental service, call for taxi service, public transit connection.
- 13 miles: PHILADELPHIA (30TH & MARKET STS.) . Services: ticket office, fully wheelchair accessible, enclosed waiting area, public restrooms, public payphones, snack bar, ATM, paid short-term parking, paid long-term parking, car rental agency, taxi stand, public transit connection.
- 13 miles: WILMINGTON (M. L. KING BLVD, & FRENCH ST.) . Services: ticket office, partially wheelchair accessible, enclosed waiting area, public restrooms, public payphones, snack bar, ATM, paid short-term parking, paid long-term parking, car rental agency, taxi stand, intercity bus service, public transit connection.
Colleges/universities with over 2000 students nearest to Parkside:
- Widener University-Main Campus (about 2 miles; Chester, PA; Full-time enrollment: 4,051)
- Neumann University (about 4 miles; Aston, PA; FT enrollment: 2,622)
- Delaware County Community College (about 7 miles; Media, PA; FT enrollment: 8,419)
- University of the Sciences (about 11 miles; Philadelphia, PA; FT enrollment: 2,464)
- University of Pennsylvania (about 12 miles; Philadelphia, PA; FT enrollment: 25,693)
- Saint Joseph's University (about 12 miles; Philadelphia, PA; FT enrollment: 7,329)
- Drexel University (about 12 miles; Philadelphia, PA; FT enrollment: 22,969)
Public elementary/middle school in Parkside:
- PARKSIDE EL SCH (Students: 281, Location: 2 EAST FORESTVIEW ROAD, Grades: KG-5)
Average household size:| This borough: | 2.7 people |
| Pennsylvania: | 2.5 people |
Percentage of family households:| This borough: | 66.9% |
| Whole state: | 65.0% |
Percentage of households with unmarried partners:| This borough: | 8.1% |
| Whole state: | 6.6% |
Likely homosexual households (counted as self-reported same-sex unmarried-partner households)
- Lesbian couples: 0.5% of all households
- Gay men: 0.3% of all households
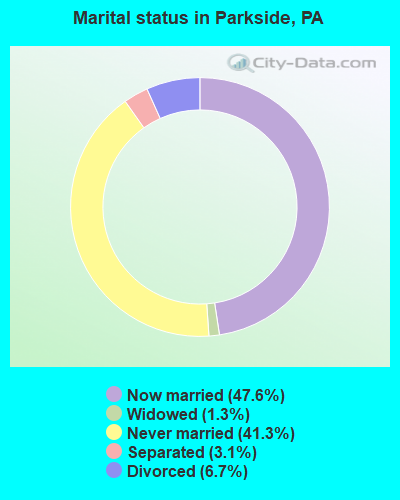
For population 15 years and over in Parkside:
- Never married: 41.3%
- Now married: 47.6%
- Separated: 3.1%
- Widowed: 1.3%
- Divorced: 6.7%
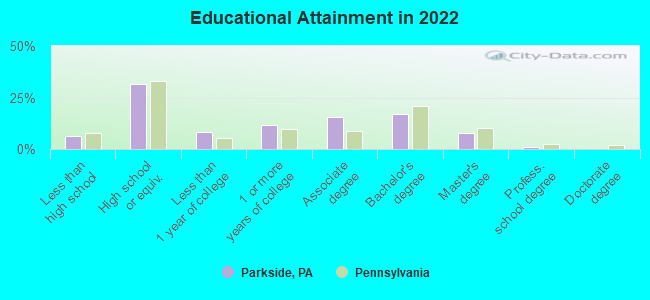
For population 25 years and over in Parkside:
- High school or higher: 93.5%
- Bachelor's degree or higher: 25.4%
- Graduate or professional degree: 8.7%
- Unemployed: 3.6%
- Mean travel time to work (commute): 17.4 minutes
Education Gini index (Inequality in education)| Here: | 11.7 |
| Pennsylvania average: | 11.4 |
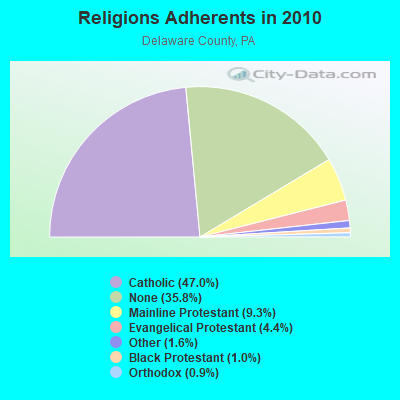
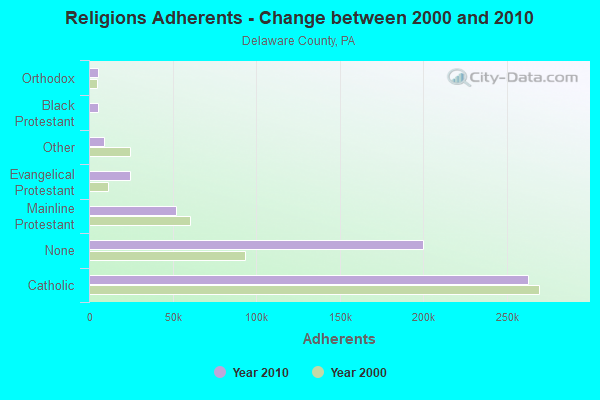
Religion statistics for Parkside, PA (based on Delaware County data)
| Religion | Adherents | Congregations |
|---|
| Catholic | 262,506 | 50 |
| Mainline Protestant | 52,224 | 169 |
| Evangelical Protestant | 24,456 | 136 |
| Other | 9,009 | 27 |
| Black Protestant | 5,617 | 39 |
| Orthodox | 5,096 | 8 |
| None | 200,071 | - |
Food Environment Statistics:
Number of grocery stores: 103| This county: | 1.86 / 10,000 pop. |
| Pennsylvania: | 2.04 / 10,000 pop. |
Number of supercenters and club stores: 1| Delaware County: | 0.02 / 10,000 pop. |
| State: | 0.09 / 10,000 pop. |
Number of convenience stores (no gas): 83| Here: | 1.50 / 10,000 pop. |
| Pennsylvania: | 0.88 / 10,000 pop. |
Number of convenience stores (with gas): 63| This county: | 1.14 / 10,000 pop. |
| Pennsylvania: | 2.52 / 10,000 pop. |
Number of full-service restaurants: 313| Delaware County: | 5.66 / 10,000 pop. |
| Pennsylvania: | 7.12 / 10,000 pop. |
Adult diabetes rate: | Delaware County: | 8.5% |
| State: | 9.1% |
Low-income preschool obesity rate: | This county: | 11.1% |
| Pennsylvania: | 11.5% |
Health and Nutrition:
Healthy diet rate: | Here: | 50.9% |
| Pennsylvania: | 50.2% |
Average overall health of teeth and gums: | This city: | 48.5% |
| State: | 47.1% |
Average BMI: | This city: | 29.0 |
| Pennsylvania: | 28.7 |
People feeling badly about themselves: | This city: | 22.2% |
| State: | 20.8% |
People not drinking alcohol at all: | Here: | 11.5% |
| Pennsylvania: | 10.9% |
Average hours sleeping at night:
Overweight people: | This city: | 35.3% |
| Pennsylvania: | 34.3% |
General health condition: | Parkside: | 58.0% |
| State: | 56.2% |
Average condition of hearing: | Parkside: | 78.8% |
| State: | 78.3% |
More about Health and Nutrition of Parkside, PA Residents
| Local government employment and payroll (March 2022) |
| Function |
Full-time employees |
Monthly full-time payroll |
Average yearly full-time wage |
Part-time employees |
Monthly part-time payroll |
| Police Protection - Officers |
3 | $21,036 | $84,144 | 0 | $0 |
| Other and Unallocable |
0 | $0 | | 24 | $24,203 |
| Other Government Administration |
0 | $0 | | 16 | $5,197 |
| Totals for Government |
3 | $21,036 | $84,144 | 40 | $29,400 |
Parkside government finances - Expenditure in 2017 (per resident):
- Construction - Parks and Recreation: $18,000 ($7.83)
- Current Operations - Police Protection: $812,000 ($353.20)
Solid Waste Management: $172,000 ($74.82)
Regular Highways: $86,000 ($37.41)
Central Staff Services: $82,000 ($35.67)
Financial Administration: $48,000 ($20.88)
Local Fire Protection: $42,000 ($18.27)
Protective Inspection and Regulation - Other: $29,000 ($12.61)
General - Other: $28,000 ($12.18)
Judicial and Legal Services: $26,000 ($11.31)
General Public Buildings: $20,000 ($8.70)
Parks and Recreation: $4,000 ($1.74)
Health - Other: $1,000 ($0.43)
- General - Interest on Debt: $28,000 ($12.18)
- Total Salaries and Wages: $421,000 ($183.12)
Parkside government finances - Revenue in 2017 (per resident):
- Charges - Solid Waste Management: $135,000 ($58.72)
Other: $13,000 ($5.65)
- Miscellaneous - General Revenue - Other: $12,000 ($5.22)
Fines and Forfeits: $10,000 ($4.35)
- State Intergovernmental - Other: $82,000 ($35.67)
Highways: $43,000 ($18.70)
General Local Government Support: $1,000 ($0.43)
- Tax - Property: $721,000 ($313.61)
Individual Income: $180,000 ($78.29)
Public Utility License: $49,000 ($21.31)
Occupation and Business License - Other: $49,000 ($21.31)
Documentary and Stock Transfer: $15,000 ($6.52)
Parkside government finances - Debt in 2017 (per resident):
- Long Term Debt - Beginning Outstanding - Unspecified Public Purpose: $528,000 ($229.67)
Outstanding Unspecified Public Purpose: $501,000 ($217.92)
Retired Unspecified Public Purpose: $27,000 ($11.74)
Parkside government finances - Cash and Securities in 2017 (per resident):
- Other Funds - Cash and Securities: $157,000 ($68.29)
5.79% of this county's 2021 resident taxpayers lived in other counties in 2020 ($87,801 average adjusted gross income)
| Here: | 5.79% |
| Pennsylvania average: | 5.27% |
0.01% of residents moved from foreign countries ($122 average AGI)| Delaware County: | 0.01% |
| Pennsylvania average: | 0.01% |
Top counties from which taxpayers relocated into this county between 2020 and 2021:
6.34% of this county's 2020 resident taxpayers moved to other counties in 2021 ($87,816 average adjusted gross income)
| Here: | 6.34% |
| Pennsylvania average: | 5.44% |
0.01% of residents moved to foreign countries ($90 average AGI)| Delaware County: | 0.01% |
| Pennsylvania average: | 0.01% |
Top counties to which taxpayers relocated from this county between 2020 and 2021:
Strongest AM radio stations in Parkside:
- WVCH (740 AM; 50 kW; CHESTER, PA; Owner: WVCH COMMUNICATIONS, INC.)
- WPEN (950 AM; 50 kW; PHILADELPHIA, PA; Owner: GREATER PHILADELPHIA RADIO, INC.)
- WZZD (990 AM; 50 kW; PHILADELPHIA, PA; Owner: PENNSYLVANIA MEDIA ASSOCIATES, INC.)
- WNWR (1540 AM; 50 kW; PHILADELPHIA, PA)
- KYW (1060 AM; 50 kW; PHILADELPHIA, PA; Owner: INFINITY BROADCASTING OPERATIONS, INC.)
- WPWA (1590 AM; 2 kW; CHESTER, PA; Owner: MOUNT OCEAN MEDIA, L.L.C.)
- WPHT (1210 AM; 50 kW; PHILADELPHIA, PA; Owner: INFINITY BROADCASTING OPERATIONS, INC.)
- WDEL (1150 AM; 5 kW; WILMINGTON, DE; Owner: DELMARVA BROADCASTING COMPANY)
- WWJZ (640 AM; 50 kW; MOUNT HOLLY, NJ; Owner: ABC, INC.)
- WIP (610 AM; 5 kW; PHILADELPHIA, PA; Owner: INFINITY BROADCASTING CORPORATION OF PHILADELPHIA)
- WFIL (560 AM; 5 kW; PHILADELPHIA, PA; Owner: PENNSYLVANIA MEDIA ASSOCIATES, INC.)
- WWDB (860 AM; daytime; 10 kW; PHILADELPHIA, PA)
- WTMR (800 AM; 5 kW; CAMDEN, NJ; Owner: WTMR LICENSE LIMITED PARTNERSHIP)
Strongest FM radio stations in Parkside:
- WPLY (100.3 FM; MEDIA, PA; Owner: RADIO ONE LICENSES, LLC)
- WDNR (89.5 FM; CHESTER, PA; Owner: WIDENER COLLEGE)
- W278AK (103.5 FM; VILLAGE GREEN, PA; Owner: PRIORITY RADIO, INC.)
- WMGK (102.9 FM; PHILADELPHIA, PA; Owner: GREATER PHILADELPHIA RADIO, INC.)
- WMWX (95.7 FM; PHILADELPHIA, PA; Owner: GREATER PHILADELPHIA RADIO, INC.)
- WSRN-FM (91.5 FM; SWARTHMORE, PA; Owner: SWARTHMORE COLLEGE)
- WOGL (98.1 FM; PHILADELPHIA, PA; Owner: INFINITY BROADCASTING OPERATIONS, INC.)
- WJBR-FM (99.5 FM; WILMINGTON, DE; Owner: NM LICENSING, LLC)
- WBEB (101.1 FM; PHILADELPHIA, PA; Owner: WEAZ-FM RADIO, INC.)
- WRTI (90.1 FM; PHILADELPHIA, PA; Owner: TEMPLE UNIV. OF THE COMMONWEALTH, ET)
- WSNI-FM (104.5 FM; PHILADELPHIA, PA; Owner: AMFM RADIO LICENSES, L.L.C.)
- WPHI-FM (103.9 FM; JENKINTOWN, PA; Owner: RADIO ONE LICENSES, LLC)
- WMMR (93.3 FM; PHILADELPHIA, PA; Owner: GREATER BOSTON RADIO, INC.)
- WSTW (93.7 FM; WILMINGTON, DE; Owner: DELMARVA BROADCASTING COMPANY)
- WHYY-FM (90.9 FM; PHILADELPHIA, PA; Owner: WHYY, INC.)
- WXPN (88.5 FM; PHILADELPHIA, PA; Owner: TRUSTEES OF THE UNIVERSITY OF PENNA.)
- WXTU (92.5 FM; PHILADELPHIA, PA; Owner: WXTU LICENSE LIMITED PARTNERSHIP)
- WDAS-FM (105.3 FM; PHILADELPHIA, PA; Owner: AMFM RADIO LICENSES, L.L.C.)
- WPTP (96.5 FM; PHILADELPHIA, PA; Owner: WDAS LICENSE LIMITED PARTNERSHIP)
- WUSL (98.9 FM; PHILADELPHIA, PA; Owner: AMFM RADIO LICENSES, L.L.C.)
TV broadcast stations around Parkside:
- KYW-TV (Channel 3; PHILADELPHIA, PA; Owner: CBS BROADCASTING INC.)
- WPHL-TV (Channel 17; PHILADELPHIA, PA; Owner: TRIBUNE TELEVISION COMPANY)
- WPVI-TV (Channel 6; PHILADELPHIA, PA; Owner: ABC, INC.)
- WPPX (Channel 61; WILMINGTON, DE; Owner: PAXSON PHILADELPHIA LICENSE, INC.)
- WPSG (Channel 57; PHILADELPHIA, PA; Owner: VIACOM STATIONS GROUP OF PHILADELPHIA INC.)
- WWJT-LP (Channel 7; PHILADELPHIA, PA; Owner: PHILADELPHIA TELEVISION NETWORK, INC)
- WCAU (Channel 10; PHILADELPHIA, PA; Owner: NBC SUBSIDIARY (WCAU-TV), L.P.)
- WGTW (Channel 48; BURLINGTON, NJ; Owner: BRUNSON COMMUNICATIONS, INC.)
- WYBE (Channel 35; PHILADELPHIA, PA; Owner: INDEPENDENCE PUBLIC MEDIA OF PHILADELPHIA, INC.)
- WHYY-TV (Channel 12; WILMINGTON, DE; Owner: WHYY, INC.)
- WTXF-TV (Channel 29; PHILADELPHIA, PA; Owner: FOX TV STATIONS OF PHILADELPHIA)
- W40AZ (Channel 40; WILMINGTON, DE; Owner: NATIONAL MINORITY T.V., INC.)
- W55BT (Channel 55; TALLEYVILLE, DE; Owner: MEDIACASTING LLC)
- WELL-LP (Channel 8; WILLOW GROVE, ETC., PA; Owner: WORD OF GOD FELLOWSHIP, INC.)
- WFPA-CA (Channel 28; PHILADELPHIA, PA; Owner: WXTV LICENSE PARTNERSHIP, G.P.)
- WUVP (Channel 65; VINELAND, NJ; Owner: UNIVISION PHILADELPHIA LLC)
- WPHA-LP (Channel 63; PHILADELPHIA, PA; Owner: COMMERCIAL BROADCASTING CORP.)
- WTSD-CA (Channel 14; WILMINGTON, DE; Owner: PRIORITY COMMUNICATIONS MINISTRIES, INC.)
- WMCN-TV (Channel 53; ATLANTIC CITY, NJ; Owner: LENFEST BROADCASTING, LLC)
- WNJS (Channel 23; CAMDEN, NJ; Owner: NEW JERSEY PUBLIC BROADCASTING AUTHORITY)
- WPSJ-LP (Channel 8; HAMMONTON, ETC., NJ; Owner: ENGLE BROADCASTING)
- W33BT (Channel 33; CAMDEN, NJ; Owner: MEDIACASTING LLC)
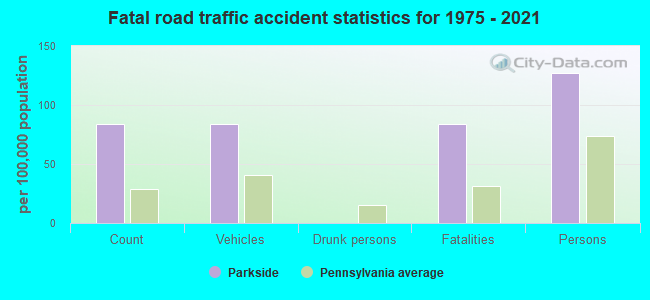
Parkside fatal accident list:
Feb 14, 1990 08:34 PM, E Chelton, Vehicles: 1, Persons: 1, Fatalities: 1
Apr 17, 1980 04:00 PM, Vehicles: 1, Persons: 2, Fatalities: 1
FCC Registered Amateur Radio Licenses:
1
- Call Sign: WA3UYI, Licensee ID: L00247034, Grant Date: 12/08/2015, Expiration Date: 02/08/2026, Registrant: Eric I Furness, 112 W Forestview Rd, Parkside, PA 19015
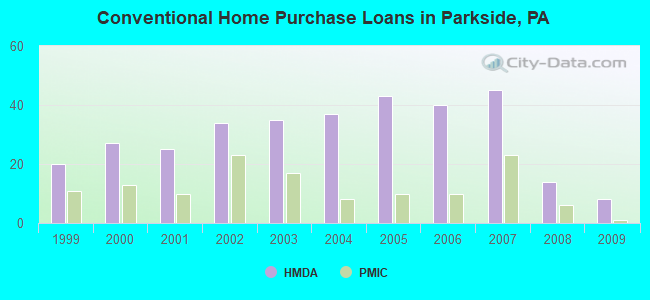
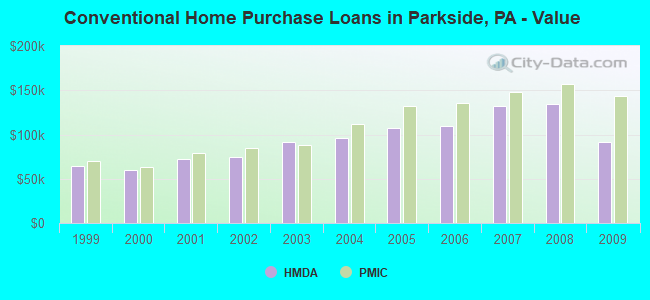
Home Mortgage Disclosure Act Aggregated Statistics For Year 2009
(Based on 1 full tract)
|
| A) FHA, FSA/RHS & VA
Home Purchase Loans | B) Conventional
Home Purchase Loans | C) Refinancings
| D) Home Improvement Loans
| F) Non-occupant Loans on
< 5 Family Dwellings (A B C & D) | G) Loans On Manufactured
Home Dwelling (A B C & D) |
|---|
| Number | Average Value | Number | Average Value | Number | Average Value | Number | Average Value | Number | Average Value | Number | Average Value |
|---|
| LOANS ORIGINATED | 22 | $156,864 | 8 | $91,375 | 47 | $126,872 | 9 | $32,000 | 3 | $94,667 | 0 | $0 |
| APPLICATIONS APPROVED, NOT ACCEPTED | 0 | $0 | 0 | $0 | 5 | $140,800 | 2 | $4,000 | 0 | $0 | 0 | $0 |
| APPLICATIONS DENIED | 2 | $128,500 | 1 | $13,000 | 18 | $129,167 | 9 | $23,667 | 1 | $100,000 | 1 | $5,000 |
| APPLICATIONS WITHDRAWN | 1 | $157,000 | 0 | $0 | 5 | $123,800 | 1 | $30,000 | 1 | $85,000 | 0 | $0 |
| FILES CLOSED FOR INCOMPLETENESS | 0 | $0 | 0 | $0 | 6 | $121,333 | 1 | $83,000 | 0 | $0 | 0 | $0 |
Aggregated Statistics For Year 2008
(Based on 1 full tract)
|
| A) FHA, FSA/RHS & VA
Home Purchase Loans | B) Conventional
Home Purchase Loans | C) Refinancings
| D) Home Improvement Loans
| F) Non-occupant Loans on
< 5 Family Dwellings (A B C & D) |
|---|
| Number | Average Value | Number | Average Value | Number | Average Value | Number | Average Value | Number | Average Value |
|---|
| LOANS ORIGINATED | 14 | $153,357 | 14 | $134,286 | 47 | $105,617 | 8 | $24,625 | 4 | $80,750 |
| APPLICATIONS APPROVED, NOT ACCEPTED | 0 | $0 | 2 | $140,000 | 9 | $119,000 | 3 | $15,667 | 0 | $0 |
| APPLICATIONS DENIED | 2 | $163,000 | 2 | $161,000 | 39 | $135,744 | 13 | $28,846 | 0 | $0 |
| APPLICATIONS WITHDRAWN | 1 | $126,000 | 2 | $112,500 | 10 | $158,500 | 1 | $25,000 | 1 | $96,000 |
| FILES CLOSED FOR INCOMPLETENESS | 1 | $183,000 | 2 | $124,000 | 7 | $145,571 | 1 | $155,000 | 2 | $93,000 |
Aggregated Statistics For Year 2007
(Based on 1 full tract)
|
| A) FHA, FSA/RHS & VA
Home Purchase Loans | B) Conventional
Home Purchase Loans | C) Refinancings
| D) Home Improvement Loans
| F) Non-occupant Loans on
< 5 Family Dwellings (A B C & D) | G) Loans On Manufactured
Home Dwelling (A B C & D) |
|---|
| Number | Average Value | Number | Average Value | Number | Average Value | Number | Average Value | Number | Average Value | Number | Average Value |
|---|
| LOANS ORIGINATED | 5 | $160,200 | 45 | $131,867 | 35 | $123,714 | 19 | $39,263 | 6 | $117,500 | 0 | $0 |
| APPLICATIONS APPROVED, NOT ACCEPTED | 0 | $0 | 2 | $129,500 | 5 | $127,000 | 4 | $30,750 | 1 | $160,000 | 0 | $0 |
| APPLICATIONS DENIED | 0 | $0 | 7 | $138,286 | 43 | $120,395 | 16 | $31,750 | 1 | $90,000 | 1 | $20,000 |
| APPLICATIONS WITHDRAWN | 1 | $158,000 | 10 | $135,600 | 16 | $134,500 | 3 | $78,000 | 1 | $113,000 | 0 | $0 |
| FILES CLOSED FOR INCOMPLETENESS | 0 | $0 | 1 | $168,000 | 6 | $120,000 | 0 | $0 | 1 | $175,000 | 0 | $0 |
Aggregated Statistics For Year 2006
(Based on 1 full tract)
|
| A) FHA, FSA/RHS & VA
Home Purchase Loans | B) Conventional
Home Purchase Loans | C) Refinancings
| D) Home Improvement Loans
| F) Non-occupant Loans on
< 5 Family Dwellings (A B C & D) |
|---|
| Number | Average Value | Number | Average Value | Number | Average Value | Number | Average Value | Number | Average Value |
|---|
| LOANS ORIGINATED | 7 | $147,143 | 40 | $109,700 | 60 | $99,483 | 18 | $28,444 | 4 | $121,750 |
| APPLICATIONS APPROVED, NOT ACCEPTED | 1 | $153,000 | 6 | $144,000 | 19 | $84,368 | 3 | $80,000 | 3 | $103,333 |
| APPLICATIONS DENIED | 0 | $0 | 4 | $79,250 | 54 | $101,056 | 13 | $35,692 | 4 | $117,000 |
| APPLICATIONS WITHDRAWN | 0 | $0 | 4 | $120,000 | 22 | $100,955 | 2 | $60,500 | 4 | $85,250 |
| FILES CLOSED FOR INCOMPLETENESS | 0 | $0 | 3 | $167,333 | 8 | $119,125 | 0 | $0 | 0 | $0 |
Aggregated Statistics For Year 2005
(Based on 1 full tract)
|
| A) FHA, FSA/RHS & VA
Home Purchase Loans | B) Conventional
Home Purchase Loans | C) Refinancings
| D) Home Improvement Loans
| F) Non-occupant Loans on
< 5 Family Dwellings (A B C & D) |
|---|
| Number | Average Value | Number | Average Value | Number | Average Value | Number | Average Value | Number | Average Value |
|---|
| LOANS ORIGINATED | 12 | $133,833 | 43 | $107,512 | 80 | $91,062 | 19 | $26,421 | 13 | $81,385 |
| APPLICATIONS APPROVED, NOT ACCEPTED | 1 | $128,000 | 7 | $111,143 | 15 | $88,467 | 3 | $57,000 | 1 | $95,000 |
| APPLICATIONS DENIED | 2 | $163,000 | 17 | $92,294 | 69 | $96,580 | 18 | $42,111 | 3 | $101,000 |
| APPLICATIONS WITHDRAWN | 1 | $135,000 | 3 | $115,000 | 34 | $111,235 | 10 | $158,600 | 1 | $100,000 |
| FILES CLOSED FOR INCOMPLETENESS | 0 | $0 | 3 | $75,667 | 23 | $121,652 | 0 | $0 | 0 | $0 |
Aggregated Statistics For Year 2004
(Based on 1 full tract)
|
| A) FHA, FSA/RHS & VA
Home Purchase Loans | B) Conventional
Home Purchase Loans | C) Refinancings
| D) Home Improvement Loans
| F) Non-occupant Loans on
< 5 Family Dwellings (A B C & D) |
|---|
| Number | Average Value | Number | Average Value | Number | Average Value | Number | Average Value | Number | Average Value |
|---|
| LOANS ORIGINATED | 13 | $117,385 | 37 | $96,216 | 76 | $94,066 | 10 | $24,000 | 12 | $97,750 |
| APPLICATIONS APPROVED, NOT ACCEPTED | 1 | $121,000 | 3 | $106,667 | 13 | $106,385 | 2 | $12,500 | 0 | $0 |
| APPLICATIONS DENIED | 0 | $0 | 4 | $84,500 | 57 | $96,333 | 19 | $43,684 | 0 | $0 |
| APPLICATIONS WITHDRAWN | 0 | $0 | 4 | $95,000 | 46 | $92,804 | 2 | $46,000 | 1 | $59,000 |
| FILES CLOSED FOR INCOMPLETENESS | 0 | $0 | 2 | $47,500 | 27 | $99,593 | 0 | $0 | 0 | $0 |
Aggregated Statistics For Year 2003
(Based on 1 full tract)
|
| A) FHA, FSA/RHS & VA
Home Purchase Loans | B) Conventional
Home Purchase Loans | C) Refinancings
| D) Home Improvement Loans
| F) Non-occupant Loans on
< 5 Family Dwellings (A B C & D) |
|---|
| Number | Average Value | Number | Average Value | Number | Average Value | Number | Average Value | Number | Average Value |
|---|
| LOANS ORIGINATED | 19 | $102,474 | 35 | $92,086 | 121 | $85,603 | 5 | $25,200 | 9 | $76,556 |
| APPLICATIONS APPROVED, NOT ACCEPTED | 0 | $0 | 5 | $70,800 | 24 | $136,000 | 3 | $13,333 | 3 | $72,000 |
| APPLICATIONS DENIED | 0 | $0 | 3 | $112,000 | 64 | $96,469 | 4 | $15,750 | 4 | $78,500 |
| APPLICATIONS WITHDRAWN | 2 | $133,000 | 3 | $81,667 | 34 | $90,441 | 7 | $38,286 | 1 | $85,000 |
| FILES CLOSED FOR INCOMPLETENESS | 0 | $0 | 2 | $102,500 | 6 | $94,000 | 0 | $0 | 1 | $86,000 |
Aggregated Statistics For Year 2002
(Based on 1 full tract)
|
| A) FHA, FSA/RHS & VA
Home Purchase Loans | B) Conventional
Home Purchase Loans | C) Refinancings
| D) Home Improvement Loans
| F) Non-occupant Loans on
< 5 Family Dwellings (A B C & D) |
|---|
| Number | Average Value | Number | Average Value | Number | Average Value | Number | Average Value | Number | Average Value |
|---|
| LOANS ORIGINATED | 20 | $91,950 | 34 | $75,029 | 79 | $834,215 | 8 | $23,375 | 15 | $89,400 |
| APPLICATIONS APPROVED, NOT ACCEPTED | 0 | $0 | 4 | $52,000 | 12 | $69,833 | 1 | $75,000 | 1 | $67,000 |
| APPLICATIONS DENIED | 1 | $74,000 | 2 | $70,000 | 48 | $78,792 | 7 | $30,571 | 2 | $102,500 |
| APPLICATIONS WITHDRAWN | 0 | $0 | 5 | $50,400 | 23 | $83,304 | 0 | $0 | 0 | $0 |
| FILES CLOSED FOR INCOMPLETENESS | 0 | $0 | 4 | $66,000 | 9 | $87,778 | 0 | $0 | 4 | $89,750 |
Aggregated Statistics For Year 2001
(Based on 1 full tract)
|
| A) FHA, FSA/RHS & VA
Home Purchase Loans | B) Conventional
Home Purchase Loans | C) Refinancings
| D) Home Improvement Loans
| F) Non-occupant Loans on
< 5 Family Dwellings (A B C & D) |
|---|
| Number | Average Value | Number | Average Value | Number | Average Value | Number | Average Value | Number | Average Value |
|---|
| LOANS ORIGINATED | 19 | $101,158 | 25 | $71,960 | 35 | $75,971 | 8 | $11,250 | 4 | $71,750 |
| APPLICATIONS APPROVED, NOT ACCEPTED | 0 | $0 | 3 | $49,333 | 10 | $78,800 | 2 | $13,000 | 0 | $0 |
| APPLICATIONS DENIED | 1 | $74,000 | 6 | $66,167 | 41 | $74,561 | 7 | $13,000 | 0 | $0 |
| APPLICATIONS WITHDRAWN | 0 | $0 | 6 | $104,667 | 26 | $73,577 | 2 | $9,500 | 0 | $0 |
| FILES CLOSED FOR INCOMPLETENESS | 0 | $0 | 0 | $0 | 12 | $71,333 | 0 | $0 | 1 | $52,000 |
Aggregated Statistics For Year 2000
(Based on 1 full tract)
|
| A) FHA, FSA/RHS & VA
Home Purchase Loans | B) Conventional
Home Purchase Loans | C) Refinancings
| D) Home Improvement Loans
| F) Non-occupant Loans on
< 5 Family Dwellings (A B C & D) |
|---|
| Number | Average Value | Number | Average Value | Number | Average Value | Number | Average Value | Number | Average Value |
|---|
| LOANS ORIGINATED | 21 | $87,714 | 27 | $59,370 | 27 | $70,704 | 10 | $14,900 | 5 | $78,400 |
| APPLICATIONS APPROVED, NOT ACCEPTED | 1 | $102,000 | 4 | $50,250 | 5 | $70,600 | 6 | $24,500 | 0 | $0 |
| APPLICATIONS DENIED | 1 | $69,000 | 8 | $71,750 | 25 | $67,520 | 24 | $13,875 | 2 | $45,500 |
| APPLICATIONS WITHDRAWN | 2 | $86,000 | 1 | $84,000 | 19 | $77,842 | 1 | $39,000 | 0 | $0 |
| FILES CLOSED FOR INCOMPLETENESS | 0 | $0 | 1 | $46,000 | 2 | $62,500 | 1 | $20,000 | 1 | $46,000 |
Aggregated Statistics For Year 1999
(Based on 1 partial tract)
|
| A) FHA, FSA/RHS & VA
Home Purchase Loans | B) Conventional
Home Purchase Loans | C) Refinancings
| D) Home Improvement Loans
| F) Non-occupant Loans on
< 5 Family Dwellings (A B C & D) |
|---|
| Number | Average Value | Number | Average Value | Number | Average Value | Number | Average Value | Number | Average Value |
|---|
| LOANS ORIGINATED | 18 | $93,495 | 20 | $64,700 | 37 | $61,816 | 10 | $12,540 | 1 | $22,720 |
| APPLICATIONS APPROVED, NOT ACCEPTED | 1 | $81,780 | 4 | $76,558 | 15 | $60,398 | 4 | $18,855 | 1 | $76,330 |
| APPLICATIONS DENIED | 2 | $86,325 | 6 | $205,518 | 33 | $66,445 | 10 | $24,717 | 1 | $71,790 |
| APPLICATIONS WITHDRAWN | 1 | $81,780 | 1 | $71,790 | 21 | $65,643 | 1 | $46,340 | 2 | $54,070 |
| FILES CLOSED FOR INCOMPLETENESS | 0 | $0 | 0 | $0 | 4 | $41,118 | 0 | $0 | 0 | $0 |
Detailed HMDA statistics for the following Tracts:
4061.00
Private Mortgage Insurance Companies Aggregated Statistics For Year 2009
(Based on 1 full tract)
|
| A) Conventional
Home Purchase Loans | B) Refinancings
|
|---|
| Number | Average Value | Number | Average Value |
|---|
| LOANS ORIGINATED | 1 | $143,000 | 1 | $138,000 |
| APPLICATIONS APPROVED, NOT ACCEPTED | 0 | $0 | 0 | $0 |
| APPLICATIONS DENIED | 0 | $0 | 0 | $0 |
| APPLICATIONS WITHDRAWN | 0 | $0 | 0 | $0 |
| FILES CLOSED FOR INCOMPLETENESS | 0 | $0 | 0 | $0 |
Aggregated Statistics For Year 2008
(Based on 1 full tract)
|
| A) Conventional
Home Purchase Loans | B) Refinancings
|
|---|
| Number | Average Value | Number | Average Value |
|---|
| LOANS ORIGINATED | 6 | $156,667 | 2 | $119,000 |
| APPLICATIONS APPROVED, NOT ACCEPTED | 4 | $165,750 | 3 | $169,000 |
| APPLICATIONS DENIED | 1 | $133,000 | 0 | $0 |
| APPLICATIONS WITHDRAWN | 0 | $0 | 1 | $106,000 |
| FILES CLOSED FOR INCOMPLETENESS | 0 | $0 | 0 | $0 |
Aggregated Statistics For Year 2007
(Based on 1 full tract)
|
| A) Conventional
Home Purchase Loans | B) Refinancings
| C) Non-occupant Loans on
< 5 Family Dwellings (A & B) |
|---|
| Number | Average Value | Number | Average Value | Number | Average Value |
|---|
| LOANS ORIGINATED | 23 | $147,565 | 7 | $159,714 | 1 | $135,000 |
| APPLICATIONS APPROVED, NOT ACCEPTED | 2 | $169,000 | 1 | $176,000 | 0 | $0 |
| APPLICATIONS DENIED | 0 | $0 | 1 | $158,000 | 0 | $0 |
| APPLICATIONS WITHDRAWN | 0 | $0 | 2 | $171,000 | 0 | $0 |
| FILES CLOSED FOR INCOMPLETENESS | 0 | $0 | 0 | $0 | 0 | $0 |
Aggregated Statistics For Year 2006
(Based on 1 full tract)
|
| A) Conventional
Home Purchase Loans | B) Refinancings
|
|---|
| Number | Average Value | Number | Average Value |
|---|
| LOANS ORIGINATED | 10 | $136,100 | 4 | $137,750 |
| APPLICATIONS APPROVED, NOT ACCEPTED | 1 | $140,000 | 2 | $136,000 |
| APPLICATIONS DENIED | 0 | $0 | 0 | $0 |
| APPLICATIONS WITHDRAWN | 2 | $142,000 | 0 | $0 |
| FILES CLOSED FOR INCOMPLETENESS | 0 | $0 | 0 | $0 |
Aggregated Statistics For Year 2005
(Based on 1 full tract)
|
| A) Conventional
Home Purchase Loans | B) Refinancings
| C) Non-occupant Loans on
< 5 Family Dwellings (A & B) |
|---|
| Number | Average Value | Number | Average Value | Number | Average Value |
|---|
| LOANS ORIGINATED | 10 | $132,700 | 5 | $128,400 | 2 | $84,000 |
| APPLICATIONS APPROVED, NOT ACCEPTED | 0 | $0 | 1 | $153,000 | 0 | $0 |
| APPLICATIONS DENIED | 0 | $0 | 0 | $0 | 0 | $0 |
| APPLICATIONS WITHDRAWN | 0 | $0 | 0 | $0 | 0 | $0 |
| FILES CLOSED FOR INCOMPLETENESS | 0 | $0 | 0 | $0 | 0 | $0 |
Aggregated Statistics For Year 2004
(Based on 1 full tract)
|
| A) Conventional
Home Purchase Loans | B) Refinancings
| C) Non-occupant Loans on
< 5 Family Dwellings (A & B) |
|---|
| Number | Average Value | Number | Average Value | Number | Average Value |
|---|
| LOANS ORIGINATED | 8 | $112,250 | 7 | $97,857 | 1 | $79,000 |
| APPLICATIONS APPROVED, NOT ACCEPTED | 5 | $84,800 | 3 | $116,333 | 0 | $0 |
| APPLICATIONS DENIED | 0 | $0 | 1 | $90,000 | 0 | $0 |
| APPLICATIONS WITHDRAWN | 0 | $0 | 0 | $0 | 0 | $0 |
| FILES CLOSED FOR INCOMPLETENESS | 0 | $0 | 0 | $0 | 0 | $0 |
Aggregated Statistics For Year 2003
(Based on 1 full tract)
|
| A) Conventional
Home Purchase Loans | B) Refinancings
| C) Non-occupant Loans on
< 5 Family Dwellings (A & B) |
|---|
| Number | Average Value | Number | Average Value | Number | Average Value |
|---|
| LOANS ORIGINATED | 17 | $88,059 | 16 | $100,562 | 3 | $119,667 |
| APPLICATIONS APPROVED, NOT ACCEPTED | 2 | $67,500 | 3 | $85,667 | 0 | $0 |
| APPLICATIONS DENIED | 0 | $0 | 0 | $0 | 0 | $0 |
| APPLICATIONS WITHDRAWN | 2 | $78,000 | 0 | $0 | 0 | $0 |
| FILES CLOSED FOR INCOMPLETENESS | 0 | $0 | 0 | $0 | 0 | $0 |
Aggregated Statistics For Year 2002
(Based on 1 full tract)
|
| A) Conventional
Home Purchase Loans | B) Refinancings
| C) Non-occupant Loans on
< 5 Family Dwellings (A & B) |
|---|
| Number | Average Value | Number | Average Value | Number | Average Value |
|---|
| LOANS ORIGINATED | 23 | $84,435 | 5 | $102,800 | 2 | $95,000 |
| APPLICATIONS APPROVED, NOT ACCEPTED | 3 | $79,333 | 6 | $104,167 | 3 | $117,000 |
| APPLICATIONS DENIED | 0 | $0 | 0 | $0 | 0 | $0 |
| APPLICATIONS WITHDRAWN | 0 | $0 | 1 | $80,000 | 0 | $0 |
| FILES CLOSED FOR INCOMPLETENESS | 0 | $0 | 0 | $0 | 0 | $0 |
Aggregated Statistics For Year 2001
(Based on 1 full tract)
|
| A) Conventional
Home Purchase Loans | B) Refinancings
|
|---|
| Number | Average Value | Number | Average Value |
|---|
| LOANS ORIGINATED | 10 | $79,000 | 5 | $99,600 |
| APPLICATIONS APPROVED, NOT ACCEPTED | 0 | $0 | 2 | $105,000 |
| APPLICATIONS DENIED | 0 | $0 | 0 | $0 |
| APPLICATIONS WITHDRAWN | 0 | $0 | 0 | $0 |
| FILES CLOSED FOR INCOMPLETENESS | 0 | $0 | 0 | $0 |
Aggregated Statistics For Year 2000
(Based on 1 full tract)
|
| A) Conventional
Home Purchase Loans | B) Refinancings
| C) Non-occupant Loans on
< 5 Family Dwellings (A & B) |
|---|
| Number | Average Value | Number | Average Value | Number | Average Value |
|---|
| LOANS ORIGINATED | 13 | $63,000 | 0 | $0 | 1 | $46,000 |
| APPLICATIONS APPROVED, NOT ACCEPTED | 2 | $86,500 | 1 | $72,000 | 0 | $0 |
| APPLICATIONS DENIED | 1 | $95,000 | 1 | $113,000 | 0 | $0 |
| APPLICATIONS WITHDRAWN | 1 | $51,000 | 0 | $0 | 0 | $0 |
| FILES CLOSED FOR INCOMPLETENESS | 0 | $0 | 0 | $0 | 0 | $0 |
Aggregated Statistics For Year 1999
(Based on 1 partial tract)
|
| A) Conventional
Home Purchase Loans | B) Refinancings
|
|---|
| Number | Average Value | Number | Average Value |
|---|
| LOANS ORIGINATED | 11 | $70,383 | 5 | $83,600 |
| APPLICATIONS APPROVED, NOT ACCEPTED | 1 | $69,970 | 0 | $0 |
| APPLICATIONS DENIED | 0 | $0 | 0 | $0 |
| APPLICATIONS WITHDRAWN | 0 | $0 | 0 | $0 |
| FILES CLOSED FOR INCOMPLETENESS | 0 | $0 | 0 | $0 |
Detailed PMIC statistics for the following Tracts:
4061.00
Parkside compared to Pennsylvania state average:
- Unemployed percentage significantly below state average.
- Hispanic race population percentage below state average.
- Median age below state average.
- Foreign-born population percentage below state average.
- Length of stay since moving in above state average.