Halfway House, Pennsylvania
Submit your own pictures of this place and show them to the world
- OSM Map
- General Map
- Google Map
- MSN Map
- OSM Map
- General Map
- Google Map
- MSN Map
- OSM Map
- General Map
- Google Map
- MSN Map
- OSM Map
- General Map
- Google Map
- MSN Map
Please wait while loading the map...
Population in 2010: 2,881.
Population change since 2000: +58.0%
| Males: 1,492 |  (51.8%) (51.8%) |
| Females: 1,389 |  (48.2%) (48.2%) |

Profiles of local businesses
Business Search - 14 Million verified businesses
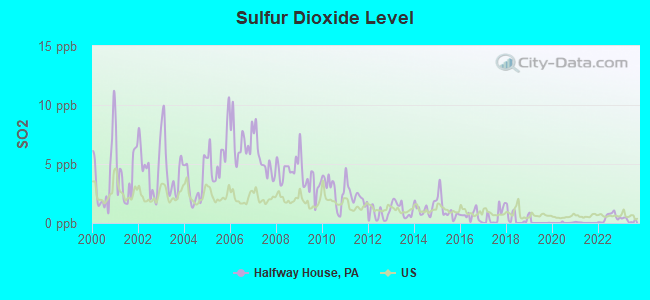
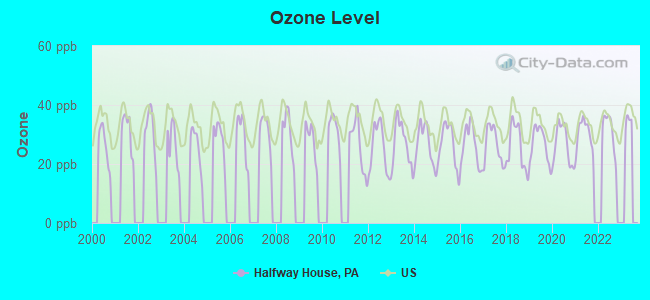
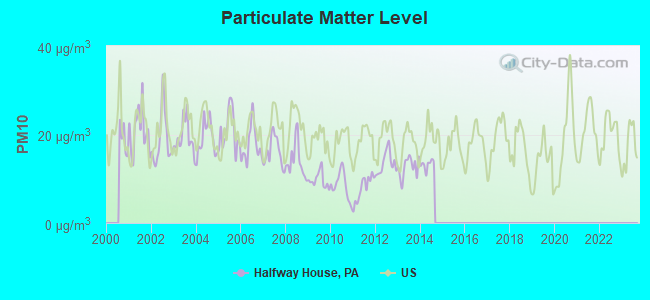
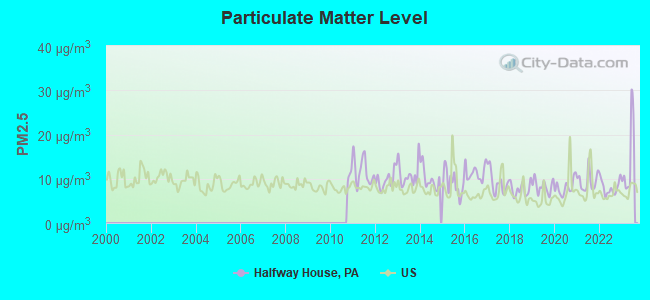
Data:
 Recent articles from our blog. Our writers, many of them Ph.D. graduates or candidates, create easy-to-read articles on a wide variety of topics.
Latest news from Halfway House, PA collected exclusively by city-data.com from local newspapers, TV, and radio stations
Ancestries: German (15.8%), British (8.4%), Lithuanian (7.3%), Jordanian (7.0%), Irish (5.9%), English (3.9%).
Current Local Time: EST time zone
Land area: 2.00 square miles.
Population density: 1,443 people per square mile (low).
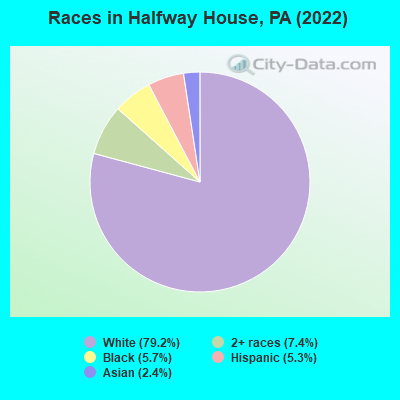
325 residents are foreign born (8.0% Asia).
| This place: | 9.7% |
| Pennsylvania: | 7.3% |
Median real estate property taxes paid for housing units with mortgages in 2022: $5,796 (2.0%)
Median real estate property taxes paid for housing units with no mortgage in 2022: $4,843 (1.8%)
Nearest city with pop. 50,000+: Reading, PA  (15.8 miles , pop. 81,207).
Nearest city with pop. 200,000+: Philadelphia, PA (32.4 miles , pop. 1,517,550).
Nearest cities:
Latitude: 40.27 N, Longitude: 75.64 W
Area code commonly used in this area: 610
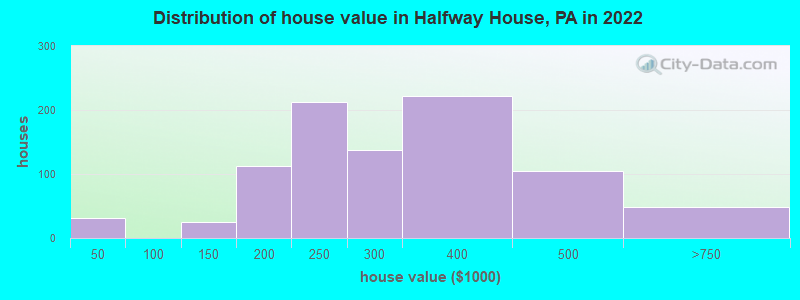
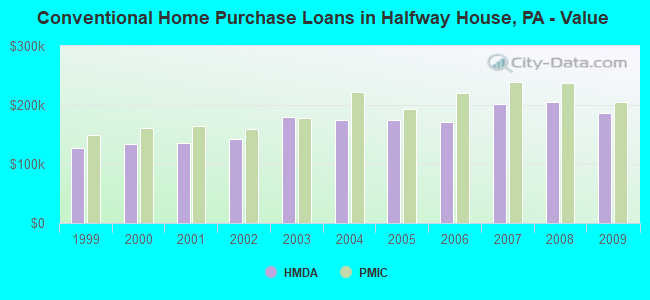
Property values in Halfway House, PA
Unemployment in December 2023:
| Here: | 2.4% |
| Pennsylvania: | 2.9% |
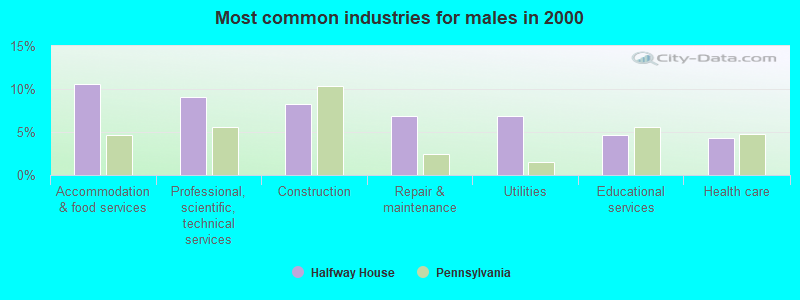
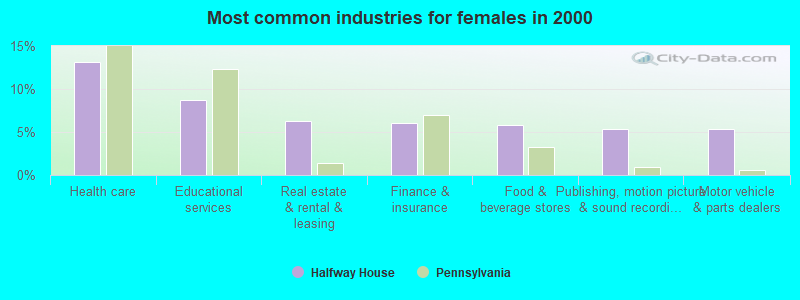
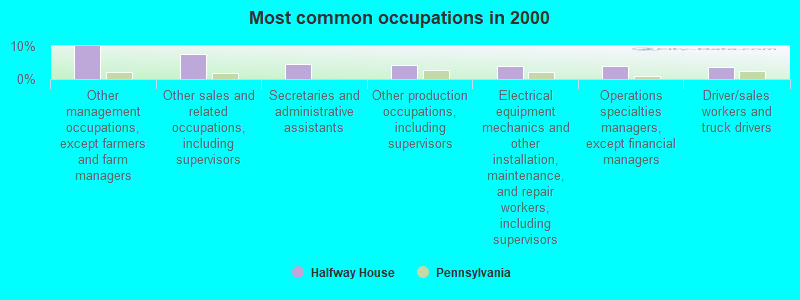
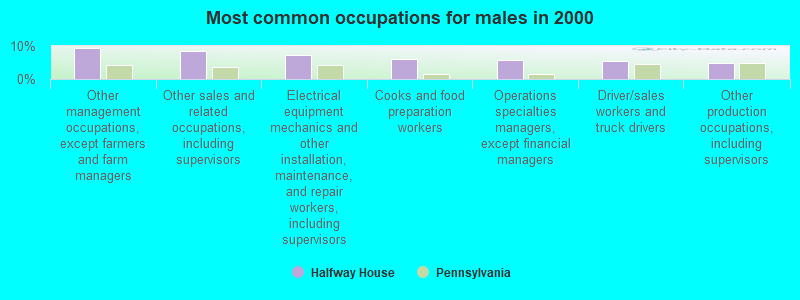
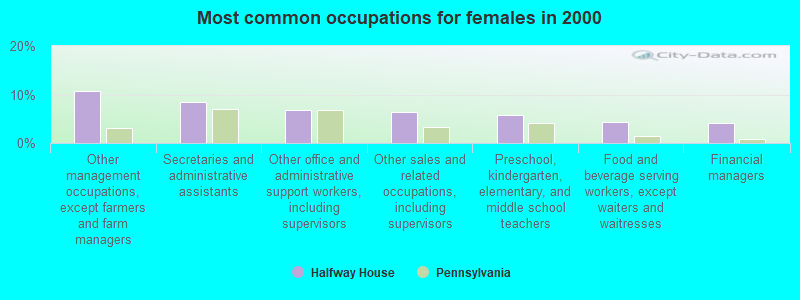
Most common occupations in Halfway House, PA (%)
Both
Males
Females


- Other management occupations, except farmers and farm managers (9.9%)
- Other sales and related occupations, including supervisors (7.5%)
- Secretaries and administrative assistants (4.5%)
- Other production occupations, including supervisors (4.3%)
- Electrical equipment mechanics and other installation, maintenance, and repair workers, including supervisors (4.0%)
- Operations specialties managers, except financial managers (3.9%)
- Driver/sales workers and truck drivers (3.8%)

- Other management occupations, except farmers and farm managers (9.3%)
- Other sales and related occupations, including supervisors (8.5%)
- Electrical equipment mechanics and other installation, maintenance, and repair workers, including supervisors (7.3%)
- Cooks and food preparation workers (6.1%)
- Operations specialties managers, except financial managers (5.7%)
- Driver/sales workers and truck drivers (5.5%)
- Other production occupations, including supervisors (4.9%)

- Other management occupations, except farmers and farm managers (10.7%)
- Secretaries and administrative assistants (8.5%)
- Other office and administrative support workers, including supervisors (6.8%)
- Other sales and related occupations, including supervisors (6.3%)
- Preschool, kindergarten, elementary, and middle school teachers (5.8%)
- Food and beverage serving workers, except waiters and waitresses (4.4%)
- Financial managers (4.1%)
Tornado activity:
Halfway House-area historical tornado activity is slightly above Pennsylvania state average. It is 13% greater than the overall U.S. average.
On 7/27/1994, a category F3 (max. wind speeds 158-206 mph) tornado 7.0 miles away from the Halfway House place center killed 3 people and injured 25 people and caused between $5,000,000 and $50,000,000 in damages.
On 5/31/1998, a category F3 tornado 15.0 miles away from the place center injured 7 people and caused $1 million in damages.
Earthquake activity:
Halfway House-area historical earthquake activity is significantly above Pennsylvania state average. It is 66% smaller than the overall U.S. average.
On 8/23/2011 at 17:51:04, a magnitude 5.8 (5.8 MW, Depth: 3.7 mi, Class: Moderate, Intensity: VI - VII) earthquake occurred 204.8 miles away from the city center
On 1/16/1994 at 01:49:16, a magnitude 4.6 (4.6 MB, 4.6 LG, Depth: 3.1 mi, Class: Light, Intensity: IV - V) earthquake occurred 21.3 miles away from the city center
On 1/16/1994 at 00:42:43, a magnitude 4.2 (4.2 MB, 4.0 LG, Depth: 3.1 mi) earthquake occurred 19.7 miles away from Halfway House center
On 10/7/1983 at 10:18:46, a magnitude 5.3 (5.1 MB, 5.3 LG, 5.1 ML) earthquake occurred 263.0 miles away from Halfway House center
On 9/25/1998 at 19:52:52, a magnitude 5.2 (4.8 MB, 4.3 MS, 5.2 LG, 4.5 MW, Depth: 3.1 mi) earthquake occurred 262.6 miles away from the city center
On 11/30/2017 at 21:47:31, a magnitude 4.1 (4.1 MW, Depth: 6.1 mi) earthquake occurred 75.3 miles away from Halfway House center
Magnitude types: regional Lg-wave magnitude (LG), body-wave magnitude (MB), local magnitude (ML), surface-wave magnitude (MS), moment magnitude (MW)
Natural disasters:
The number of natural disasters in Montgomery County (26) is a lot greater than the US average (15).
Major Disasters (Presidential) Declared: 20
Emergencies Declared: 6
Causes of natural disasters: Hurricanes: 7, Floods: 5, Winter Storms: 5, Storms: 4, Tropical Storms: 4, Snowstorms: 3, Blizzard: 1, Mudslide: 1, Snowfall: 1, Tropical Depression: 1, Water Shortage: 1, Other: 1 (Note: some incidents may be assigned to more than one category).
![Halfway House topographic map]()
Hospitals and medical centers near Halfway House:
- MANORCARE HEALTH SERVICES-POTTSTOWN (Nursing Home, about 1 miles away; POTTSTOWN, PA)
- LIFEPATH, INC (Hospital, about 2 miles away; POTTSTOWN, PA)
- LIFEPATH, INC (Hospital, about 3 miles away; POTTSTOWN, PA)
- RENAL CARE CENTER - POTTSTOWN MEMORIAL MEDICAL CENTER (Dialysis Facility, about 3 miles away; POTTSTOWN, PA)
- TRI COUNTY HOME HEALTH (Home Health Center, about 3 miles away; POTTSTOWN, PA)
- US RENAL CARE POTTSTOWN (Dialysis Facility, about 3 miles away; POTTSTOWN, PA)
- VNA OF POTTSTOWN AND VICINITY (Home Health Center, about 3 miles away; POTTSTOWN, PA)
Amtrak stations near Halfway House:
- 18 miles: EXTON (CREST AVE. OFF RTE. 100) . Services: partially wheelchair accessible, public payphones, paid short-term parking, call for car rental service, public transit connection.
- 19 miles: PAOLI (LANCASTER PIKE & S. VALLEY RD.) . Services: ticket office, enclosed waiting area, public restrooms, public payphones, ATM, paid short-term parking, paid long-term parking, call for car rental service, call for taxi service, public transit connection.
- 20 miles: DOWNINGTOWN (VIADUCT AVE.) . Services: public payphones, paid short-term parking, call for car rental service, call for taxi service, public transit connection.
Operable nuclear power plants near Halfway House:
- 2 miles: Limerick 1 and 2 in Pottstown, PA.
Colleges/universities with over 2000 students nearest to Halfway House:
- Universal Technical Institute of Pennsylvania Inc (about 15 miles; Exton, PA; Full-time enrollment: 2,731)
- Albright College (about 16 miles; Reading, PA; FT enrollment: 2,319)
- Alvernia University (about 16 miles; Reading, PA; FT enrollment: 2,461)
- Reading Area Community College (about 17 miles; Reading, PA; FT enrollment: 2,941)
- Immaculata University (about 18 miles; Immaculata, PA; FT enrollment: 2,912)
- Kutztown University of Pennsylvania (about 19 miles; Kutztown, PA; FT enrollment: 9,099)
- Pennsylvania State University-Penn State Berks (about 19 miles; Reading, PA; FT enrollment: 2,605)
Average household size:| This place: | 2.8 people |
| Pennsylvania: | 2.5 people |
Percentage of family households:| This place: | 77.7% |
| Whole state: | 65.0% |
Percentage of households with unmarried partners:| This place: | 6.9% |
| Whole state: | 6.6% |
Likely homosexual households (counted as self-reported same-sex unmarried-partner households)
- Lesbian couples: 0.3% of all households
- Gay men: 0.8% of all households
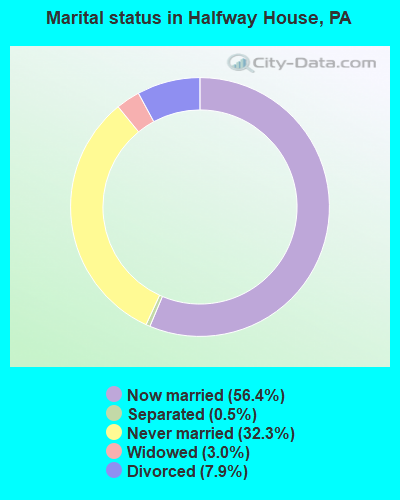
For population 15 years and over in Halfway House:
- Never married: 32.3%
- Now married: 56.4%
- Separated: 0.5%
- Widowed: 3.0%
- Divorced: 7.9%
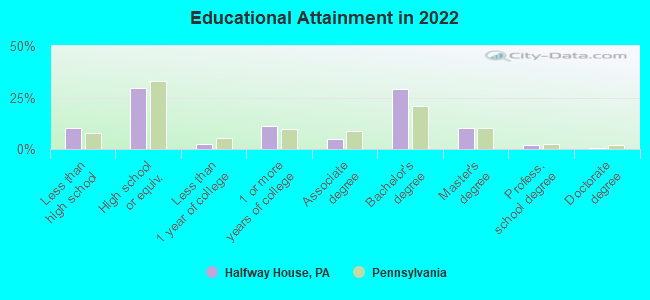
For population 25 years and over in Halfway House:
- High school or higher: 89.9%
- Bachelor's degree or higher: 40.0%
- Graduate or professional degree: 11.2%
- Unemployed: 1.3%
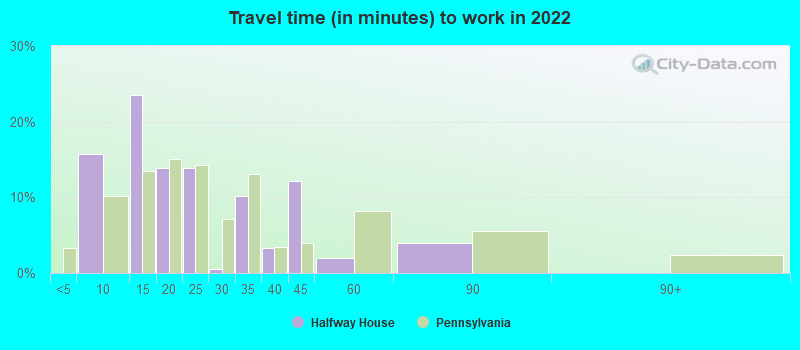
- Mean travel time to work (commute): 24.9 minutes
Education Gini index (Inequality in education)| Here: | 10.4 |
| Pennsylvania average: | 11.4 |
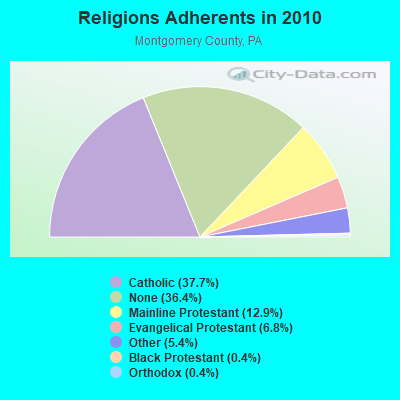
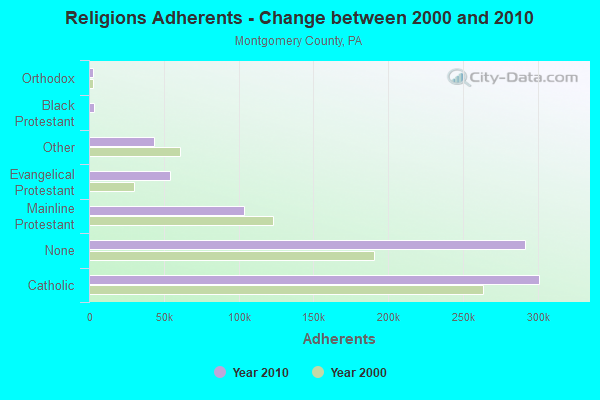
Religion statistics for Halfway House, PA (based on Montgomery County data)
| Religion | Adherents | Congregations |
|---|
| Catholic | 301,220 | 55 |
| Mainline Protestant | 103,475 | 221 |
| Evangelical Protestant | 54,215 | 269 |
| Other | 43,532 | 68 |
| Black Protestant | 3,190 | 11 |
| Orthodox | 2,945 | 9 |
| None | 291,297 | - |
Food Environment Statistics:
Number of grocery stores: 126| This county: | 1.63 / 10,000 pop. |
| Pennsylvania: | 2.04 / 10,000 pop. |
Number of supercenters and club stores: 4| Montgomery County: | 0.05 / 10,000 pop. |
| State: | 0.09 / 10,000 pop. |
Number of convenience stores (no gas): 90| Montgomery County: | 1.16 / 10,000 pop. |
| State: | 0.88 / 10,000 pop. |
Number of convenience stores (with gas): 137| This county: | 1.77 / 10,000 pop. |
| Pennsylvania: | 2.52 / 10,000 pop. |
Number of full-service restaurants: 590| Montgomery County: | 7.61 / 10,000 pop. |
| Pennsylvania: | 7.12 / 10,000 pop. |
Adult diabetes rate: | This county: | 8.3% |
| Pennsylvania: | 9.1% |
Adult obesity rate: | Montgomery County: | 23.4% |
| Pennsylvania: | 27.2% |
Low-income preschool obesity rate:
Health and Nutrition:
Healthy diet rate: | Halfway House: | 58.1% |
| Pennsylvania: | 50.2% |
Average overall health of teeth and gums: | Halfway House: | 59.6% |
| Pennsylvania: | 47.1% |
Average BMI: | Halfway House: | 27.6 |
| Pennsylvania: | 28.7 |
People feeling badly about themselves: | Halfway House: | 19.9% |
| Pennsylvania: | 20.8% |
People not drinking alcohol at all: | Here: | 7.1% |
| Pennsylvania: | 10.9% |
Average hours sleeping at night: | This city: | 7.0 |
| Pennsylvania: | 6.8 |
Overweight people: | This city: | 33.1% |
| Pennsylvania: | 34.3% |
General health condition: | Halfway House: | 65.0% |
| Pennsylvania: | 56.2% |
Average condition of hearing: | This city: | 82.4% |
| Pennsylvania: | 78.3% |
More about Health and Nutrition of Halfway House, PA Residents
6.73% of this county's 2021 resident taxpayers lived in other counties in 2020 ($101,242 average adjusted gross income)
| Here: | 6.73% |
| Pennsylvania average: | 5.27% |
0.01% of residents moved from foreign countries ($62 average AGI)| Montgomery County: | 0.01% |
| Pennsylvania average: | 0.01% |
Top counties from which taxpayers relocated into this county between 2020 and 2021:
6.38% of this county's 2020 resident taxpayers moved to other counties in 2021 ($104,034 average adjusted gross income)
| Here: | 6.38% |
| Pennsylvania average: | 5.44% |
0.01% of residents moved to foreign countries ($121 average AGI)| Montgomery County: | 0.01% |
| Pennsylvania average: | 0.01% |
Top counties to which taxpayers relocated from this county between 2020 and 2021:
Strongest AM radio stations in Halfway House:
- WPAZ (1370 AM; 1 kW; POTTSTOWN, PA; Owner: GREAT SCOTT BROADCASTING)
- WWJZ (640 AM; 50 kW; MOUNT HOLLY, NJ; Owner: ABC, INC.)
- WZZD (990 AM; 50 kW; PHILADELPHIA, PA; Owner: PENNSYLVANIA MEDIA ASSOCIATES, INC.)
- KYW (1060 AM; 50 kW; PHILADELPHIA, PA; Owner: INFINITY BROADCASTING OPERATIONS, INC.)
- WVCH (740 AM; 50 kW; CHESTER, PA; Owner: WVCH COMMUNICATIONS, INC.)
- WEEU (830 AM; 20 kW; READING, PA; Owner: WEEU BROADCASTING COMPANY)
- WPEN (950 AM; 50 kW; PHILADELPHIA, PA; Owner: GREATER PHILADELPHIA RADIO, INC.)
- WNWR (1540 AM; 50 kW; PHILADELPHIA, PA)
- WWDB (860 AM; daytime; 10 kW; PHILADELPHIA, PA)
- WPHT (1210 AM; 50 kW; PHILADELPHIA, PA; Owner: INFINITY BROADCASTING OPERATIONS, INC.)
- WFIL (560 AM; 5 kW; PHILADELPHIA, PA; Owner: PENNSYLVANIA MEDIA ASSOCIATES, INC.)
- WPHE (690 AM; daytime; 1 kW; PHOENIXVILLE, PA; Owner: SALVATION BROADCASTING CO.)
- WNAP (1110 AM; daytime; 5 kW; NORRISTOWN, PA; Owner: WNAP, INC)
Strongest FM radio stations in Halfway House:
- WBYN (107.5 FM; BOYERTOWN, PA; Owner: WDAC RADIO COMPANY)
- WRFY-FM (102.5 FM; READING, PA; Owner: CLEAR CHANNEL BROADCASTING LICENSES, INC.)
- WPLY (100.3 FM; MEDIA, PA; Owner: RADIO ONE LICENSES, LLC)
- WLEV (100.7 FM; ALLENTOWN, PA; Owner: CITADEL BROADCASTING COMPANY)
- WBMP (88.1 FM; WARWICK, PA; Owner: FOUR RIVERS COMMUNITY BROADCASTING CORP.)
- WMWX (95.7 FM; PHILADELPHIA, PA; Owner: GREATER PHILADELPHIA RADIO, INC.)
- WMGK (102.9 FM; PHILADELPHIA, PA; Owner: GREATER PHILADELPHIA RADIO, INC.)
- WOGL (98.1 FM; PHILADELPHIA, PA; Owner: INFINITY BROADCASTING OPERATIONS, INC.)
- WDIY (88.1 FM; ALLENTOWN, PA; Owner: LEHIGH VALLEY COMMUNITY BR/CST ASSOC)
- WSNI-FM (104.5 FM; PHILADELPHIA, PA; Owner: AMFM RADIO LICENSES, L.L.C.)
- WBEB (101.1 FM; PHILADELPHIA, PA; Owner: WEAZ-FM RADIO, INC.)
- WRTI (90.1 FM; PHILADELPHIA, PA; Owner: TEMPLE UNIV. OF THE COMMONWEALTH, ET)
- WPHI-FM (103.9 FM; JENKINTOWN, PA; Owner: RADIO ONE LICENSES, LLC)
- WJCS (89.3 FM; ALLENTOWN, PA; Owner: BEACON BROADCASTING CORPORATION)
- WIOV-FM1 (105.1 FM; READING, PA; Owner: REGENT BROADCASTING OF LANCASTER, INC.)
- WIOV-FM (105.1 FM; EPHRATA, PA; Owner: REGENT BROADCASTING OF LANCASTER, INC.)
- WYSP (94.1 FM; PHILADELPHIA, PA; Owner: INFINITY BROADCASTING OPERATIONS, INC.)
- WXPN (88.5 FM; PHILADELPHIA, PA; Owner: TRUSTEES OF THE UNIVERSITY OF PENNA.)
- WHYY-FM (90.9 FM; PHILADELPHIA, PA; Owner: WHYY, INC.)
- WXTU (92.5 FM; PHILADELPHIA, PA; Owner: WXTU LICENSE LIMITED PARTNERSHIP)
TV broadcast stations around Halfway House:
- KYW-TV (Channel 3; PHILADELPHIA, PA; Owner: CBS BROADCASTING INC.)
- WTVE (Channel 51; READING, PA; Owner: READING BROADCASTING, INC.)
- WPHL-TV (Channel 17; PHILADELPHIA, PA; Owner: TRIBUNE TELEVISION COMPANY)
- WPPX (Channel 61; WILMINGTON, DE; Owner: PAXSON PHILADELPHIA LICENSE, INC.)
- WPVI-TV (Channel 6; PHILADELPHIA, PA; Owner: ABC, INC.)
- WPSG (Channel 57; PHILADELPHIA, PA; Owner: VIACOM STATIONS GROUP OF PHILADELPHIA INC.)
- WCAU (Channel 10; PHILADELPHIA, PA; Owner: NBC SUBSIDIARY (WCAU-TV), L.P.)
- WGTW (Channel 48; BURLINGTON, NJ; Owner: BRUNSON COMMUNICATIONS, INC.)
- WYBE (Channel 35; PHILADELPHIA, PA; Owner: INDEPENDENCE PUBLIC MEDIA OF PHILADELPHIA, INC.)
- WHYY-TV (Channel 12; WILMINGTON, DE; Owner: WHYY, INC.)
- WTXF-TV (Channel 29; PHILADELPHIA, PA; Owner: FOX TV STATIONS OF PHILADELPHIA)
- WELL-LP (Channel 8; WILLOW GROVE, ETC., PA; Owner: WORD OF GOD FELLOWSHIP, INC.)
- WFMZ-TV (Channel 69; ALLENTOWN, PA; Owner: MARANATHA BROADCASTING COMPANY, INC.)
- WWJT-LP (Channel 7; PHILADELPHIA, PA; Owner: PHILADELPHIA TELEVISION NETWORK, INC)
- WLVT-TV (Channel 39; ALLENTOWN, PA; Owner: LEHIGH VALLEY PUBLIC TELECOMMUNICATIONS CORP.)
- W07DC (Channel 7; ALLENTOWN/BETHLEHEM, PA; Owner: NEW YORK TIMES MANAGEMENT SERVICES)
- WBPH-TV (Channel 60; BETHLEHEM, PA; Owner: SONSHINE FAMILY TELEVISION CORPORATION)
- WLYH-TV (Channel 15; LANCASTER, PA; Owner: TELEVISION STATION GROUP LICENSE SUBSIDIARY, LLC)
- WPHA-LP (Channel 63; PHILADELPHIA, PA; Owner: COMMERCIAL BROADCASTING CORP.)
- WFPA-CA (Channel 28; PHILADELPHIA, PA; Owner: WXTV LICENSE PARTNERSHIP, G.P.)
- Halfway House, Pennsylvania
- Fatal accident count9
- Vehicles involved in fatal accidents17
- Fatal accidents involving drunk persons:2
- Fatalities12
- Persons involved in fatal accidents29
- Pedestrians involved in fatal accidents0
- Pennsylvania average
- Fatal accident count10072
- Vehicles involved in fatal accidents15622
- Fatal accidents involving drunk persons3287
- Fatalities11050
- Persons involved in fatal accidents24313
- Pedestrians involved in fatal accidents1765
- National Bridge Inventory (NBI) Statistics
- 10Number of bridges
- 36ft / 11.4mTotal length
- $1,980,000Total costs
- 56,471Total average daily traffic
- 5,239Total average daily truck traffic


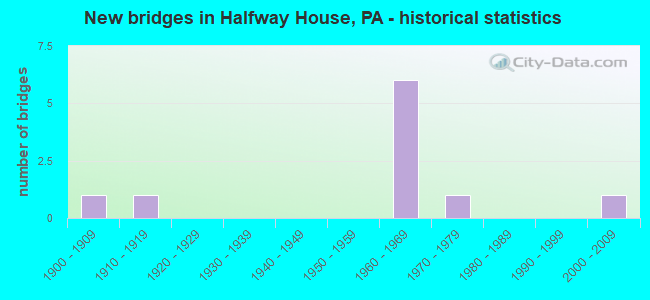
- New bridges - historical statistics
- 11900-1909
- 11910-1919
- 61960-1969
- 11970-1979
- 12000-2009
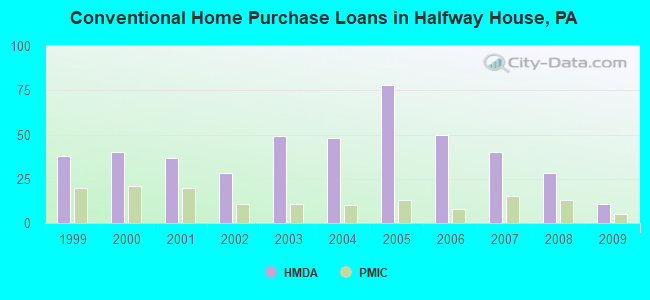
Home Mortgage Disclosure Act Aggregated Statistics For Year 2009
(Based on 1 partial tract)
|
| A) FHA, FSA/RHS & VA
Home Purchase Loans | B) Conventional
Home Purchase Loans | C) Refinancings
| D) Home Improvement Loans
| F) Non-occupant Loans on
< 5 Family Dwellings (A B C & D) |
|---|
| Number | Average Value | Number | Average Value | Number | Average Value | Number | Average Value | Number | Average Value |
|---|
| LOANS ORIGINATED | 19 | $222,971 | 11 | $186,333 | 66 | $169,917 | 5 | $55,720 | 2 | $159,115 |
| APPLICATIONS APPROVED, NOT ACCEPTED | 2 | $164,860 | 1 | $189,830 | 6 | $237,978 | 1 | $8,320 | 0 | $0 |
| APPLICATIONS DENIED | 4 | $230,250 | 2 | $234,810 | 27 | $210,435 | 2 | $54,095 | 1 | $285,340 |
| APPLICATIONS WITHDRAWN | 2 | $141,875 | 2 | $222,325 | 18 | $190,070 | 1 | $180,710 | 0 | $0 |
| FILES CLOSED FOR INCOMPLETENESS | 0 | $0 | 0 | $0 | 5 | $189,352 | 0 | $0 | 0 | $0 |
Aggregated Statistics For Year 2008
(Based on 1 partial tract)
|
| A) FHA, FSA/RHS & VA
Home Purchase Loans | B) Conventional
Home Purchase Loans | C) Refinancings
| D) Home Improvement Loans
| F) Non-occupant Loans on
< 5 Family Dwellings (A B C & D) |
|---|
| Number | Average Value | Number | Average Value | Number | Average Value | Number | Average Value | Number | Average Value |
|---|
| LOANS ORIGINATED | 12 | $239,035 | 28 | $205,439 | 38 | $169,272 | 4 | $38,440 | 1 | $53,500 |
| APPLICATIONS APPROVED, NOT ACCEPTED | 1 | $170,810 | 3 | $244,650 | 10 | $169,339 | 1 | $76,490 | 1 | $282,960 |
| APPLICATIONS DENIED | 4 | $204,292 | 3 | $181,110 | 27 | $195,376 | 8 | $50,231 | 1 | $197,750 |
| APPLICATIONS WITHDRAWN | 2 | $204,885 | 2 | $223,515 | 9 | $238,044 | 2 | $233,025 | 1 | $150,590 |
| FILES CLOSED FOR INCOMPLETENESS | 0 | $0 | 3 | $283,750 | 4 | $209,840 | 1 | $88,770 | 0 | $0 |
Aggregated Statistics For Year 2007
(Based on 1 partial tract)
|
| A) FHA, FSA/RHS & VA
Home Purchase Loans | B) Conventional
Home Purchase Loans | C) Refinancings
| D) Home Improvement Loans
| F) Non-occupant Loans on
< 5 Family Dwellings (A B C & D) |
|---|
| Number | Average Value | Number | Average Value | Number | Average Value | Number | Average Value | Number | Average Value |
|---|
| LOANS ORIGINATED | 3 | $212,947 | 40 | $202,490 | 55 | $150,630 | 14 | $33,657 | 2 | $117,105 |
| APPLICATIONS APPROVED, NOT ACCEPTED | 0 | $0 | 4 | $174,175 | 6 | $156,935 | 2 | $95,905 | 0 | $0 |
| APPLICATIONS DENIED | 1 | $178,340 | 5 | $169,616 | 34 | $176,936 | 8 | $83,966 | 1 | $287,710 |
| APPLICATIONS WITHDRAWN | 0 | $0 | 5 | $115,562 | 15 | $201,928 | 2 | $158,520 | 0 | $0 |
| FILES CLOSED FOR INCOMPLETENESS | 0 | $0 | 4 | $256,505 | 4 | $231,538 | 1 | $286,520 | 0 | $0 |
Aggregated Statistics For Year 2006
(Based on 1 partial tract)
|
| A) FHA, FSA/RHS & VA
Home Purchase Loans | B) Conventional
Home Purchase Loans | C) Refinancings
| D) Home Improvement Loans
| F) Non-occupant Loans on
< 5 Family Dwellings (A B C & D) | G) Loans On Manufactured
Home Dwelling (A B C & D) |
|---|
| Number | Average Value | Number | Average Value | Number | Average Value | Number | Average Value | Number | Average Value | Number | Average Value |
|---|
| LOANS ORIGINATED | 3 | $203,830 | 50 | $170,877 | 65 | $147,765 | 23 | $46,591 | 4 | $155,745 | 0 | $0 |
| APPLICATIONS APPROVED, NOT ACCEPTED | 0 | $0 | 6 | $164,597 | 11 | $159,313 | 3 | $50,990 | 0 | $0 | 0 | $0 |
| APPLICATIONS DENIED | 0 | $0 | 5 | $167,714 | 43 | $181,533 | 13 | $67,828 | 0 | $0 | 2 | $35,270 |
| APPLICATIONS WITHDRAWN | 0 | $0 | 3 | $155,483 | 28 | $166,984 | 1 | $99,080 | 0 | $0 | 0 | $0 |
| FILES CLOSED FOR INCOMPLETENESS | 0 | $0 | 2 | $292,670 | 3 | $150,990 | 0 | $0 | 0 | $0 | 0 | $0 |
Aggregated Statistics For Year 2005
(Based on 1 partial tract)
|
| A) FHA, FSA/RHS & VA
Home Purchase Loans | B) Conventional
Home Purchase Loans | C) Refinancings
| D) Home Improvement Loans
| F) Non-occupant Loans on
< 5 Family Dwellings (A B C & D) |
|---|
| Number | Average Value | Number | Average Value | Number | Average Value | Number | Average Value | Number | Average Value |
|---|
| LOANS ORIGINATED | 2 | $124,835 | 78 | $174,809 | 78 | $152,499 | 21 | $44,046 | 4 | $158,818 |
| APPLICATIONS APPROVED, NOT ACCEPTED | 0 | $0 | 11 | $179,415 | 11 | $138,489 | 2 | $42,205 | 0 | $0 |
| APPLICATIONS DENIED | 0 | $0 | 9 | $147,952 | 44 | $164,852 | 10 | $69,709 | 1 | $26,550 |
| APPLICATIONS WITHDRAWN | 0 | $0 | 11 | $164,861 | 35 | $187,891 | 8 | $136,328 | 2 | $205,480 |
| FILES CLOSED FOR INCOMPLETENESS | 0 | $0 | 3 | $172,390 | 8 | $195,079 | 2 | $27,740 | 0 | $0 |
Aggregated Statistics For Year 2004
(Based on 1 partial tract)
|
| A) FHA, FSA/RHS & VA
Home Purchase Loans | B) Conventional
Home Purchase Loans | C) Refinancings
| D) Home Improvement Loans
| F) Non-occupant Loans on
< 5 Family Dwellings (A B C & D) |
|---|
| Number | Average Value | Number | Average Value | Number | Average Value | Number | Average Value | Number | Average Value |
|---|
| LOANS ORIGINATED | 1 | $189,830 | 48 | $174,215 | 74 | $141,720 | 14 | $49,311 | 2 | $106,605 |
| APPLICATIONS APPROVED, NOT ACCEPTED | 0 | $0 | 4 | $172,588 | 14 | $126,589 | 2 | $84,410 | 0 | $0 |
| APPLICATIONS DENIED | 0 | $0 | 4 | $117,998 | 33 | $168,752 | 8 | $47,259 | 0 | $0 |
| APPLICATIONS WITHDRAWN | 0 | $0 | 3 | $139,893 | 40 | $168,774 | 4 | $90,060 | 0 | $0 |
| FILES CLOSED FOR INCOMPLETENESS | 0 | $0 | 2 | $296,430 | 5 | $189,114 | 0 | $0 | 0 | $0 |
Aggregated Statistics For Year 2003
(Based on 1 partial tract)
|
| A) FHA, FSA/RHS & VA
Home Purchase Loans | B) Conventional
Home Purchase Loans | C) Refinancings
| D) Home Improvement Loans
| F) Non-occupant Loans on
< 5 Family Dwellings (A B C & D) |
|---|
| Number | Average Value | Number | Average Value | Number | Average Value | Number | Average Value | Number | Average Value |
|---|
| LOANS ORIGINATED | 3 | $188,110 | 49 | $179,079 | 147 | $129,870 | 25 | $44,703 | 2 | $92,930 |
| APPLICATIONS APPROVED, NOT ACCEPTED | 0 | $0 | 1 | $152,970 | 21 | $112,474 | 4 | $36,262 | 1 | $49,540 |
| APPLICATIONS DENIED | 1 | $80,050 | 5 | $111,282 | 36 | $142,062 | 4 | $38,938 | 0 | $0 |
| APPLICATIONS WITHDRAWN | 0 | $0 | 3 | $237,517 | 25 | $151,799 | 1 | $94,320 | 1 | $107,400 |
| FILES CLOSED FOR INCOMPLETENESS | 0 | $0 | 1 | $251,250 | 7 | $148,953 | 0 | $0 | 0 | $0 |
Aggregated Statistics For Year 2002
(Based on 1 partial tract)
|
| A) FHA, FSA/RHS & VA
Home Purchase Loans | B) Conventional
Home Purchase Loans | C) Refinancings
| D) Home Improvement Loans
| F) Non-occupant Loans on
< 5 Family Dwellings (A B C & D) |
|---|
| Number | Average Value | Number | Average Value | Number | Average Value | Number | Average Value | Number | Average Value |
|---|
| LOANS ORIGINATED | 5 | $135,296 | 28 | $141,847 | 92 | $119,588 | 15 | $27,318 | 1 | $78,070 |
| APPLICATIONS APPROVED, NOT ACCEPTED | 0 | $0 | 2 | $109,380 | 17 | $121,734 | 3 | $26,023 | 0 | $0 |
| APPLICATIONS DENIED | 0 | $0 | 3 | $141,480 | 35 | $127,020 | 4 | $13,178 | 0 | $0 |
| APPLICATIONS WITHDRAWN | 0 | $0 | 2 | $143,460 | 32 | $320,495 | 2 | $126,220 | 0 | $0 |
| FILES CLOSED FOR INCOMPLETENESS | 0 | $0 | 0 | $0 | 5 | $124,756 | 1 | $30,910 | 0 | $0 |
Aggregated Statistics For Year 2001
(Based on 1 partial tract)
|
| A) FHA, FSA/RHS & VA
Home Purchase Loans | B) Conventional
Home Purchase Loans | C) Refinancings
| D) Home Improvement Loans
| F) Non-occupant Loans on
< 5 Family Dwellings (A B C & D) |
|---|
| Number | Average Value | Number | Average Value | Number | Average Value | Number | Average Value | Number | Average Value |
|---|
| LOANS ORIGINATED | 9 | $153,720 | 37 | $135,909 | 61 | $120,222 | 10 | $24,293 | 1 | $88,770 |
| APPLICATIONS APPROVED, NOT ACCEPTED | 0 | $0 | 3 | $99,867 | 15 | $97,754 | 2 | $29,525 | 0 | $0 |
| APPLICATIONS DENIED | 0 | $0 | 3 | $97,093 | 22 | $99,399 | 4 | $31,605 | 0 | $0 |
| APPLICATIONS WITHDRAWN | 1 | $185,470 | 6 | $110,963 | 15 | $110,357 | 2 | $21,005 | 0 | $0 |
| FILES CLOSED FOR INCOMPLETENESS | 0 | $0 | 0 | $0 | 3 | $112,813 | 1 | $15,060 | 0 | $0 |
Aggregated Statistics For Year 2000
(Based on 1 partial tract)
|
| A) FHA, FSA/RHS & VA
Home Purchase Loans | B) Conventional
Home Purchase Loans | C) Refinancings
| D) Home Improvement Loans
| F) Non-occupant Loans on
< 5 Family Dwellings (A B C & D) |
|---|
| Number | Average Value | Number | Average Value | Number | Average Value | Number | Average Value | Number | Average Value |
|---|
| LOANS ORIGINATED | 7 | $152,631 | 40 | $133,246 | 17 | $75,437 | 12 | $20,409 | 1 | $71,730 |
| APPLICATIONS APPROVED, NOT ACCEPTED | 0 | $0 | 4 | $91,150 | 4 | $107,398 | 2 | $11,295 | 0 | $0 |
| APPLICATIONS DENIED | 0 | $0 | 4 | $113,738 | 13 | $77,614 | 4 | $61,130 | 0 | $0 |
| APPLICATIONS WITHDRAWN | 1 | $207,660 | 5 | $116,830 | 8 | $94,964 | 2 | $8,320 | 1 | $70,540 |
| FILES CLOSED FOR INCOMPLETENESS | 0 | $0 | 0 | $0 | 1 | $104,620 | 0 | $0 | 0 | $0 |
Aggregated Statistics For Year 1999
(Based on 1 partial tract)
|
| A) FHA, FSA/RHS & VA
Home Purchase Loans | B) Conventional
Home Purchase Loans | C) Refinancings
| D) Home Improvement Loans
| F) Non-occupant Loans on
< 5 Family Dwellings (A B C & D) |
|---|
| Number | Average Value | Number | Average Value | Number | Average Value | Number | Average Value | Number | Average Value |
|---|
| LOANS ORIGINATED | 7 | $129,079 | 38 | $127,740 | 28 | $103,547 | 7 | $27,869 | 0 | $0 |
| APPLICATIONS APPROVED, NOT ACCEPTED | 0 | $0 | 2 | $154,140 | 10 | $107,455 | 0 | $0 | 0 | $0 |
| APPLICATIONS DENIED | 0 | $0 | 4 | $123,330 | 19 | $100,223 | 4 | $22,880 | 1 | $89,910 |
| APPLICATIONS WITHDRAWN | 1 | $127,650 | 5 | $132,140 | 9 | $92,768 | 1 | $152,130 | 0 | $0 |
| FILES CLOSED FOR INCOMPLETENESS | 0 | $0 | 1 | $170,190 | 2 | $161,765 | 0 | $0 | 0 | $0 |
Detailed HMDA statistics for the following Tracts:
2091.00
Private Mortgage Insurance Companies Aggregated Statistics For Year 2009
(Based on 1 partial tract)
|
| A) Conventional
Home Purchase Loans | B) Refinancings
|
|---|
| Number | Average Value | Number | Average Value |
|---|
| LOANS ORIGINATED | 5 | $205,442 | 3 | $271,863 |
| APPLICATIONS APPROVED, NOT ACCEPTED | 1 | $356,270 | 1 | $207,660 |
| APPLICATIONS DENIED | 0 | $0 | 1 | $241,740 |
| APPLICATIONS WITHDRAWN | 0 | $0 | 1 | $206,080 |
| FILES CLOSED FOR INCOMPLETENESS | 0 | $0 | 0 | $0 |
Aggregated Statistics For Year 2008
(Based on 1 partial tract)
|
| A) Conventional
Home Purchase Loans | B) Refinancings
|
|---|
| Number | Average Value | Number | Average Value |
|---|
| LOANS ORIGINATED | 13 | $237,719 | 4 | $271,762 |
| APPLICATIONS APPROVED, NOT ACCEPTED | 7 | $281,883 | 2 | $224,505 |
| APPLICATIONS DENIED | 1 | $203,700 | 1 | $274,240 |
| APPLICATIONS WITHDRAWN | 1 | $140,690 | 0 | $0 |
| FILES CLOSED FOR INCOMPLETENESS | 0 | $0 | 0 | $0 |
Aggregated Statistics For Year 2007
(Based on 1 partial tract)
|
| A) Conventional
Home Purchase Loans | B) Refinancings
|
|---|
| Number | Average Value | Number | Average Value |
|---|
| LOANS ORIGINATED | 15 | $238,784 | 7 | $243,669 |
| APPLICATIONS APPROVED, NOT ACCEPTED | 6 | $261,095 | 2 | $221,335 |
| APPLICATIONS DENIED | 0 | $0 | 0 | $0 |
| APPLICATIONS WITHDRAWN | 2 | $316,645 | 0 | $0 |
| FILES CLOSED FOR INCOMPLETENESS | 0 | $0 | 0 | $0 |
Aggregated Statistics For Year 2006
(Based on 1 partial tract)
|
| A) Conventional
Home Purchase Loans | B) Refinancings
|
|---|
| Number | Average Value | Number | Average Value |
|---|
| LOANS ORIGINATED | 8 | $220,045 | 3 | $191,677 |
| APPLICATIONS APPROVED, NOT ACCEPTED | 2 | $219,750 | 2 | $191,610 |
| APPLICATIONS DENIED | 0 | $0 | 0 | $0 |
| APPLICATIONS WITHDRAWN | 0 | $0 | 0 | $0 |
| FILES CLOSED FOR INCOMPLETENESS | 0 | $0 | 0 | $0 |
Aggregated Statistics For Year 2005
(Based on 1 partial tract)
|
| A) Conventional
Home Purchase Loans | B) Refinancings
|
|---|
| Number | Average Value | Number | Average Value |
|---|
| LOANS ORIGINATED | 13 | $192,480 | 4 | $229,260 |
| APPLICATIONS APPROVED, NOT ACCEPTED | 2 | $305,945 | 2 | $247,885 |
| APPLICATIONS DENIED | 0 | $0 | 0 | $0 |
| APPLICATIONS WITHDRAWN | 1 | $221,930 | 0 | $0 |
| FILES CLOSED FOR INCOMPLETENESS | 0 | $0 | 0 | $0 |
Aggregated Statistics For Year 2004
(Based on 1 partial tract)
|
| A) Conventional
Home Purchase Loans | B) Refinancings
|
|---|
| Number | Average Value | Number | Average Value |
|---|
| LOANS ORIGINATED | 10 | $221,690 | 6 | $199,207 |
| APPLICATIONS APPROVED, NOT ACCEPTED | 2 | $172,390 | 1 | $107,000 |
| APPLICATIONS DENIED | 0 | $0 | 0 | $0 |
| APPLICATIONS WITHDRAWN | 0 | $0 | 0 | $0 |
| FILES CLOSED FOR INCOMPLETENESS | 0 | $0 | 0 | $0 |
Aggregated Statistics For Year 2003
(Based on 1 partial tract)
|
| A) Conventional
Home Purchase Loans | B) Refinancings
|
|---|
| Number | Average Value | Number | Average Value |
|---|
| LOANS ORIGINATED | 11 | $177,470 | 11 | $171,598 |
| APPLICATIONS APPROVED, NOT ACCEPTED | 1 | $229,850 | 4 | $150,595 |
| APPLICATIONS DENIED | 0 | $0 | 0 | $0 |
| APPLICATIONS WITHDRAWN | 0 | $0 | 1 | $155,750 |
| FILES CLOSED FOR INCOMPLETENESS | 0 | $0 | 0 | $0 |
Aggregated Statistics For Year 2002
(Based on 1 partial tract)
|
| A) Conventional
Home Purchase Loans | B) Refinancings
|
|---|
| Number | Average Value | Number | Average Value |
|---|
| LOANS ORIGINATED | 11 | $159,601 | 11 | $163,816 |
| APPLICATIONS APPROVED, NOT ACCEPTED | 2 | $124,240 | 4 | $150,595 |
| APPLICATIONS DENIED | 0 | $0 | 0 | $0 |
| APPLICATIONS WITHDRAWN | 0 | $0 | 1 | $208,060 |
| FILES CLOSED FOR INCOMPLETENESS | 0 | $0 | 0 | $0 |
Aggregated Statistics For Year 2001
(Based on 1 partial tract)
|
| A) Conventional
Home Purchase Loans | B) Refinancings
|
|---|
| Number | Average Value | Number | Average Value |
|---|
| LOANS ORIGINATED | 20 | $163,632 | 9 | $149,229 |
| APPLICATIONS APPROVED, NOT ACCEPTED | 3 | $144,120 | 2 | $161,890 |
| APPLICATIONS DENIED | 0 | $0 | 0 | $0 |
| APPLICATIONS WITHDRAWN | 0 | $0 | 0 | $0 |
| FILES CLOSED FOR INCOMPLETENESS | 0 | $0 | 1 | $149,410 |
Aggregated Statistics For Year 2000
(Based on 1 partial tract)
|
| A) Conventional
Home Purchase Loans | B) Refinancings
|
|---|
| Number | Average Value | Number | Average Value |
|---|
| LOANS ORIGINATED | 21 | $161,200 | 1 | $66,180 |
| APPLICATIONS APPROVED, NOT ACCEPTED | 3 | $156,933 | 0 | $0 |
| APPLICATIONS DENIED | 1 | $194,980 | 0 | $0 |
| APPLICATIONS WITHDRAWN | 0 | $0 | 0 | $0 |
| FILES CLOSED FOR INCOMPLETENESS | 0 | $0 | 0 | $0 |
Aggregated Statistics For Year 1999
(Based on 1 partial tract)
|
| A) Conventional
Home Purchase Loans | B) Refinancings
|
|---|
| Number | Average Value | Number | Average Value |
|---|
| LOANS ORIGINATED | 20 | $148,819 | 5 | $131,498 |
| APPLICATIONS APPROVED, NOT ACCEPTED | 2 | $142,495 | 1 | $134,470 |
| APPLICATIONS DENIED | 0 | $0 | 0 | $0 |
| APPLICATIONS WITHDRAWN | 0 | $0 | 0 | $0 |
| FILES CLOSED FOR INCOMPLETENESS | 0 | $0 | 0 | $0 |
Detailed PMIC statistics for the following Tracts:
2091.00
Halfway House compared to Pennsylvania state average:
- Median household income above state average.
- Unemployed percentage significantly below state average.
- Median age below state average.
- Foreign-born population percentage significantly above state average.
- Renting percentage significantly below state average.
- Length of stay since moving in significantly above state average.
- House age significantly below state average.
- Number of college students above state average.
- Percentage of population with a bachelor's degree or higher above state average.