Estimated zip code population in 2022: 28,515
Zip code population in 2010: 23,768
Zip code population in 2000: 20,689
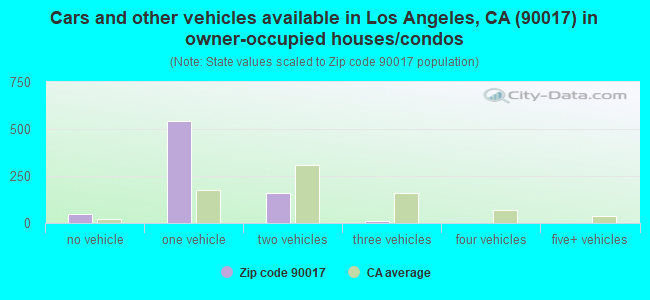
Houses and condos: 15,556
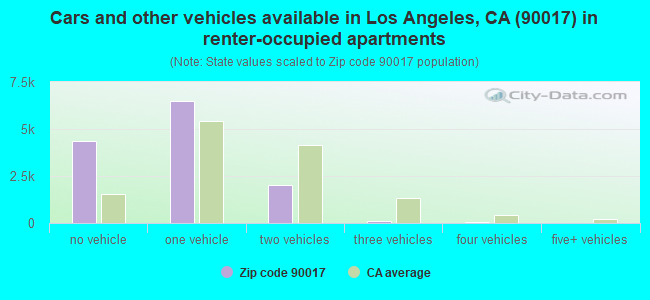
Renter-occupied apartments: 12,996
| % of renters here: | 95% |
| State: | 44% |
146.1
(very high, U.S. average is 100)
Land area: 0.7
sq. mi.
Water area: 0.0
sq. mi.
| Population density: 39,261 people per square mile | | (very high). |
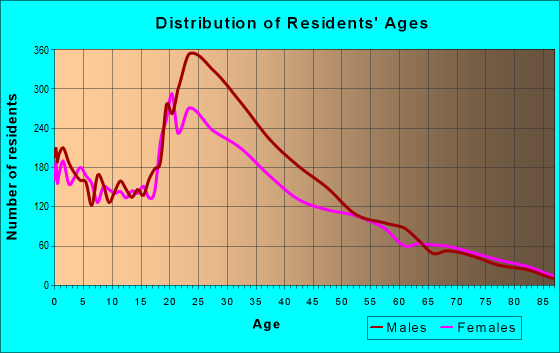
![Age and Sex of Residents in zip code 90017]()
- OSM Map
- General Map
- Google Map
- MSN Map
- OSM Map
- General Map
- Google Map
- MSN Map
- OSM Map
- General Map
- Google Map
- MSN Map
- OSM Map
- General Map
- Google Map
- MSN Map
Please wait while loading the map...
Real estate property taxes paid for housing units in 2022:
| This zip code: | 0.9% ($7,084) |
| California: | 0.7% ($4,831) |
$6,982 (1.0%)

Profiles of local businesses
Business Search - 14 Million verified businesses
| Males: 15,274 |  (53.6%) (53.6%) |
| Females: 13,240 |  (46.4%) (46.4%) |
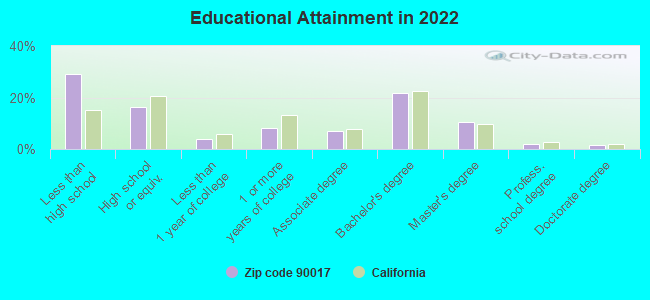
For population 25 years and over in 90017:
- High school or higher: 70.5%
- Bachelor's degree or higher: 35.8%
- Graduate or professional degree: 14.2%
- Unemployed: 5.1%
- Mean travel time to work (commute): 30.3 minutes
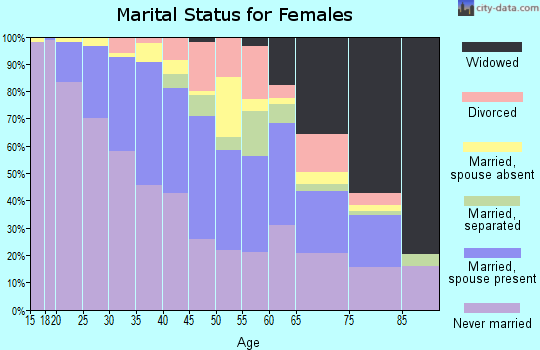
For population 15 years and over in 90017:
- Never married: 59.1%
- Now married: 26.6%
- Separated: 2.6%
- Widowed: 3.7%
- Divorced: 8.0%
Zip code 90017 compared to state average:
- Median household income below state average.
- Black race population percentage above state average.
- Median age below state average.
- Foreign-born population percentage above state average.
- Renting percentage above state average.
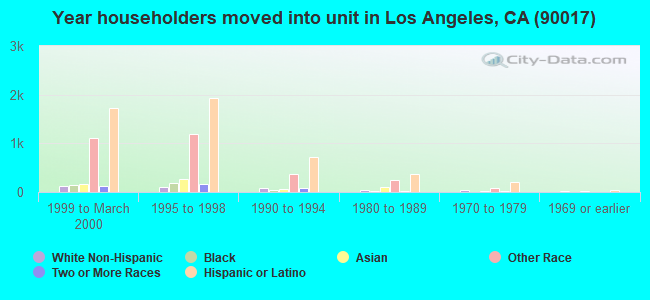
- Length of stay since moving in significantly below state average.
- Number of rooms per house significantly below state average.


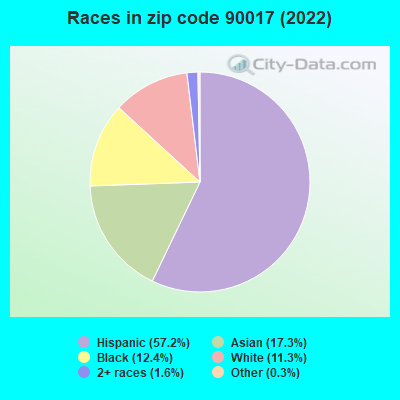
- 16,30757.2%Hispanic or Latino
- 4,92717.3%Asian
- 3,54112.4%Black
- 3,21911.3%White
- 4471.6%Two or more races
- 720.3%Some other race
Data:
100%
urban population.
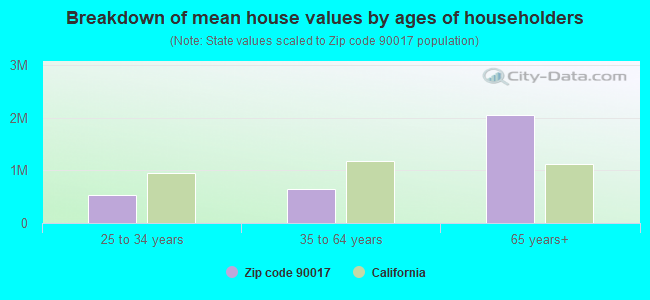
Estimated median house/condo value in 2022: $769,758
| 90017: | $769,758 |
| California: | $715,900 |
Median resident age:| This zip code: | 33.2 years |
| California median age: | 37.9 years |
Average household size:| This zip code: | 2.0 people |
| California: | 2.8 people |
Averages for the 2020 tax year for zip code 90017, filed in 2021:
Average Adjusted Gross Income (AGI) in 2020: $65,437 (Individual Income Tax Returns)
| Here: | $65,437 |
| State: | $95,910 |
Salary/wage: $53,363 (reported on 81.0% of returns)
| Here: | $53,363 |
| State: | $77,331 |
(% of AGI for various income ranges: 1303.7% for AGIs below $25k, 4351.1% for AGIs $25k-50k, 8113.5% for AGIs $50k-75k, 11523.3% for AGIs $75k-100k, 22077.0% for AGIs $100k-200k, 94835.8% for AGIs over 200k)
Taxable interest for individuals: $4,938 (reported on 15.3% of returns)
| This zip code: | $4,938 |
| California: | $2,294 |
(% of AGI for various income ranges: 6.6% for AGIs below $25k, 9.0% for AGIs $25k-50k, 28.7% for AGIs $50k-75k, 65.4% for AGIs $75k-100k, 96.4% for AGIs $100k-200k, 5895.8% for AGIs over 200k)
Ordinary dividends: $6,129 (reported on 11.8% of returns)
(% of AGI for various income ranges: 5.7% for AGIs below $25k, 14.5% for AGIs $25k-50k, 31.0% for AGIs $50k-75k, 55.8% for AGIs $75k-100k, 113.6% for AGIs $100k-200k, 5438.3% for AGIs over 200k)
Net capital gain/loss in AGI: +$37,589 (reported on 14.0% of returns)
| Here: | +$37,589 |
| State: | +$49,306 |
(% of AGI for various income ranges: 3.0% for AGIs below $25k, 31.1% for AGIs $25k-50k, 65.6% for AGIs $50k-75k, 165.8% for AGIs $75k-100k, 469.3% for AGIs $100k-200k, 45560.0% for AGIs over 200k)
Profit/loss from business: +$12,824 (reported on 25.4% of returns)
| Here: | +$12,824 |
| State: | +$15,671 |
(% of AGI for various income ranges: 348.9% for AGIs below $25k, 207.9% for AGIs $25k-50k, 284.8% for AGIs $50k-75k, 294.6% for AGIs $75k-100k, 757.3% for AGIs $100k-200k, 12531.7% for AGIs over 200k)
Taxable individual retirement arrangement distribution: $24,580 (reported on 1.3% of returns)
| 90017: | $24,580 |
| California: | $23,505 |
(% of AGI for various income ranges: 5.7% for AGIs below $25k, 15.4% for AGIs $25k-50k, 42.0% for AGIs $50k-75k, 165.0% for AGIs $100k-200k, 1605.8% for AGIs over 200k)
Self-employed (Keogh) retirement plans: $46,771 (reported on 0.6% of returns)
| 90017: | $46,771 |
| California: | $30,163 |
(% of AGI for various income ranges: 51.2% for AGIs $50k-75k, 2361.7% for AGIs over 200k)
Total itemized deductions: $54,603 (reported on 5.7% of returns)
| Here: | $54,603 |
| State: | $39,517 |
(% of AGI for various income ranges: 21.4% for AGIs below $25k, 80.8% for AGIs $25k-50k, 176.0% for AGIs $50k-75k, 295.2% for AGIs $75k-100k, 951.1% for AGIs $100k-200k, 20357.5% for AGIs over 200k)
Charity contributions: $20,522 (reported on 4.3% of returns)
| Here: | $20,522 |
| State: | $12,598 |
(% of AGI for various income ranges: 15.2% for AGIs $25k-50k, 30.1% for AGIs $50k-75k, 69.6% for AGIs $75k-100k, 242.9% for AGIs $100k-200k, 6487.5% for AGIs over 200k)
Taxes paid: $8,392 (reported on 5.7% of returns)
(% of AGI for various income ranges: 4.9% for AGIs below $25k, 16.6% for AGIs $25k-50k, 50.9% for AGIs $50k-75k, 94.6% for AGIs $75k-100k, 343.8% for AGIs $100k-200k, 1730.8% for AGIs over 200k)
Earned income credit: $1,863 (reported on 17.6% of returns)
(% of AGI for various income ranges: 92.8% for AGIs below $25k, 58.8% for AGIs $25k-50k)
Percentage of individuals using paid preparers for their 2020 taxes: 90.0%
(% for various income ranges: 86.1% for AGIs below $25k, 91.4% for AGIs $25k-50k, 93.8% for AGIs $50k-75k, 94.4% for AGIs $75k-100k, 94.3% for AGIs $100k-200k, 91.7% for AGIs over 200k)
Averages for the 2012 tax year for zip code 90017, filed in 2013:
Average Adjusted Gross Income (AGI) in 2012: $60,150 (Individual Income Tax Returns)
| Here: | $60,150 |
| State: | $72,726 |
Salary/wage: $40,634 (reported on 84.5% of returns)
| Here: | $40,634 |
| State: | $59,079 |
(% of AGI for various income ranges: 81.0% for AGIs below $25k, 92.0% for AGIs $25k-50k, 92.3% for AGIs $50k-75k, 90.3% for AGIs $75k-100k, 84.0% for AGIs $100k-200k, 24.4% for AGIs over 200k)
Taxable interest for individuals: $4,286 (reported on 15.4% of returns)
| This zip code: | $4,286 |
| California: | $2,146 |
(% of AGI for various income ranges: 0.2% for AGIs below $25k, 0.2% for AGIs $25k-50k, 0.4% for AGIs $50k-75k, 0.3% for AGIs $75k-100k, 1.4% for AGIs $100k-200k, 1.7% for AGIs over 200k)
Ordinary dividends: $12,651 (reported on 7.4% of returns)
(% of AGI for various income ranges: 0.2% for AGIs below $25k, 0.3% for AGIs $25k-50k, 0.4% for AGIs $50k-75k, 0.4% for AGIs $75k-100k, 0.9% for AGIs $100k-200k, 2.8% for AGIs over 200k)
Net capital gain/loss in AGI: +$57,880 (reported on 7.2% of returns)
| Here: | +$57,880 |
| State: | +$30,460 |
(% of AGI for various income ranges: 0.1% for AGIs $25k-50k, 0.9% for AGIs $50k-75k, 1.9% for AGIs $100k-200k, 13.8% for AGIs over 200k)
Profit/loss from business: +$11,887 (reported on 22.2% of returns)
| Here: | +$11,887 |
| State: | +$17,064 |
(% of AGI for various income ranges: 16.8% for AGIs below $25k, 3.5% for AGIs $25k-50k, 3.3% for AGIs $50k-75k, 3.2% for AGIs $75k-100k, 3.8% for AGIs $100k-200k, 1.9% for AGIs over 200k)
Taxable individual retirement arrangement distribution: $31,854 (reported on 1.6% of returns)
| 90017: | $31,854 |
| California: | $19,557 |
(% of AGI for various income ranges: 0.4% for AGIs below $25k, 1.0% for AGIs $50k-75k, 1.2% for AGIs $100k-200k, 1.2% for AGIs over 200k)
Self-employment retirement plans: $47,140 (reported on 0.6% of returns)
| 90017: | $47,140 |
| California: | $24,530 |
Total itemized deductions: $39,389 (16% of AGI, reported on 16.2% of returns)
| Here: | $39,389 |
| State: | $34,004 |
| Here: | 16.0% of AGI |
| State: | 22.7% of AGI |
(% of AGI for various income ranges: 1.8% for AGIs below $25k, 4.9% for AGIs $25k-50k, 8.4% for AGIs $50k-75k, 14.5% for AGIs $75k-100k, 16.0% for AGIs $100k-200k, 12.9% for AGIs over 200k)
Charity contributions: $8,569 (reported on 12.0% of returns)
(% of AGI for various income ranges: 0.5% for AGIs $25k-50k, 0.7% for AGIs $50k-75k, 1.5% for AGIs $75k-100k, 1.4% for AGIs $100k-200k, 2.7% for AGIs over 200k)
Taxes paid: $20,829 (reported on 16.1% of returns)
| 90017: | $20,829 |
| State: | $14,448 |
(% of AGI for various income ranges: 0.3% for AGIs below $25k, 1.0% for AGIs $25k-50k, 2.5% for AGIs $50k-75k, 5.7% for AGIs $75k-100k, 7.5% for AGIs $100k-200k, 8.1% for AGIs over 200k)
Earned income credit: $2,369 (reported on 25.9% of returns)
(% of AGI for various income ranges: 7.1% for AGIs below $25k, 1.2% for AGIs $25k-50k)
Percentage of individuals using paid preparers for their 2012 taxes: 70.9%
(% for various income ranges: 73.7% for AGIs below $25k, 71.2% for AGIs $25k-50k, 58.2% for AGIs $50k-75k, 56.8% for AGIs $75k-100k, 64.4% for AGIs $100k-200k, 84.6% for AGIs over 200k)
Averages for the 2004 tax year for zip code 90017, filed in 2005:
Average Adjusted Gross Income (AGI) in 2004: $46,972 (Individual Income Tax Returns)
| Here: | $46,972 |
| State: | $58,600 |
Salary/wage: $30,659 (reported on 83.6% of returns)
| Here: | $30,659 |
| State: | $49,455 |
(% of AGI for various income ranges: 89.4% for AGIs $10k-25k, 92.4% for AGIs $25k-50k, 87.9% for AGIs $50k-75k, 82.3% for AGIs $75k-100k, 30.2% for AGIs over 100k)
Taxable interest for individuals: $5,251 (reported on 18.8% of returns)
| This zip code: | $5,251 |
| California: | $2,365 |
(% of AGI for various income ranges: 0.4% for AGIs $10k-25k, 0.8% for AGIs $25k-50k, 0.7% for AGIs $50k-75k, 1.1% for AGIs $75k-100k, 2.8% for AGIs over 100k)
Taxable dividends: $11,964 (reported on 7.3% of returns)
(% of AGI for various income ranges: 0.3% for AGIs $10k-25k, 0.6% for AGIs $25k-50k, 1.5% for AGIs $50k-75k, 1.4% for AGIs $75k-100k, 2.4% for AGIs over 100k)
Net capital gain/loss: +$58,286 (reported on 7.5% of returns)
| Here: | +$58,286 |
| State: | +$23,418 |
(% of AGI for various income ranges: -0.1% for AGIs $10k-25k, 0.2% for AGIs $25k-50k, 1.8% for AGIs $50k-75k, 3.2% for AGIs $75k-100k, 14.0% for AGIs over 100k)
Profit/loss from business: +$18,526 (reported on 18.8% of returns)
| Here: | +$18,526 |
| State: | +$16,826 |
(% of AGI for various income ranges: 8.5% for AGIs $10k-25k, 3.9% for AGIs $25k-50k, 3.2% for AGIs $50k-75k, 3.8% for AGIs $75k-100k, 7.0% for AGIs over 100k)
IRA payment deduction: $2,757 (reported on 0.7% of returns)
| 90017: | $2,757 |
| California: | $3,192 |
Self-employed pension: $32,761 (reported on 0.9% of returns)
| Here: | $32,761 |
| California: | $17,688 |
Total itemized deductions: $51,588 (21% of AGI, reported on 13.8% of returns)
| Here: | $51,588 |
| State: | $28,113 |
| Here: | 21.1% of AGI |
| State: | 25.3% of AGI |
(% of AGI for various income ranges: 2.7% for AGIs $10k-25k, 8.3% for AGIs $25k-50k, 14.7% for AGIs $50k-75k, 17.3% for AGIs $75k-100k, 18.7% for AGIs over 100k)
Charity contributions deductions: $8,053 (4% of AGI, reported on 10.4% of returns)
| Here: | 3.7% of AGI |
| State: | 3.3% of AGI |
(% of AGI for various income ranges: 0.2% for AGIs $10k-25k, 1.0% for AGIs $25k-50k, 1.4% for AGIs $50k-75k, 1.9% for AGIs $75k-100k, 2.3% for AGIs over 100k)
Total tax: $14,030 (reported on 56.4% of returns)
| 90017: | $14,030 |
| State: | $10,761 |
(% of AGI for various income ranges: 3.2% for AGIs $10k-25k, 5.9% for AGIs $25k-50k, 11.3% for AGIs $50k-75k, 14.7% for AGIs $75k-100k, 22.1% for AGIs over 100k)
Earned income credit: $2,019 (reported on 35.5% of returns)
Percentage of individuals using paid preparers for their 2004 taxes: 78.4%
(% for various income ranges: 75.3% for AGIs below $10k, 82.7% for AGIs $10k-25k, 73.0% for AGIs $25k-50k, 69.0% for AGIs $50k-75k, 77.8% for AGIs $75k-100k, 85.4% for AGIs over 100k)
Estimated median household income in 2022: | This zip code: | $46,446 |
| California: | $91,551 |
![Los Angeles, CA (90017) map]() Nearest zip codes: 90071
Nearest zip codes: 90071,
90015,
90079,
90057,
90014,
90013.
Los Angeles Zip Code Map
Percentage of family households:| This zip code: | 31.7% |
| California: | 46.8% |
Percentage of households with unmarried partners:| This zip code: | 6.8% |
| California: | 48.1% |
Likely homosexual households (counted as self-reported same-sex unmarried-partner households)
- Lesbian couples: 0.0% of all households
- Gay men: 0.4% of all households
Household received Food Stamps/SNAP in the past 12 months: 3,581
Household did not receive Food Stamps/SNAP in the past 12 months: 10,609
Women who had a birth in the past 12 months: 387 (127 now married, 263 unmarried)
Women who did not have a birth in the past 12 months: 7,882 (2,168 now married, 5,753 unmarried)
Housing units in zip code 90017 with a mortgage: 516
Median monthly owner costs for units with a mortgage: $3,713
Median monthly owner costs for units without a mortgage: $1,556
Residents with income below the poverty level in 2022:
| This zip code: | 36.0% |
| Whole state: | 12.2% |
| This zip code: | 17.0% |
| Whole state: | 6.2% |
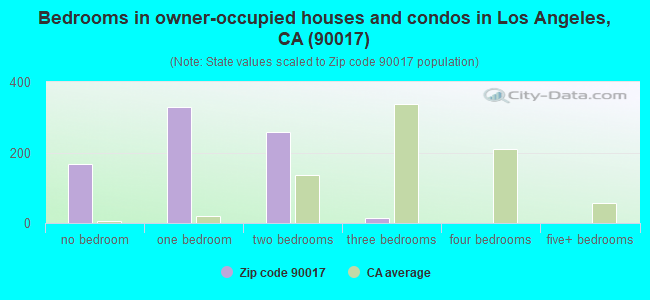
Median number of rooms in houses and condos:
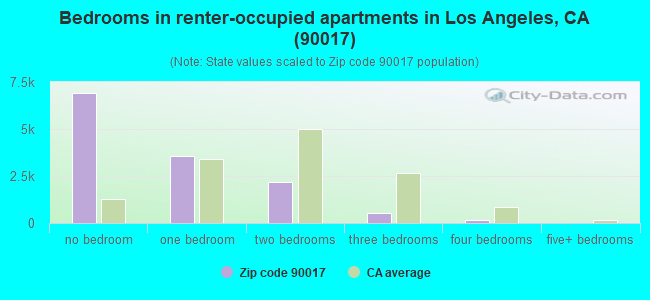
Median number of rooms in apartments:


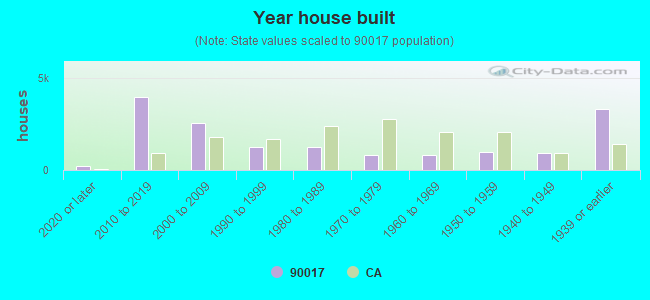
- Year house built (houses)
- 2302020 or later
- 3,9712010 to 2019
- 2,5592000 to 2009
- 1,2351990 to 1999
- 1,2761980 to 1989
- 8281970 to 1979
- 8151960 to 1969
- 1,0101950 to 1959
- 9231940 to 1949
- 3,3451939 or earlier
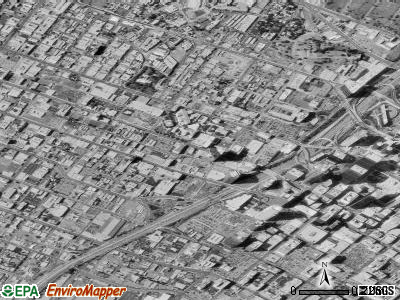
![Zip code 90017 satellite photo by USGS]()
Zip code 90017 household income distribution in 2022
![Zip code 90017 household income distribution in 2022]()
- 1,926Less than $10,000
- 1,223$10,000 to $14,999
- 748$15,000 to $19,999
- 515$20,000 to $24,999
- 576$25,000 to $29,999
- 699$30,000 to $34,999
- 703$35,000 to $39,999
- 505$40,000 to $44,999
- 347$45,000 to $49,999
- 968$50,000 to $59,999
- 1,204$60,000 to $74,999
- 1,454$75,000 to $99,999
- 692$100,000 to $124,999
- 674$125,000 to $149,999
- 842$150,000 to $199,999
- 808$200,000 or more
Estimate of home value of owner-occupied houses/condos in 2022 in zip code 90017
![Estimate of home value of owner-occupied houses/condos in 2022 in zip code 90017]()
- 11$300,000 to $399,999
- 20$400,000 to $499,999
- 403$500,000 to $749,999
- 119$750,000 to $999,999
- 167$1,000,000 to $1,499,999
- 17$1,500,000 to $1,999,999
- 36$2,000,000 or more
Rent paid by renters in 2022 in zip code 90017
![Rent paid by renters in 2022 in zip code 90017]()
- 74Less than $100
- 110$100 to $149
- 37$150 to $199
- 96$200 to $249
- 264$250 to $299
- 322$300 to $349
- 110$350 to $399
- 75$400 to $449
- 76$450 to $499
- 264$500 to $549
- 47$550 to $599
- 189$600 to $649
- 180$650 to $699
- 302$700 to $749
- 440$750 to $799
- 922$800 to $899
- 650$900 to $999
- 1,592$1,000 to $1,249
- 1,029$1,250 to $1,499
- 1,436$1,500 to $1,999
- 1,556$2,000 to $2,499
- 1,452$2,500 to $2,999
- 999$3,000 to $3,499
- 586$3,500 or more
- 116No cash rent
Median gross rent in 2022: $1,504.
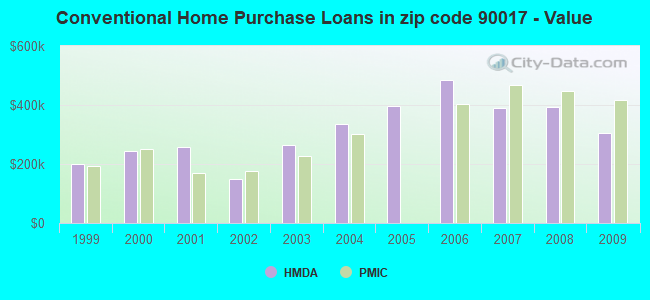
Median price asked for vacant for-sale houses and condos in 2022: $1,112,190.
Estimated median house (or condo) value in 2022 for:
- Asian householders: $480,913
- Two or more races householders: $665,880
- Hispanic or Latino householders: $762,655
Estimated median house or condo value in 2022: $769,758
| 90017: | $769,758 |
| California: | $715,900 |
$657,303 - $1,122,128
Mean price in 2022:
Detached houses: $443,381| Here: | $443,381 |
| State: | $988,808 |
Townhouses or other attached units: $13,867,382| Here: | $13,867,382 |
| State: | $838,546 |
In 5-or-more-unit structures: $512,479| Here: | $512,479 |
| State: | $730,996 |
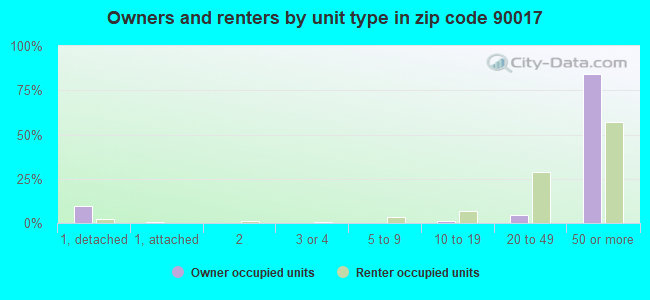
Housing units in structures:
- One, detached: 331
- One, attached: 39
- Two: 132
- 3 or 4: 141
- 5 to 9: 416
- 10 to 19: 883
- 20 to 49: 3,978
- 50 or more: 10,081
- Mobile homes: 37
Unemployment: 5.1%
Means of transportation to work in zip code 90017
![Means of transportation to work in zip code 90017]()
- 37.9%5,692Drove a car alone
- 8.3%1,247Carpooled
- 15.7%2,365Bus or trolley bus
- 1.7%261Streetcar or trolley car
- 0.1%20Subway or elevated
- 0.3%46Railroad
- 0.3%45Taxi
- 0.1%21Motorcycle
- 0.7%105Bicycle
- 13.3%1,996Walked
- 0.2%34Other means
- 18.3%2,745Worked at home
Travel time to work (commute) in zip code 90017
![Travel time to work (commute) in zip code 90017]()
- 129Less than 5 minutes
- 6835 to 9 minutes
- 1,47110 to 14 minutes
- 1,77515 to 19 minutes
- 1,38820 to 24 minutes
- 65425 to 29 minutes
- 2,54130 to 34 minutes
- 21435 to 39 minutes
- 43740 to 44 minutes
- 1,08945 to 59 minutes
- 1,30760 to 89 minutes
- 62990 or more minutes
Neighborhoods in zip code 90017:
Percentage of zip code residents living and working in this county: 99.5%
Household type by relationship:
Households: 28,515
- Male householders: 7,938 (4,103 living alone), Female householders: 5,848 (2,751 living alone)
2,483 spouses (2,320 opposite-sex spouses), 1,585 unmarried partners, (1,494 opposite-sex unmarried partners), 6,872 children (6,628 natural, 6 adopted, 236 stepchildren), 441 grandchildren, 575 brothers or sisters, 533 parents, 0 foster children, 922 other relatives, 1,207 non-relatives
- In group quarters: 316 (-1 institutionalized population)
Size of family households: 2,075 2-persons, 1,598 3-persons, 833 4-persons, 759 5-persons, 115 6-persons, 112 7-or-more-persons
Size of nonfamily households: 6,833 1-person, 1,468 2-persons, 128 3-persons, 20 5-persons
1,778 married couples with children.
3,135 single-parent households (1,360 men, 1,775 women).
31.8% of residents of 90017 zip code speak English at home.
50.5% of residents speak Spanish at home (48% very well, 16% well, 19% not well, 18% not at all).
1.7% of residents speak other Indo-European language at home (97% very well, 3% well).
14.1% of residents speak Asian or Pacific Island language at home (48% very well, 24% well, 21% not well, 8% not at all).
1.7% of residents speak other language at home (63% very well, 9% well, 21% not well, 7% not at all).
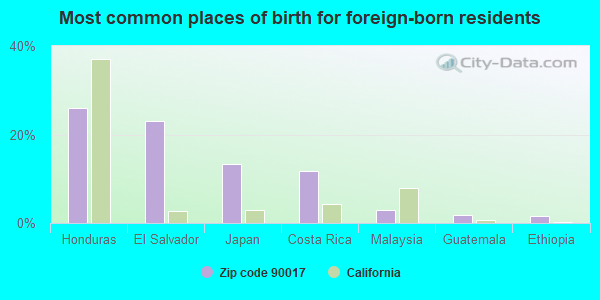
Foreign born population: 12,741 (44.7%)
(33.0%
of them are naturalized citizens)
| This zip code: | 44.7% |
| Whole state: | 26.7% |


- 26%Honduras
- 23%El Salvador
- 13%Japan
- 12%Costa Rica
- 3%Malaysia
- 2%Guatemala
- 2%Ethiopia

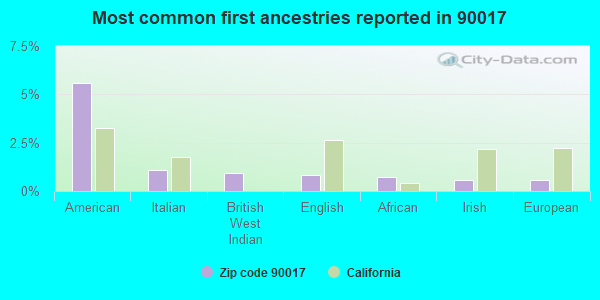
- 6%American
- 1%Italian
- 1%British West Indian
- 1%English
- 1%African
- 1%Irish
- 1%European

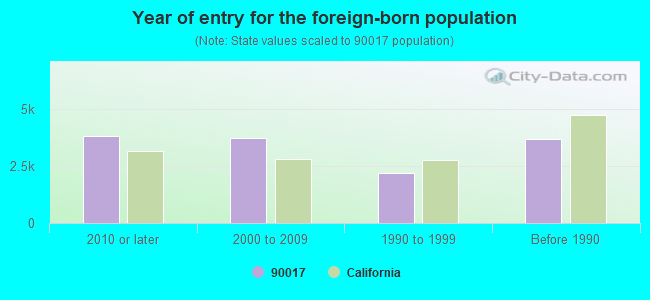
- Year of entry for the foreign-born population
- 3,7952010 or later
- 3,7422000 to 2009
- 2,1831990 to 1999
- 3,698Before 1990
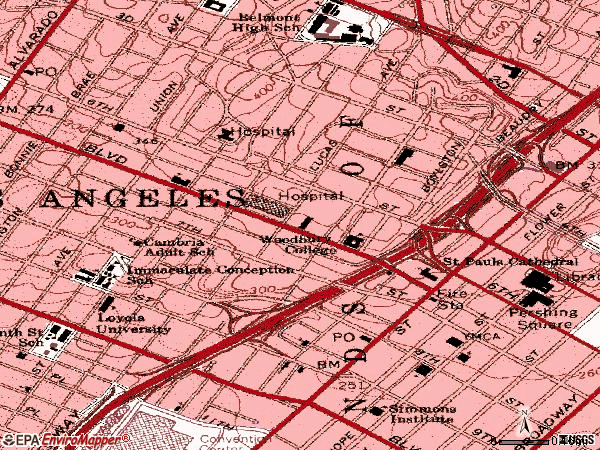
![Zip code 90017 topographic map]()
There are
91 Counselors 607 Other Medical Specialists in Zip Code 90017.
Major facilities with environmental interests located in this zip code:
- CENTRAL L A MIDDLE SCHOOL NO 1 (650 S UNION AVE in LOS ANGELES, CA)

STATE MASTER (California - Hazardous Waste Tracking) - HAZARDOU WASTE PROGRAM
Large Quantity Generators, more that 1000 kg of hazardous waste/month (Resource Conservation and Recovery Act (tracking hazardous waste)) - notification
Organizations: LAUSD (CONTACT/OPERATOR)
- CENTRAL PLANTS INCORPORATED (715 WEST 3RD STREET in LOS ANGELES, CA)
AIR MAJOR (AIRS/AFS)
STATE MASTER (California - Hazardous Waste Tracking) - HAZARDOU WASTE PROGRAM
CRITERIA AND HAZARDOUS AIR POLLUTANT INVENTORY (Inventory of air pollution sources)
HAZARDOUS WASTE BIENNIAL REPORTER (Resource Conservation and Recovery Act (tracking hazardous waste))
Small Quantity Generators, between 100 kg and 1000 kg of hazardous waste/month (Resource Conservation and Recovery Act (tracking hazardous waste))
Business SIC classification: STEAM AND AIR-CONDITIONING SUPPLY
Alternative names: CENTRAL PLANTS INC / BUNKER HILL, FIVEPLANTS ASSN BUNKER HILL CTL PLT, SEMPRA ENERGY, CENTRAL PLANTS
- ESPERANZA E S (680 LITTLE ST in LOS ANGELES, CA)
STATE MASTER (California - Hazardous Waste Tracking) - HAZARDOU WASTE PROGRAM
Large Quantity Generators, more that 1000 kg of hazardous waste/month (Resource Conservation and Recovery Act (tracking hazardous waste)) - notification
Organizations: L A UNIFIED SCHOOL DISTRICT (CONTACT/OWNER)
Alternative names: ESPERANZA ELEMENTARY
- CENTRAL L A AREA NEW H S NO 10 (322 S LUCAS AVE in LOS ANGELES, CA)
STATE MASTER (California - Hazardous Waste Tracking) - HAZARDOU WASTE PROGRAM
Large Quantity Generators, more that 1000 kg of hazardous waste/month (Resource Conservation and Recovery Act (tracking hazardous waste)) - notification
Organizations: L A UNIFIED SCHOOL DISTRICT (CONTACT/OWNER)
- EQUILON ENTERPRISES (1551 W 7TH in LOS ANGELES, CA) . Federal Facility
STATE MASTER (California - Hazardous Waste Tracking) - HAZARDOU WASTE PROGRAM
HAZARDOUS WASTE BIENNIAL REPORTER (Resource Conservation and Recovery Act (tracking hazardous waste))
Small Quantity Generators, between 100 kg and 1000 kg of hazardous waste/month (Resource Conservation and Recovery Act (tracking hazardous waste)) - notification
Organizations: EQUILON ENTERPRISES, LLC (CONTACT/OWNER)
Alternative names: SHELL OIL CO
- GRATTS (EVELYN THURMAN) ELEM (309 LUCAS AVE. in LOS ANGELES, CA)
(National Center for Education Statistics) - STATE ID-6113419
Organizations: LOS ANGELES UNIFIED (SCHOOL DISTRICT)
- CHARNOCK BASIN (SHELL OIL) (3801 SEPULVEDA BLVD. in LOS ANGELES, CA)
(Integrated Compliance Information System) - ICIS-09-2004-0412, FORMAL ENFORCEMENT ACTION, ENFORCEMENT/COMPLIANCE ACTIVITY
Business SIC classification: GASOLINE SERVICE STATIONS
- GRATTS NEW P C (474 S HARTFORD AVE in LOS ANGELES, CA)
Large Quantity Generators, more that 1000 kg of hazardous waste/month (Resource Conservation and Recovery Act (tracking hazardous waste))
Organizations: LA USD (CONTACT/OWNER)
- MARTIN BUILDING COMPANY (816 S. GRAND AVENUE in LOS ANGELES, CA)
Large Quantity Generators, more that 1000 kg of hazardous waste/month (Resource Conservation and Recovery Act (tracking hazardous waste))
Organizations: 816 GRAND PROPERTIES, LLC. (CONTACT/OWNER)
- ADAMS PLAZA (1545 WILSHIRE BLVD in LOS ANGELES, CA)
National Pollutant Discharge Elimination System NON-MAJOR (Tracking pollutant discharge elimination systems) - permit
Business SIC classification: OPERATORS OF NONRESIDENTIAL BUILDINGS
- HOLIDAY INNS (750 GARLAND AVE in LOS ANGELES, CA)
National Pollutant Discharge Elimination System NON-MAJOR (Tracking pollutant discharge elimination systems) - permit
Business SIC classification: HOTELS AND MOTELS
Organizations: HOLIDAY INNS, INC (CONTACT/OWNER)
- HOME DEPOT USA INC HD 1048 (1675 WILSHIRE BLVD in LOS ANGELES, CA)
Small Quantity Generators, between 100 kg and 1000 kg of hazardous waste/month (Resource Conservation and Recovery Act (tracking hazardous waste))
- KATHRYN POST INCORPORATED (1840 NORTH BEVERLY GLEN BOULEVARD in LOS ANGELES, CA)
Small Quantity Generators, between 100 kg and 1000 kg of hazardous waste/month (Resource Conservation and Recovery Act (tracking hazardous waste)) - notification
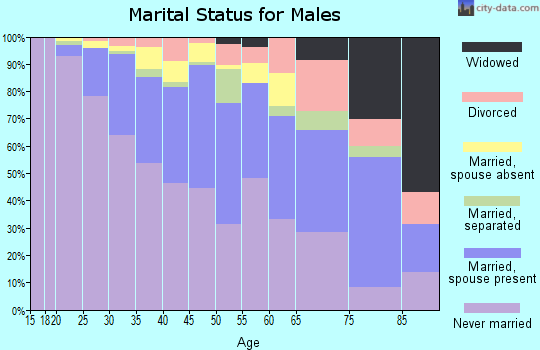
![Zip code 90017 marital status for males]()
![Zip code 90017 marital status for females]()
Housing units lacking complete plumbing facilities: 2.7%
Housing units lacking complete kitchen facilities: 4.8%

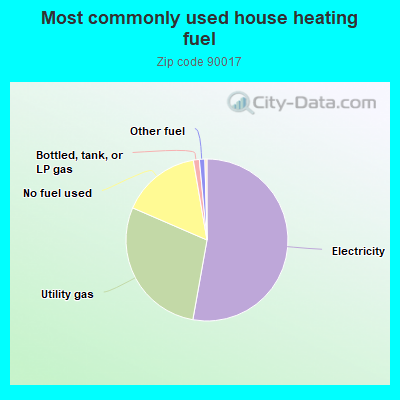
- 52.8%Electricity
- 28.7%Utility gas
- 15.8%No fuel used
- 1.2%Bottled, tank, or LP gas
- 1.1%Other fuel
Population in 1990: 21,790.
Place of birth for U.S.-born residents:
- This state: 11,311
- Northeast: 739
- Midwest: 1,176
- South: 1,603
- West: 447
46% of the 90017 zip code residents lived in the same house 5 years ago.
Out of people who lived in different houses, 92% lived in this county.
Out of people who lived in different counties, 50% lived in California.
80% of the 90017 zip code residents lived in the same house 1 year ago.
Out of people who lived in different houses, 63% moved from this county.
Out of people who lived in different houses, 13% moved from different county within same state.
Out of people who lived in different houses, 15% moved from different state.
Out of people who lived in different houses, 6% moved from abroad.
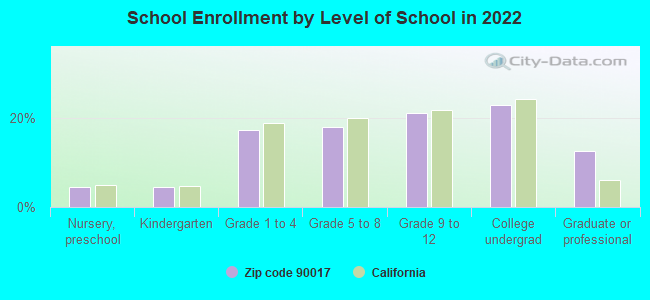
Private vs. public school enrollment:
Students in private schools in grades 1 to 8 (elementary and middle school): 65
| Here: | 3.0% |
| California: | 10.5% |
37
Students in private undergraduate colleges: 357
| Here: | 24.5% |
| California: | 15.9% |

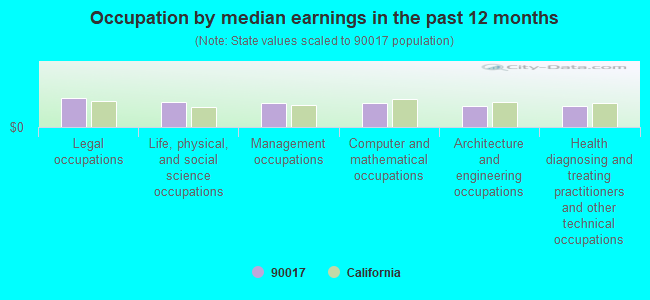
- Occupation by median earnings in the past 12 months ($)
- 108,098Legal occupations
- 92,785Life, physical, and social science occupations
- 89,023Management occupations
- 88,140Computer and mathematical occupations
- 78,846Architecture and engineering occupations
- 77,266Health diagnosing and treating practitioners and other technical occupations
Companies with federal contracts located in this zip code:
- DAMES & MOORE (911 WILSHIRE BLVD in LOS ANGELES, CA) : $27,614,471 in 201 contracts from 1999 to 2005
Contracts for Maintenance, Repair or Alteration of Real Property -- Unimproved Real Property (Land), Hazardous Substance Analysis, Other Architect and Engineering Services, Maintenance, Repair or Alteration of Real Property -- Other Non-Building Facilities, and more by Air Force, Army, U.S. Army Corps of Engineers - civil program financing only, National Oceanic and Atmospheric Administration/Under Secretary for Oceans and Atmosphere, and others
Signed by year: 2000: $12,196,079; 2001: $10,768,772; 2002: $3,751,353; 2003: $151,858; 2004: $23,273; 2005: -$1,741; 2006: $0.
Biggest contracts:
$2,647,147 with Air Force for Maintenance, Repair or Alteration of Real Property -- Unimproved Real Property (Land). Taking place in MO. Signed on 2001-08-01. Completion date: 2002-06-30.
$2,590,800, same as above. Signed on 2002-03-19. Completion date: 2002-06-30.
$1,546,003 with Army for Hazardous Substance Analysis. Taking place in NV. Signed on 2001-07-31. Completion date: 2002-04-30.
$1,446,477 with Army for Other Architect and Engineering Services. Taking place in NV. Signed on 2000-09-30. Completion date: 2001-06-29.
- QUADRANT MANAGEMENT SERVICES, (700 S FLOWER ST STE 1100 in LOS ANGELES, CA; small business) : $89,256 in 3 contracts from 2005 to 2006
$60,604 with Air Force for Educational Services. Taking place in SC. Signed on 2005-10-01. Completion date: 2006-09-30.
$25,452 with Air Force for Other Administrative Support Services. Taking place in SC. Signed on 2005-10-01. Completion date: 2006-09-30.
$3,200 with Air Force for Educational Services. Taking place in SC. Signed on 2006-05-26. Completion date: 2006-09-30.
- WILLIAM F WHITE INTERNATIONAL (1201 WEST 5TH STREET - S in LOS ANGELES, CA; small business)
$34,824 with Navy for Fiber Optic Cables. Signed on 2002-12-18. Completion date: 2003-03-28.
Top industries in this zip code by the number of employees in 2005:
- Professional, Scientific, and Technical Services: Offices of Lawyers (250-499 employees: 1 establishment, 100-249 employees: 8 establishments, 50-99 employees: 17 establishments, 20-49 employees: 28 establishments, 10-19 employees: 33 establishments, 5-9 employees: 38 establishments, 1-4 employees: 172 establishments)
- Administrative and Support and Waste Management and Remediation Services: Temporary Help Services (500-999: 1, 250-499: 2, 100-249: 3, 50-99: 1, 20-49: 6, 10-19: 2, 1-4: 4)
- Finance and Insurance: Commercial Banking (250-499: 3, 100-249: 2, 50-99: 3, 20-49: 12, 10-19: 8, 5-9: 5, 1-4: 13)
- Administrative and Support and Waste Management and Remediation Services: Security Guards and Patrol Services (500-999: 1, 250-499: 2, 100-249: 1, 50-99: 2, 20-49: 1, 5-9: 1, 1-4: 3)
- Professional, Scientific, and Technical Services: Offices of Certified Public Accountants (500-999: 1, 250-499: 1, 100-249: 2, 50-99: 1, 20-49: 3, 10-19: 5, 5-9: 9, 1-4: 15)
- Health Care and Social Assistance: General Medical and Surgical Hospitals (over 1000: 1)
- Finance and Insurance: Insurance Agencies and Brokerages (250-499: 1, 100-249: 2, 50-99: 2, 20-49: 8, 10-19: 9, 5-9: 6, 1-4: 22)
- Accommodation and Food Services: Hotels (except Casino Hotels) and Motels (500-999: 1, 100-249: 1, 20-49: 1, 5-9: 2, 1-4: 3)
- Information: Wired Telecommunications Carriers (250-499: 1, 100-249: 1, 50-99: 2, 20-49: 4, 10-19: 2, 5-9: 6, 1-4: 20)
- Other Services (except Public Administration): Parking Lots and Garages (250-499: 1, 50-99: 2, 20-49: 2, 10-19: 8, 5-9: 10, 1-4: 45)
People in group quarters in 2010:
- 69 people in other noninstitutional facilities
- 68 people in group homes intended for adults
- 44 people in nursing facilities/skilled-nursing facilities
People in group quarters in 2000:
- 363 people in other group homes
- 173 people in orthopedic wards and institutions for the physically handicapped
- 171 people in other noninstitutional group quarters
- 144 people in homes or halfway houses for drug/alcohol abuse
- 46 people in nursing homes
- 7 people in religious group quarters
Fatal accident statistics in 2014:
- Fatal accident count: 2
- Vehicles involved in fatal accidents: 4
- Fatal accidents caused by drunken drivers: 2
- Fatalities: 4
- Persons involved in fatal accidents: 5
- Pedestrians involved in fatal accidents: 0
Fatal accident statistics in 2013:
- Fatal accident count: 2
- Vehicles involved in fatal accidents: 3
- Fatal accidents caused by drunken drivers: 0
- Fatalities: 2
- Persons involved in fatal accidents: 3
- Pedestrians involved in fatal accidents: 1
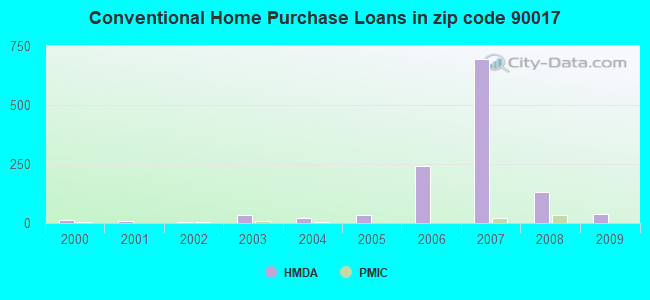
Home Mortgage Disclosure Act Aggregated Statistics For Year 2009
(Based on 5 full and 10 partial tracts)
|
| A) FHA, FSA/RHS & VA
Home Purchase Loans | B) Conventional
Home Purchase Loans | C) Refinancings
| D) Home Improvement Loans
| E) Loans on Dwellings For 5+ Families
| F) Non-occupant Loans on
< 5 Family Dwellings (A B C & D) |
|---|
| Number | Average Value | Number | Average Value | Number | Average Value | Number | Average Value | Number | Average Value | Number | Average Value |
|---|
| LOANS ORIGINATED | 2 | $300,685 | 39 | $304,534 | 55 | $338,836 | 2 | $295,355 | 8 | $17,171,990 | 21 | $265,060 |
| APPLICATIONS APPROVED, NOT ACCEPTED | 3 | $415,717 | 15 | $343,864 | 6 | $293,583 | 0 | $0 | 3 | $10,033,950 | 4 | $312,180 |
| APPLICATIONS DENIED | 1 | $420,650 | 22 | $384,860 | 48 | $365,880 | 3 | $17,893 | 3 | $373,360 | 22 | $372,524 |
| APPLICATIONS WITHDRAWN | 1 | $249,120 | 8 | $326,798 | 15 | $417,475 | 3 | $59,817 | 4 | $48,719,850 | 4 | $327,995 |
| FILES CLOSED FOR INCOMPLETENESS | 0 | $0 | 5 | $436,802 | 5 | $339,930 | 0 | $0 | 0 | $0 | 2 | $429,410 |
Aggregated Statistics For Year 2008
(Based on 5 full and 10 partial tracts)
|
| A) FHA, FSA/RHS & VA
Home Purchase Loans | B) Conventional
Home Purchase Loans | C) Refinancings
| D) Home Improvement Loans
| E) Loans on Dwellings For 5+ Families
| F) Non-occupant Loans on
< 5 Family Dwellings (A B C & D) | G) Loans On Manufactured
Home Dwelling (A B C & D) |
|---|
| Number | Average Value | Number | Average Value | Number | Average Value | Number | Average Value | Number | Average Value | Number | Average Value | Number | Average Value |
|---|
| LOANS ORIGINATED | 0 | $0 | 133 | $394,663 | 43 | $348,259 | 2 | $319,650 | 24 | $1,314,888 | 58 | $376,518 | 0 | $0 |
| APPLICATIONS APPROVED, NOT ACCEPTED | 0 | $0 | 84 | $408,548 | 13 | $338,982 | 1 | $80,000 | 1 | $4,413,530 | 18 | $389,412 | 2 | $48,945 |
| APPLICATIONS DENIED | 0 | $0 | 83 | $393,238 | 34 | $346,116 | 3 | $215,927 | 11 | $1,558,020 | 18 | $310,471 | 2 | $119,660 |
| APPLICATIONS WITHDRAWN | 2 | $236,615 | 57 | $419,748 | 18 | $500,281 | 2 | $276,165 | 3 | $798,093 | 17 | $390,068 | 0 | $0 |
| FILES CLOSED FOR INCOMPLETENESS | 0 | $0 | 19 | $449,354 | 4 | $493,075 | 0 | $0 | 2 | $930,705 | 3 | $546,430 | 0 | $0 |
Aggregated Statistics For Year 2007
(Based on 5 full and 10 partial tracts)
|
| B) Conventional
Home Purchase Loans | C) Refinancings
| D) Home Improvement Loans
| E) Loans on Dwellings For 5+ Families
| F) Non-occupant Loans on
< 5 Family Dwellings (A B C & D) |
|---|
| Number | Average Value | Number | Average Value | Number | Average Value | Number | Average Value | Number | Average Value |
|---|
| LOANS ORIGINATED | 696 | $391,145 | 39 | $583,538 | 6 | $439,685 | 31 | $6,173,280 | 175 | $448,501 |
| APPLICATIONS APPROVED, NOT ACCEPTED | 241 | $427,405 | 19 | $481,051 | 5 | $268,530 | 0 | $0 | 62 | $374,572 |
| APPLICATIONS DENIED | 225 | $382,529 | 56 | $352,966 | 12 | $113,219 | 6 | $1,023,158 | 45 | $430,259 |
| APPLICATIONS WITHDRAWN | 105 | $425,662 | 19 | $441,198 | 5 | $49,976 | 3 | $1,006,397 | 30 | $422,043 |
| FILES CLOSED FOR INCOMPLETENESS | 21 | $697,290 | 6 | $593,970 | 1 | $181,460 | 1 | $1,050,000 | 5 | $891,496 |
Aggregated Statistics For Year 2006
(Based on 5 full and 10 partial tracts)
|
| B) Conventional
Home Purchase Loans | C) Refinancings
| D) Home Improvement Loans
| E) Loans on Dwellings For 5+ Families
| F) Non-occupant Loans on
< 5 Family Dwellings (A B C & D) | G) Loans On Manufactured
Home Dwelling (A B C & D) |
|---|
| Number | Average Value | Number | Average Value | Number | Average Value | Number | Average Value | Number | Average Value | Number | Average Value |
|---|
| LOANS ORIGINATED | 241 | $483,236 | 20 | $556,716 | 6 | $416,707 | 36 | $1,175,738 | 62 | $482,026 | 2 | $68,055 |
| APPLICATIONS APPROVED, NOT ACCEPTED | 173 | $451,585 | 15 | $402,002 | 0 | $0 | 1 | $535,820 | 55 | $409,534 | 0 | $0 |
| APPLICATIONS DENIED | 187 | $462,928 | 27 | $466,799 | 2 | $334,650 | 4 | $19,812,630 | 31 | $460,667 | 1 | $241,000 |
| APPLICATIONS WITHDRAWN | 92 | $554,493 | 24 | $396,601 | 2 | $24,655 | 2 | $633,435 | 16 | $592,127 | 0 | $0 |
| FILES CLOSED FOR INCOMPLETENESS | 19 | $433,632 | 9 | $418,859 | 2 | $29,965 | 0 | $0 | 7 | $427,603 | 0 | $0 |
Aggregated Statistics For Year 2005
(Based on 5 full and 10 partial tracts)
|
| B) Conventional
Home Purchase Loans | C) Refinancings
| D) Home Improvement Loans
| E) Loans on Dwellings For 5+ Families
| F) Non-occupant Loans on
< 5 Family Dwellings (A B C & D) | G) Loans On Manufactured
Home Dwelling (A B C & D) |
|---|
| Number | Average Value | Number | Average Value | Number | Average Value | Number | Average Value | Number | Average Value | Number | Average Value |
|---|
| LOANS ORIGINATED | 32 | $397,182 | 32 | $390,085 | 1 | $245,040 | 63 | $3,016,779 | 11 | $444,099 | 0 | $0 |
| APPLICATIONS APPROVED, NOT ACCEPTED | 18 | $361,849 | 9 | $372,186 | 0 | $0 | 2 | $851,175 | 3 | $362,690 | 0 | $0 |
| APPLICATIONS DENIED | 59 | $361,171 | 43 | $421,456 | 5 | $206,994 | 4 | $1,282,340 | 13 | $441,605 | 2 | $90,740 |
| APPLICATIONS WITHDRAWN | 36 | $341,508 | 12 | $320,742 | 1 | $57,740 | 7 | $970,854 | 9 | $340,170 | 0 | $0 |
| FILES CLOSED FOR INCOMPLETENESS | 7 | $421,694 | 3 | $461,690 | 0 | $0 | 2 | $349,615 | 3 | $416,667 | 0 | $0 |
Aggregated Statistics For Year 2004
(Based on 5 full and 10 partial tracts)
|
| A) FHA, FSA/RHS & VA
Home Purchase Loans | B) Conventional
Home Purchase Loans | C) Refinancings
| D) Home Improvement Loans
| E) Loans on Dwellings For 5+ Families
| F) Non-occupant Loans on
< 5 Family Dwellings (A B C & D) |
|---|
| Number | Average Value | Number | Average Value | Number | Average Value | Number | Average Value | Number | Average Value | Number | Average Value |
|---|
| LOANS ORIGINATED | 0 | $0 | 20 | $337,048 | 52 | $259,745 | 7 | $193,009 | 71 | $2,533,045 | 5 | $317,880 |
| APPLICATIONS APPROVED, NOT ACCEPTED | 0 | $0 | 13 | $230,288 | 14 | $330,778 | 0 | $0 | 3 | $549,910 | 0 | $0 |
| APPLICATIONS DENIED | 2 | $225,750 | 21 | $263,557 | 36 | $219,200 | 10 | $95,480 | 6 | $588,342 | 6 | $311,898 |
| APPLICATIONS WITHDRAWN | 0 | $0 | 18 | $437,352 | 12 | $225,412 | 0 | $0 | 7 | $1,002,710 | 7 | $242,530 |
| FILES CLOSED FOR INCOMPLETENESS | 0 | $0 | 1 | $360,850 | 1 | $1,031,000 | 0 | $0 | 1 | $894,000 | 0 | $0 |
Aggregated Statistics For Year 2003
(Based on 5 full and 10 partial tracts)
|
| A) FHA, FSA/RHS & VA
Home Purchase Loans | B) Conventional
Home Purchase Loans | C) Refinancings
| D) Home Improvement Loans
| E) Loans on Dwellings For 5+ Families
| F) Non-occupant Loans on
< 5 Family Dwellings (A B C & D) |
|---|
| Number | Average Value | Number | Average Value | Number | Average Value | Number | Average Value | Number | Average Value | Number | Average Value |
|---|
| LOANS ORIGINATED | 4 | $169,510 | 36 | $265,846 | 79 | $229,392 | 1 | $25,770 | 59 | $4,346,365 | 36 | $200,362 |
| APPLICATIONS APPROVED, NOT ACCEPTED | 2 | $264,015 | 19 | $276,028 | 8 | $224,576 | 0 | $0 | 1 | $86,940 | 1 | $442,420 |
| APPLICATIONS DENIED | 0 | $0 | 28 | $221,747 | 30 | $239,826 | 5 | $70,548 | 4 | $465,202 | 13 | $207,041 |
| APPLICATIONS WITHDRAWN | 0 | $0 | 16 | $255,250 | 38 | $165,600 | 3 | $40,747 | 2 | $360,605 | 4 | $227,690 |
| FILES CLOSED FOR INCOMPLETENESS | 0 | $0 | 3 | $300,097 | 11 | $206,728 | 0 | $0 | 5 | $653,608 | 8 | $185,404 |
Aggregated Statistics For Year 2002
(Based on 5 full and 6 partial tracts)
|
| A) FHA, FSA/RHS & VA
Home Purchase Loans | B) Conventional
Home Purchase Loans | C) Refinancings
| D) Home Improvement Loans
| E) Loans on Dwellings For 5+ Families
| F) Non-occupant Loans on
< 5 Family Dwellings (A B C & D) |
|---|
| Number | Average Value | Number | Average Value | Number | Average Value | Number | Average Value | Number | Average Value | Number | Average Value |
|---|
| LOANS ORIGINATED | 0 | $0 | 4 | $149,145 | 20 | $148,237 | 2 | $32,290 | 33 | $728,482 | 2 | $197,540 |
| APPLICATIONS APPROVED, NOT ACCEPTED | 0 | $0 | 5 | $265,738 | 7 | $226,487 | 0 | $0 | 5 | $766,760 | 0 | $0 |
| APPLICATIONS DENIED | 0 | $0 | 16 | $183,388 | 20 | $178,176 | 10 | $16,834 | 4 | $430,880 | 5 | $181,100 |
| APPLICATIONS WITHDRAWN | 0 | $0 | 13 | $128,138 | 14 | $181,129 | 1 | $27,660 | 9 | $458,028 | 1 | $185,000 |
| FILES CLOSED FOR INCOMPLETENESS | 2 | $149,835 | 1 | $171,000 | 2 | $268,275 | 0 | $0 | 0 | $0 | 0 | $0 |
Aggregated Statistics For Year 2001
(Based on 5 full and 6 partial tracts)
|
| A) FHA, FSA/RHS & VA
Home Purchase Loans | B) Conventional
Home Purchase Loans | C) Refinancings
| D) Home Improvement Loans
| E) Loans on Dwellings For 5+ Families
| F) Non-occupant Loans on
< 5 Family Dwellings (A B C & D) |
|---|
| Number | Average Value | Number | Average Value | Number | Average Value | Number | Average Value | Number | Average Value | Number | Average Value |
|---|
| LOANS ORIGINATED | 4 | $193,202 | 9 | $258,026 | 18 | $190,835 | 2 | $5,700 | 29 | $501,390 | 6 | $157,068 |
| APPLICATIONS APPROVED, NOT ACCEPTED | 2 | $216,760 | 1 | $182,210 | 4 | $163,362 | 2 | $28,490 | 0 | $0 | 3 | $207,483 |
| APPLICATIONS DENIED | 2 | $216,760 | 7 | $108,067 | 20 | $249,420 | 2 | $6,580 | 5 | $614,798 | 1 | $107,490 |
| APPLICATIONS WITHDRAWN | 0 | $0 | 8 | $155,635 | 8 | $105,271 | 1 | $10,640 | 1 | $544,000 | 2 | $142,455 |
| FILES CLOSED FOR INCOMPLETENESS | 0 | $0 | 0 | $0 | 0 | $0 | 0 | $0 | 3 | $418,667 | 0 | $0 |
Aggregated Statistics For Year 2000
(Based on 5 full and 6 partial tracts)
|
| A) FHA, FSA/RHS & VA
Home Purchase Loans | B) Conventional
Home Purchase Loans | C) Refinancings
| D) Home Improvement Loans
| E) Loans on Dwellings For 5+ Families
| F) Non-occupant Loans on
< 5 Family Dwellings (A B C & D) |
|---|
| Number | Average Value | Number | Average Value | Number | Average Value | Number | Average Value | Number | Average Value | Number | Average Value |
|---|
| LOANS ORIGINATED | 5 | $173,582 | 14 | $244,126 | 7 | $148,897 | 0 | $0 | 25 | $700,510 | 6 | $144,508 |
| APPLICATIONS APPROVED, NOT ACCEPTED | 0 | $0 | 3 | $190,543 | 0 | $0 | 3 | $34,503 | 1 | $2,300,000 | 0 | $0 |
| APPLICATIONS DENIED | 4 | $187,112 | 4 | $141,345 | 5 | $266,414 | 6 | $24,800 | 9 | $747,998 | 1 | $16,600 |
| APPLICATIONS WITHDRAWN | 0 | $0 | 4 | $94,642 | 5 | $52,704 | 0 | $0 | 6 | $1,010,468 | 0 | $0 |
| FILES CLOSED FOR INCOMPLETENESS | 0 | $0 | 4 | $141,918 | 9 | $153,588 | 0 | $0 | 0 | $0 | 6 | $139,847 |
Aggregated Statistics For Year 1999
(Based on 2 full and 6 partial tracts)
|
| A) FHA, FSA/RHS & VA
Home Purchase Loans | B) Conventional
Home Purchase Loans | C) Refinancings
| D) Home Improvement Loans
| E) Loans on Dwellings For 5+ Families
| F) Non-occupant Loans on
< 5 Family Dwellings (A B C & D) |
|---|
| Number | Average Value | Number | Average Value | Number | Average Value | Number | Average Value | Number | Average Value | Number | Average Value |
|---|
| LOANS ORIGINATED | 1 | $75,000 | 5 | $199,120 | 15 | $183,187 | 3 | $1,107 | 10 | $361,620 | 4 | $159,600 |
| APPLICATIONS APPROVED, NOT ACCEPTED | 0 | $0 | 0 | $0 | 1 | $270,970 | 1 | $13,510 | 1 | $135,370 | 0 | $0 |
| APPLICATIONS DENIED | 0 | $0 | 1 | $35,120 | 13 | $125,258 | 2 | $29,240 | 4 | $510,482 | 3 | $257,570 |
| APPLICATIONS WITHDRAWN | 1 | $97,450 | 2 | $128,090 | 6 | $172,685 | 0 | $0 | 4 | $593,012 | 2 | $245,605 |
| FILES CLOSED FOR INCOMPLETENESS | 1 | $115,000 | 2 | $83,050 | 2 | $206,130 | 0 | $0 | 2 | $330,820 | 1 | $64,150 |
Private Mortgage Insurance Companies Aggregated Statistics For Year 2009
(Based on 1 full and 4 partial tracts)
|
| A) Conventional
Home Purchase Loans | B) Refinancings
|
|---|
| Number | Average Value | Number | Average Value |
|---|
| LOANS ORIGINATED | 1 | $416,520 | 5 | $381,946 |
| APPLICATIONS APPROVED, NOT ACCEPTED | 2 | $457,755 | 0 | $0 |
| APPLICATIONS DENIED | 3 | $353,633 | 1 | $424,770 |
| APPLICATIONS WITHDRAWN | 0 | $0 | 1 | $413,000 |
| FILES CLOSED FOR INCOMPLETENESS | 0 | $0 | 0 | $0 |
Aggregated Statistics For Year 2008
(Based on 3 full and 4 partial tracts)
|
| A) Conventional
Home Purchase Loans | B) Refinancings
| C) Non-occupant Loans on
< 5 Family Dwellings (A & B) |
|---|
| Number | Average Value | Number | Average Value | Number | Average Value |
|---|
| LOANS ORIGINATED | 34 | $448,909 | 3 | $407,327 | 6 | $399,263 |
| APPLICATIONS APPROVED, NOT ACCEPTED | 11 | $447,185 | 2 | $375,130 | 2 | $265,705 |
| APPLICATIONS DENIED | 6 | $515,053 | 0 | $0 | 0 | $0 |
| APPLICATIONS WITHDRAWN | 3 | $447,793 | 0 | $0 | 0 | $0 |
| FILES CLOSED FOR INCOMPLETENESS | 0 | $0 | 0 | $0 | 0 | $0 |
Aggregated Statistics For Year 2007
(Based on 1 full and 4 partial tracts)
|
| A) Conventional
Home Purchase Loans | B) Refinancings
| C) Non-occupant Loans on
< 5 Family Dwellings (A & B) |
|---|
| Number | Average Value | Number | Average Value | Number | Average Value |
|---|
| LOANS ORIGINATED | 23 | $468,325 | 2 | $536,580 | 1 | $898,000 |
| APPLICATIONS APPROVED, NOT ACCEPTED | 2 | $392,500 | 0 | $0 | 0 | $0 |
| APPLICATIONS DENIED | 6 | $375,297 | 0 | $0 | 0 | $0 |
| APPLICATIONS WITHDRAWN | 1 | $463,000 | 0 | $0 | 0 | $0 |
| FILES CLOSED FOR INCOMPLETENESS | 1 | $399,000 | 0 | $0 | 0 | $0 |
Aggregated Statistics For Year 2006
(Based on 2 partial tracts)
|
| A) Conventional
Home Purchase Loans |
|---|
| Number | Average Value |
|---|
| LOANS ORIGINATED | 1 | $402,090 |
| APPLICATIONS APPROVED, NOT ACCEPTED | 0 | $0 |
| APPLICATIONS DENIED | 0 | $0 |
| APPLICATIONS WITHDRAWN | 0 | $0 |
| FILES CLOSED FOR INCOMPLETENESS | 0 | $0 |
Aggregated Statistics For Year 2005
(Based on 4 partial tracts)
|
| A) Conventional
Home Purchase Loans |
|---|
| Number | Average Value |
|---|
| LOANS ORIGINATED | 0 | $0 |
| APPLICATIONS APPROVED, NOT ACCEPTED | 3 | $496,210 |
| APPLICATIONS DENIED | 0 | $0 |
| APPLICATIONS WITHDRAWN | 0 | $0 |
| FILES CLOSED FOR INCOMPLETENESS | 0 | $0 |
Aggregated Statistics For Year 2004
(Based on 2 full and 4 partial tracts)
|
| A) Conventional
Home Purchase Loans |
|---|
| Number | Average Value |
|---|
| LOANS ORIGINATED | 5 | $300,538 |
| APPLICATIONS APPROVED, NOT ACCEPTED | 0 | $0 |
| APPLICATIONS DENIED | 0 | $0 |
| APPLICATIONS WITHDRAWN | 0 | $0 |
| FILES CLOSED FOR INCOMPLETENESS | 0 | $0 |
Aggregated Statistics For Year 2003
(Based on 5 full and 2 partial tracts)
|
| A) Conventional
Home Purchase Loans | B) Refinancings
|
|---|
| Number | Average Value | Number | Average Value |
|---|
| LOANS ORIGINATED | 8 | $227,590 | 0 | $0 |
| APPLICATIONS APPROVED, NOT ACCEPTED | 1 | $216,000 | 1 | $422,560 |
| APPLICATIONS DENIED | 0 | $0 | 0 | $0 |
| APPLICATIONS WITHDRAWN | 0 | $0 | 0 | $0 |
| FILES CLOSED FOR INCOMPLETENESS | 0 | $0 | 0 | $0 |
Aggregated Statistics For Year 2002
(Based on 3 full and 2 partial tracts)
|
| A) Conventional
Home Purchase Loans | B) Refinancings
|
|---|
| Number | Average Value | Number | Average Value |
|---|
| LOANS ORIGINATED | 6 | $175,473 | 1 | $182,210 |
| APPLICATIONS APPROVED, NOT ACCEPTED | 3 | $229,887 | 0 | $0 |
| APPLICATIONS DENIED | 0 | $0 | 1 | $204,190 |
| APPLICATIONS WITHDRAWN | 2 | $211,765 | 0 | $0 |
| FILES CLOSED FOR INCOMPLETENESS | 0 | $0 | 0 | $0 |
Aggregated Statistics For Year 2001
(Based on 3 full tracts)
|
| A) Conventional
Home Purchase Loans |
|---|
| Number | Average Value |
|---|
| LOANS ORIGINATED | 1 | $170,000 |
| APPLICATIONS APPROVED, NOT ACCEPTED | 3 | $209,213 |
| APPLICATIONS DENIED | 0 | $0 |
| APPLICATIONS WITHDRAWN | 1 | $170,000 |
| FILES CLOSED FOR INCOMPLETENESS | 0 | $0 |
Aggregated Statistics For Year 2000
(Based on 5 full and 6 partial tracts)
|
| A) Conventional
Home Purchase Loans | B) Refinancings
| C) Non-occupant Loans on
< 5 Family Dwellings (A & B) |
|---|
| Number | Average Value | Number | Average Value | Number | Average Value |
|---|
| LOANS ORIGINATED | 6 | $252,120 | 1 | $141,800 | 0 | $0 |
| APPLICATIONS APPROVED, NOT ACCEPTED | 0 | $0 | 0 | $0 | 0 | $0 |
| APPLICATIONS DENIED | 3 | $147,837 | 0 | $0 | 2 | $160,500 |
| APPLICATIONS WITHDRAWN | 0 | $0 | 0 | $0 | 0 | $0 |
| FILES CLOSED FOR INCOMPLETENESS | 0 | $0 | 0 | $0 | 0 | $0 |
Aggregated Statistics For Year 1999
(Based on 1 full and 3 partial tracts)
|
| A) Conventional
Home Purchase Loans | B) Refinancings
|
|---|
| Number | Average Value | Number | Average Value |
|---|
| LOANS ORIGINATED | 2 | $193,065 | 1 | $98,000 |
| APPLICATIONS APPROVED, NOT ACCEPTED | 0 | $0 | 0 | $0 |
| APPLICATIONS DENIED | 0 | $0 | 0 | $0 |
| APPLICATIONS WITHDRAWN | 0 | $0 | 0 | $0 |
| FILES CLOSED FOR INCOMPLETENESS | 0 | $0 | 1 | $93,020 |
2005 - 2018 National Fire Incident Reporting System (NFIRS) incidents
See full 2006 National Fire Incident Reporting System statistics for zip code 90017, California
| Most common first names in zip code 90017 among deceased individuals |
| Name | Count | Lived (average) |
|---|
| John | 210 | 73.9 years |
| William | 144 | 74.2 years |
| James | 112 | 72.7 years |
| George | 102 | 75.2 years |
| Joseph | 93 | 74.9 years |
| Charles | 90 | 75.7 years |
| Robert | 88 | 72.9 years |
| Frank | 88 | 74.4 years |
| Edward | 61 | 70.9 years |
| Harry | 56 | 74.5 years |
| Most common last names in zip code 90017 among deceased individuals |
| Last name | Count | Lived (average) |
|---|
| Smith | 50 | 76.3 years |
| Johnson | 50 | 75.2 years |
| Kim | 33 | 78.8 years |
| Lee | 28 | 77.6 years |
| Brown | 27 | 72.9 years |
| Miller | 24 | 74.0 years |
| White | 23 | 78.8 years |
| Davis | 19 | 69.6 years |
| Williams | 18 | 72.1 years |
| Hernandez | 17 | 66.9 years |
| Businesses in zip code 90017 |
| Name | Count | | Name | Count |
| Bally Total Fitness | 1 | | Macy's | 1 |
| Bath & Body Works | 1 | | McDonald's | 1 |
| Carl\s Jr. | 1 | | Motherhood Maternity | 1 |
| Comfort Inn | 1 | | Nike | 4 |
| DHL | 2 | | Panda Express | 1 |
| Dennys | 1 | | Qdoba Mexican Grill | 1 |
| Express | 1 | | Quiznos | 1 |
| FedEx | 21 | | RadioShack | 1 |
| GNC | 1 | | Rite Aid | 2 |
| Haworth | 1 | | Sheraton | 1 |
| Home Depot | 1 | | Sprint Nextel | 2 |
| IHOP | 1 | | Starbucks | 3 |
| Jones New York | 1 | | T-Mobile | 1 |
| KFC | 1 | | U-Haul | 1 |
| Kroger | 1 | | UPS | 19 |
| LA Fitness | 1 | | Victoria's Secret | 1 |
| Little Caesars Pizza | 1 | | Walgreens | 1 |