Estimated zip code population in 2022: 9,634
Zip code population in 2010: 9,031
Zip code population in 2000: 9,067
Houses and condos: 4,778
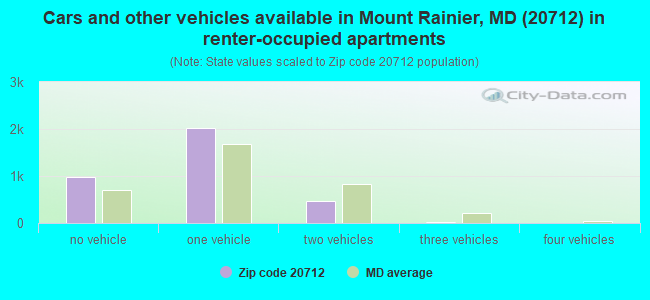
Renter-occupied apartments: 3,466
| % of renters here: | 75% |
| State: | 32% |
168.7
(very high, U.S. average is 100)
Land area: 0.7
sq. mi.
Water area: 0.0
sq. mi.
| Population density: 13,186 people per square mile | | (very high). |
![Age and Sex of Residents in zip code 20712]()
- OSM Map
- General Map
- Google Map
- MSN Map
- OSM Map
- General Map
- Google Map
- MSN Map
- OSM Map
- General Map
- Google Map
- MSN Map
- OSM Map
- General Map
- Google Map
- MSN Map
Please wait while loading the map...
Real estate property taxes paid for housing units in 2022:
| This zip code: | 1.0% ($5,418) |
| Maryland: | 0.9% ($3,777) |
$5,593 (1.1%)
Median real estate property taxes paid for housing units with no mortgage in 2022: $4,849 (0.9%)

Profiles of local businesses
Business Search - 14 Million verified businesses
| Males: 4,640 |  (48.2%) (48.2%) |
| Females: 4,993 |  (51.8%) (51.8%) |
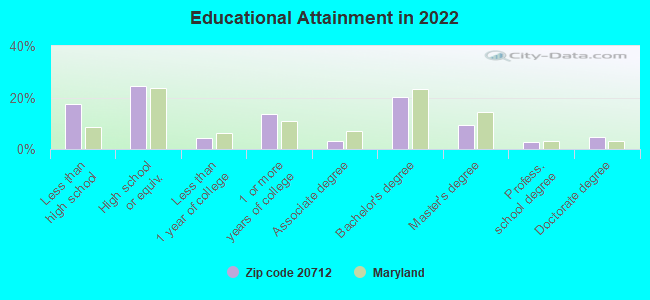
For population 25 years and over in 20712:
- High school or higher: 81.6%
- Bachelor's degree or higher: 36.4%
- Graduate or professional degree: 16.3%
- Unemployed: 4.7%
- Mean travel time to work (commute): 31.4 minutes
For population 15 years and over in 20712:
- Never married: 39.5%
- Now married: 45.8%
- Separated: 2.1%
- Widowed: 4.3%
- Divorced: 8.3%
Zip code 20712 compared to state average:
- Median household income below state average.
- Hispanic race population percentage significantly above state average.
- Foreign-born population percentage significantly above state average.
- Renting percentage significantly above state average.
- Length of stay since moving in above state average.
- Number of rooms per house significantly below state average.
- House age above state average.


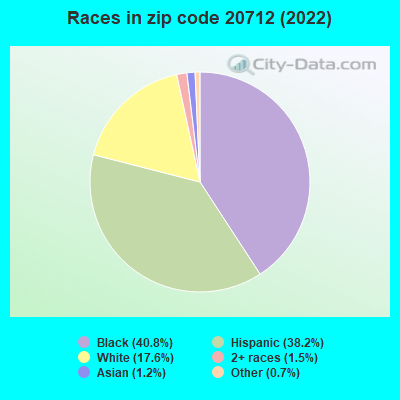
- 3,93340.8%Black
- 3,67538.2%Hispanic or Latino
- 1,69417.6%White
- 1491.5%Two or more races
- 1141.2%Asian
- 670.7%Some other race
Data:
100%
urban population.
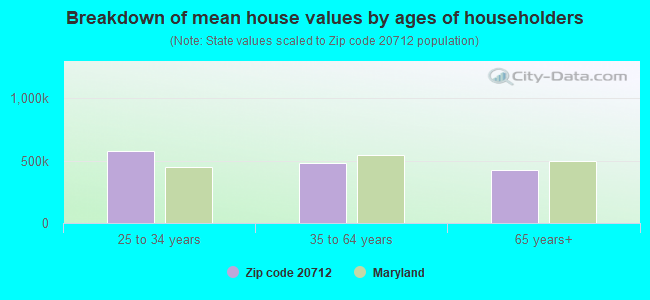
Estimated median house/condo value in 2022: $520,826
| 20712: | $520,826 |
| Maryland: | $398,100 |
According to our research of Maryland and other state lists, there were 10 registered sex offenders living in 20712 zip code as of July 23, 2024.
The ratio of all residents to sex offenders in zip code 20712 is 933 to 1.
The ratio of registered sex offenders to all residents in this zip code is near the state average.
Median resident age:| This zip code: | 39.6 years |
| Maryland median age: | 39.7 years |
Average household size:| This zip code: | 2.1 people |
| Maryland: | 2.5 people |
Averages for the 2020 tax year for zip code 20712, filed in 2021:
Average Adjusted Gross Income (AGI) in 2020: $48,851 (Individual Income Tax Returns)
| Here: | $48,851 |
| State: | $86,905 |
Salary/wage: $49,399 (reported on 80.4% of returns)
| Here: | $49,399 |
| State: | $73,953 |
(% of AGI for various income ranges: 1320.8% for AGIs below $25k, 4057.4% for AGIs $25k-50k, 7631.7% for AGIs $50k-75k, 11218.1% for AGIs $75k-100k, 19860.4% for AGIs $100k-200k, 56933.3% for AGIs over 200k)
Taxable interest for individuals: $333 (reported on 18.3% of returns)
| This zip code: | $333 |
| Maryland: | $1,528 |
(% of AGI for various income ranges: 4.0% for AGIs below $25k, 2.1% for AGIs $25k-50k, 8.9% for AGIs $50k-75k, 15.7% for AGIs $75k-100k, 43.6% for AGIs $100k-200k, 103.3% for AGIs over 200k)
Ordinary dividends: $1,647 (reported on 8.0% of returns)
(% of AGI for various income ranges: 4.9% for AGIs below $25k, 4.9% for AGIs $25k-50k, 11.5% for AGIs $50k-75k, 19.0% for AGIs $75k-100k, 138.4% for AGIs $100k-200k, 196.7% for AGIs over 200k)
Net capital gain/loss in AGI: +$5,912 (reported on 7.6% of returns)
| Here: | +$5,912 |
| State: | +$25,238 |
(% of AGI for various income ranges: 2.0% for AGIs below $25k, 4.0% for AGIs $25k-50k, 27.8% for AGIs $50k-75k, 58.6% for AGIs $75k-100k, 315.6% for AGIs $100k-200k, 3040.0% for AGIs over 200k)
Profit/loss from business: +$6,382 (reported on 26.8% of returns)
| Here: | +$6,382 |
| State: | +$11,398 |
(% of AGI for various income ranges: 347.6% for AGIs below $25k, 138.0% for AGIs $25k-50k, 118.9% for AGIs $50k-75k, 251.9% for AGIs $75k-100k, 757.2% for AGIs $100k-200k)
Taxable individual retirement arrangement distribution: $11,942 (reported on 2.7% of returns)
| 20712: | $11,942 |
| Maryland: | $20,944 |
(% of AGI for various income ranges: 26.1% for AGIs below $25k, 43.7% for AGIs $50k-75k, 392.4% for AGIs $100k-200k)
Total itemized deductions: $24,505 (reported on 14.1% of returns)
| Here: | $24,505 |
| State: | $30,672 |
(% of AGI for various income ranges: 93.0% for AGIs below $25k, 250.2% for AGIs $25k-50k, 640.0% for AGIs $50k-75k, 1169.0% for AGIs $75k-100k, 2316.8% for AGIs $100k-200k, 3006.7% for AGIs over 200k)
Charity contributions: $7,502 (reported on 11.4% of returns)
(% of AGI for various income ranges: 74.1% for AGIs $25k-50k, 195.4% for AGIs $50k-75k, 281.9% for AGIs $75k-100k, 585.2% for AGIs $100k-200k, 486.7% for AGIs over 200k)
Taxes paid: $7,386 (reported on 14.1% of returns)
(% of AGI for various income ranges: 16.0% for AGIs below $25k, 52.7% for AGIs $25k-50k, 179.8% for AGIs $50k-75k, 407.1% for AGIs $75k-100k, 792.4% for AGIs $100k-200k, 1066.7% for AGIs over 200k)
Earned income credit: $2,093 (reported on 16.5% of returns)
(% of AGI for various income ranges: 107.8% for AGIs below $25k, 52.4% for AGIs $25k-50k)
Percentage of individuals using paid preparers for their 2020 taxes: 83.5%
(% for various income ranges: 78.5% for AGIs below $25k, 85.1% for AGIs $25k-50k, 86.4% for AGIs $50k-75k, 84.4% for AGIs $75k-100k, 91.1% for AGIs $100k-200k, 87.5% for AGIs over 200k)
Averages for the 2012 tax year for zip code 20712, filed in 2013:
Average Adjusted Gross Income (AGI) in 2012: $38,319 (Individual Income Tax Returns)
| Here: | $38,319 |
| State: | $72,703 |
Salary/wage: $38,909 (reported on 85.8% of returns)
| Here: | $38,909 |
| State: | $62,228 |
(% of AGI for various income ranges: 79.4% for AGIs below $25k, 91.7% for AGIs $25k-50k, 88.9% for AGIs $50k-75k, 89.5% for AGIs $75k-100k, 96.1% for AGIs $100k-200k)
Taxable interest for individuals: $346 (reported on 16.8% of returns)
| This zip code: | $346 |
| Maryland: | $1,413 |
(% of AGI for various income ranges: 0.1% for AGIs below $25k, 0.2% for AGIs $50k-75k, 0.2% for AGIs $75k-100k, 0.3% for AGIs $100k-200k)
Ordinary dividends: $1,486 (reported on 4.7% of returns)
(% of AGI for various income ranges: 0.1% for AGIs below $25k, 0.1% for AGIs $25k-50k, 0.1% for AGIs $50k-75k, 0.3% for AGIs $75k-100k, 0.4% for AGIs $100k-200k)
Net capital gain/loss in AGI: +$2,027 (reported on 3.2% of returns)
| Here: | +$2,027 |
| State: | +$14,830 |
(% of AGI for various income ranges: 0.9% for AGIs $100k-200k)
Profit/loss from business: +$5,528 (reported on 20.9% of returns)
| Here: | +$5,528 |
| State: | +$12,606 |
(% of AGI for various income ranges: 11.3% for AGIs below $25k, 1.2% for AGIs $25k-50k, 1.2% for AGIs $50k-75k, 1.4% for AGIs $75k-100k, 3.6% for AGIs $100k-200k)
Taxable individual retirement arrangement distribution: $10,608 (reported on 2.6% of returns)
| 20712: | $10,608 |
| Maryland: | $17,065 |
(% of AGI for various income ranges: 0.8% for AGIs below $25k, 0.4% for AGIs $25k-50k, 0.6% for AGIs $50k-75k, 2.1% for AGIs $100k-200k)
Total itemized deductions: $18,613 (31% of AGI, reported on 36.0% of returns)
| Here: | $18,613 |
| State: | $27,886 |
| Here: | 31.0% of AGI |
| State: | 22.8% of AGI |
(% of AGI for various income ranges: 11.3% for AGIs below $25k, 16.9% for AGIs $25k-50k, 19.1% for AGIs $50k-75k, 20.4% for AGIs $75k-100k, 22.5% for AGIs $100k-200k)
Charity contributions: $3,741 (reported on 28.9% of returns)
(% of AGI for various income ranges: 1.4% for AGIs below $25k, 2.8% for AGIs $25k-50k, 3.7% for AGIs $50k-75k, 2.9% for AGIs $75k-100k, 3.3% for AGIs $100k-200k)
Taxes paid: $5,899 (reported on 35.6% of returns)
| 20712: | $5,899 |
| State: | $11,690 |
(% of AGI for various income ranges: 2.1% for AGIs below $25k, 3.6% for AGIs $25k-50k, 5.8% for AGIs $50k-75k, 7.9% for AGIs $75k-100k, 10.4% for AGIs $100k-200k)
Earned income credit: $2,101 (reported on 20.7% of returns)
(% of AGI for various income ranges: 6.1% for AGIs below $25k, 0.9% for AGIs $25k-50k)
Percentage of individuals using paid preparers for their 2012 taxes: 55.6%
(% for various income ranges: 59.5% for AGIs below $25k, 55.0% for AGIs $25k-50k, 49.2% for AGIs $50k-75k, 50.0% for AGIs $75k-100k, 56.0% for AGIs $100k-200k)
Averages for the 2004 tax year for zip code 20712, filed in 2005:
Average Adjusted Gross Income (AGI) in 2004: $32,199 (Individual Income Tax Returns)
| Here: | $32,199 |
| State: | $60,339 |
Salary/wage: $32,022 (reported on 89.2% of returns)
| Here: | $32,022 |
| State: | $52,211 |
(% of AGI for various income ranges: 85.9% for AGIs below $10k, 86.9% for AGIs $10k-25k, 92.4% for AGIs $25k-50k, 92.2% for AGIs $50k-75k, 88.3% for AGIs $75k-100k, 71.7% for AGIs over 100k)
Taxable interest for individuals: $497 (reported on 22.5% of returns)
| This zip code: | $497 |
| Maryland: | $1,701 |
(% of AGI for various income ranges: 1.1% for AGIs below $10k, 0.4% for AGIs $10k-25k, 0.4% for AGIs $25k-50k, 0.3% for AGIs $50k-75k, 0.3% for AGIs $75k-100k, 0.2% for AGIs over 100k)
Taxable dividends: $939 (reported on 6.7% of returns)
(% of AGI for various income ranges: 0.3% for AGIs below $10k, 0.2% for AGIs $10k-25k, 0.1% for AGIs $25k-50k, 0.1% for AGIs $50k-75k, 0.4% for AGIs $75k-100k, 0.5% for AGIs over 100k)
Net capital gain/loss: +$7,085 (reported on 4.5% of returns)
| Here: | +$7,085 |
| State: | +$15,888 |
(% of AGI for various income ranges: -0.4% for AGIs below $10k, 0.1% for AGIs $10k-25k, -0.0% for AGIs $25k-50k, -0.0% for AGIs $50k-75k, 0.1% for AGIs $75k-100k, 9.7% for AGIs over 100k)
Profit/loss from business: +$4,249 (reported on 14.1% of returns)
| Here: | +$4,249 |
| State: | +$12,221 |
(% of AGI for various income ranges: 13.6% for AGIs below $10k, 4.5% for AGIs $10k-25k, 0.5% for AGIs $25k-50k, -0.1% for AGIs $50k-75k, 3.3% for AGIs $75k-100k, 2.6% for AGIs over 100k)
IRA payment deduction: $2,362 (reported on 1.7% of returns)
| 20712: | $2,362 |
| Maryland: | $2,968 |
Total itemized deductions: $15,757 (32% of AGI, reported on 37.3% of returns)
| Here: | $15,757 |
| State: | $22,960 |
| Here: | 32.2% of AGI |
| State: | 23.3% of AGI |
(% of AGI for various income ranges: 8.1% for AGIs below $10k, 13.5% for AGIs $10k-25k, 18.8% for AGIs $25k-50k, 21.4% for AGIs $50k-75k, 22.3% for AGIs $75k-100k, 16.5% for AGIs over 100k)
Charity contributions deductions: $3,557 (7% of AGI, reported on 32.3% of returns)
| Here: | 7.0% of AGI |
| State: | 3.9% of AGI |
(% of AGI for various income ranges: 0.7% for AGIs below $10k, 2.3% for AGIs $10k-25k, 3.8% for AGIs $25k-50k, 4.4% for AGIs $50k-75k, 4.3% for AGIs $75k-100k, 2.9% for AGIs over 100k)
Total tax: $3,454 (reported on 71.6% of returns)
| 20712: | $3,454 |
| State: | $10,167 |
(% of AGI for various income ranges: 3.4% for AGIs below $10k, 3.4% for AGIs $10k-25k, 6.2% for AGIs $25k-50k, 9.3% for AGIs $50k-75k, 11.1% for AGIs $75k-100k, 14.9% for AGIs over 100k)
Earned income credit: $1,740 (reported on 23.5% of returns)
Percentage of individuals using paid preparers for their 2004 taxes: 56.9%
(% for various income ranges: 50.3% for AGIs below $10k, 64.6% for AGIs $10k-25k, 56.5% for AGIs $25k-50k, 50.6% for AGIs $50k-75k, 52.4% for AGIs $75k-100k, 44.7% for AGIs over 100k)
Estimated median household income in 2022: | This zip code: | $62,395 |
| Maryland: | $94,991 |
![Mount Rainier, MD (20712) map]() Nearest zip codes: 20722
Nearest zip codes: 20722,
20018,
20781,
20782,
20017,
20064.
Mount Rainier Zip Code Map
Percentage of family households:| This zip code: | 37.2% |
| Maryland: | 45.9% |
Percentage of households with unmarried partners:| This zip code: | 4.4% |
| Maryland: | 46.5% |
No gay or lesbian households reported
Household received Food Stamps/SNAP in the past 12 months: 518
Household did not receive Food Stamps/SNAP in the past 12 months: 4,146
Women who had a birth in the past 12 months: 161 (114 now married, 47 unmarried)
Women who did not have a birth in the past 12 months: 2,467 (982 now married, 1,484 unmarried)
Housing units in zip code 20712 with a mortgage: 896 (44
second mortgage, 44
both second mortgage and home equity loan)
Median monthly owner costs for units with a mortgage: $2,169
Median monthly owner costs for units without a mortgage: $708
Residents with income below the poverty level in 2022:
| This zip code: | 7.6% |
| Whole state: | 9.6% |
| This zip code: | 2.5% |
| Whole state: | 4.7% |
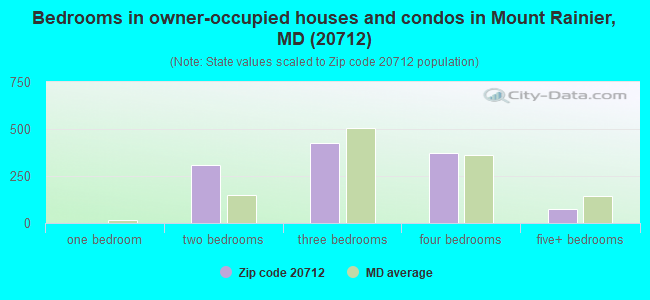
Median number of rooms in houses and condos:
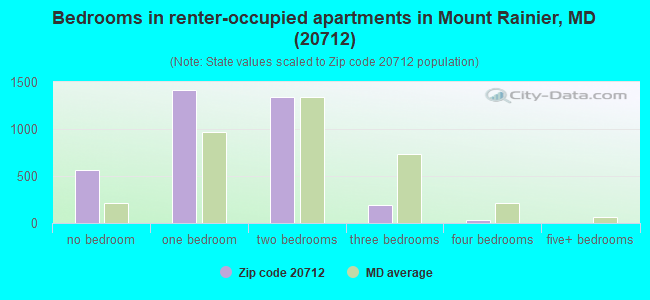
Median number of rooms in apartments:
Notable locations in this zip code not listed on our city pages
- Click to draw/clear zip code borders
Notable locations in zip code 20712: Mount Rainier Police Department (A), Mount Rainier Branch Library (B), Mount Rainier Police Station (C), Mount Rainier Fire Station Company 3 (D), Mount Rainier City Hall (E), Mount Ranier Branch Prince George's County Memorial Library (F). Display/hide their locations on the map
Churches in zip code 20712 include: Mount Rainier Christian Church (A), Mount Rainier United Methodist Church (B), Saint James Catholic Church (C), Saint Johns Episcopal Church (D), Trinity Lutheran Church (E), First Baptist Church of Mount Rainier (F). Display/hide their locations on the map
Parks in zip code 20712 include: Mount Rainier Neighborhood Park (1), Mount Rainier Historic District (2). Display/hide their locations on the map


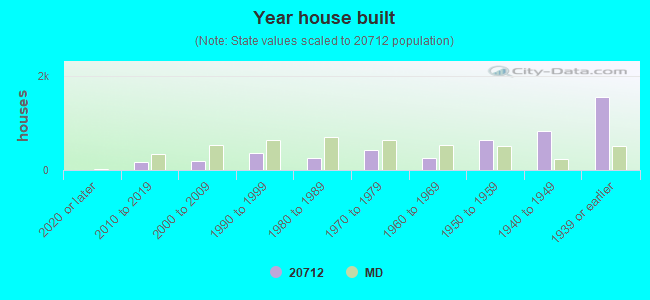
- Year house built (houses)
- 02020 or later
- 1712010 to 2019
- 1832000 to 2009
- 3621990 to 1999
- 2511980 to 1989
- 4151970 to 1979
- 2591960 to 1969
- 6261950 to 1959
- 8321940 to 1949
- 1,5391939 or earlier
![Zip code 20712 satellite photo by USGS]()
Zip code 20712 household income distribution in 2022
![Zip code 20712 household income distribution in 2022]()
- 349Less than $10,000
- 79$10,000 to $14,999
- 68$15,000 to $19,999
- 106$20,000 to $24,999
- 181$25,000 to $29,999
- 227$30,000 to $34,999
- 176$35,000 to $39,999
- 188$40,000 to $44,999
- 266$45,000 to $49,999
- 409$50,000 to $59,999
- 910$60,000 to $74,999
- 696$75,000 to $99,999
- 335$100,000 to $124,999
- 249$125,000 to $149,999
- 209$150,000 to $199,999
- 274$200,000 or more
Estimate of home value of owner-occupied houses/condos in 2022 in zip code 20712
![Estimate of home value of owner-occupied houses/condos in 2022 in zip code 20712]()
- 31$175,000 to $199,999
- 16$200,000 to $249,999
- 21$250,000 to $299,999
- 253$300,000 to $399,999
- 260$400,000 to $499,999
- 618$500,000 to $749,999
- 35$750,000 to $999,999
Rent paid by renters in 2022 in zip code 20712
![Rent paid by renters in 2022 in zip code 20712]()
- 55$650 to $699
- 36$750 to $799
- 42$800 to $899
- 49$900 to $999
- 1,181$1,000 to $1,249
- 1,452$1,250 to $1,499
- 588$1,500 to $1,999
- 62$2,000 to $2,499
- 5$2,500 to $2,999
- 54No cash rent
Median gross rent in 2022: $1,374.
Estimated median house (or condo) value in 2022 for:
- White Non-Hispanic householders: $514,948
- Black or African American householders: $524,894
- Asian householders: $634,756
- Some other race householders: $383,385
- Two or more races householders: $534,840
- Hispanic or Latino householders: $435,829
Estimated median house or condo value in 2022: $520,826
| 20712: | $520,826 |
| Maryland: | $398,100 |
$403,704 - $669,127
Mean price in 2022:
Detached houses: $480,633| Here: | $480,633 |
| State: | $526,819 |
Townhouses or other attached units: $405,853| Here: | $405,853 |
| State: | $328,305 |
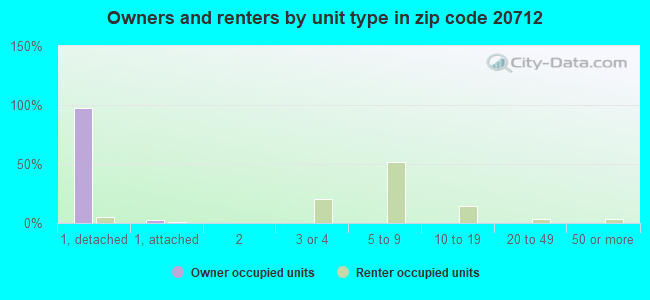
Housing units in structures:
- One, detached: 1,320
- One, attached: 58
- Two: 14
- 3 or 4: 704
- 5 to 9: 1,899
- 10 to 19: 485
- 20 to 49: 144
- 50 or more: 149
Unemployment: 4.7%
Means of transportation to work in zip code 20712
![Means of transportation to work in zip code 20712]()
- 51.0%2,765Drove a car alone
- 5.1%275Carpooled
- 6.9%372Bus or trolley bus
- 8.5%461Streetcar or trolley car
- 0.2%10Subway or elevated
- 1.2%63Taxi
- 1.0%54Bicycle
- 3.8%206Walked
- 1.0%52Other means
- 16.5%897Worked at home
Travel time to work (commute) in zip code 20712
![Travel time to work (commute) in zip code 20712]()
- 203Less than 5 minutes
- 755 to 9 minutes
- 23310 to 14 minutes
- 64315 to 19 minutes
- 49820 to 24 minutes
- 54225 to 29 minutes
- 85430 to 34 minutes
- 15835 to 39 minutes
- 20140 to 44 minutes
- 50345 to 59 minutes
- 41460 to 89 minutes
- 15790 or more minutes
Percentage of zip code residents living and working in this county: 37.7%
Household type by relationship:
Households: 9,634
- Male householders: 2,215 (1,033 living alone), Female householders: 2,454 (1,266 living alone)
1,530 spouses (1,516 opposite-sex spouses), 240 unmarried partners, (213 opposite-sex unmarried partners), 2,636 children (2,426 natural, 0 adopted, 205 stepchildren), 121 grandchildren, 83 brothers or sisters, 12 parents, 34 foster children, 170 other relatives, 161 non-relatives
- In group quarters: 21 (-1 institutionalized population)
Size of family households: 867 2-persons, 626 3-persons, 322 4-persons, 279 5-persons, 47 6-persons, 38 7-or-more-persons
Size of nonfamily households: 2,302 1-person, 195 2-persons, 16 3-persons
1,540 married couples with children.
445 single-parent households (102 men, 343 women).
51.0% of residents of 20712 zip code speak English at home.
40.8% of residents speak Spanish at home (43% very well, 20% well, 21% not well, 16% not at all).
4.3% of residents speak other Indo-European language at home (81% very well, 4% well, 16% not well).
1.3% of residents speak Asian or Pacific Island language at home (73% very well, 8% well, 19% not well).
4.3% of residents speak other language at home (70% very well, 30% well).
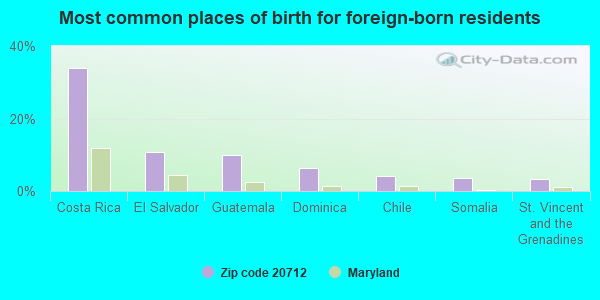
Foreign born population: 3,709 (38.5%)
(43.2%
of them are naturalized citizens)
| This zip code: | 38.5% |
| Whole state: | 16.7% |


- 34%Costa Rica
- 11%El Salvador
- 10%Guatemala
- 6%Dominica
- 4%Chile
- 4%Somalia
- 3%St. Vincent and the Grenadines

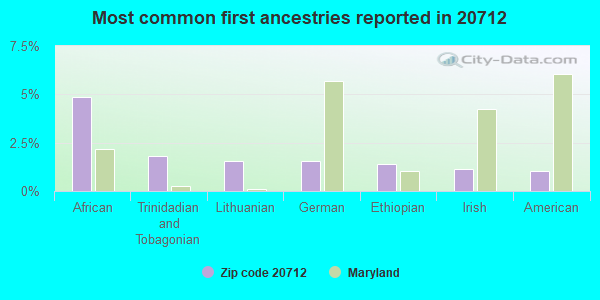
- 5%African
- 2%Trinidadian and Tobagonian
- 2%Lithuanian
- 2%German
- 1%Ethiopian
- 1%Irish
- 1%American

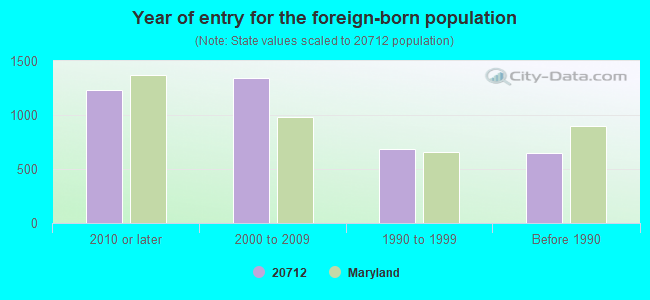
- Year of entry for the foreign-born population
- 1,2282010 or later
- 1,3442000 to 2009
- 6861990 to 1999
- 644Before 1990
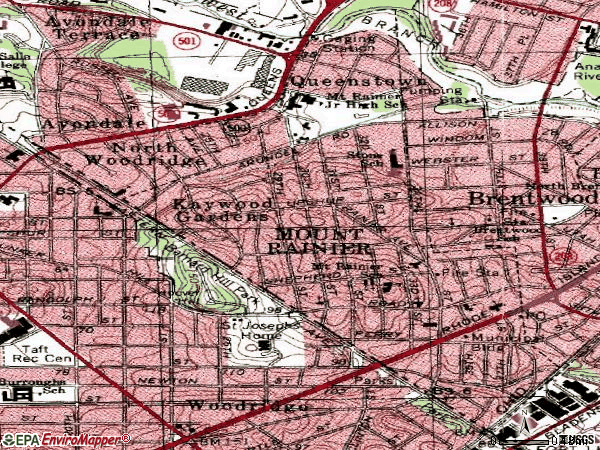
![Zip code 20712 topographic map]()
Major facilities with environmental interests located in this zip code:
- BP / AMOCO STATION # 84668 (4501 EASTERN AVENUE in MOUNT RAINIER, MD)

AIR MINOR (AIRS/AFS)
STATE MASTER (Maryland Permits tracking) - OIL CONTROL
STATE MASTER (Maryland Air Emissions Database) - AIR MINOR
National Pollutant Discharge Elimination System NON-MAJOR (Tracking pollutant discharge elimination systems) - permit
Business SIC classification: REFUSE SYSTEMS; GASOLINE SERVICE STATIONS
Alternative names: AMOCO - 4501 EASTERN AVENUE, BP - 4501 EASTERN AVENUE, BP/AMOCO #84668, REMEDIATION MANAGEMENT
- MOUNT RAINER AUTO BODY (3249 RHODE ISLAND AVENUE in MOUNT RAINIER, MD)
AIR MINOR (AIRS/AFS)
STATE MASTER (Maryland Air Emissions Database) - AIR MINOR
Small Quantity Generators, between 100 kg and 1000 kg of hazardous waste/month (Resource Conservation and Recovery Act (tracking hazardous waste)) - notification
Business SIC classification: TOP, BODY, AND UPHOLSTERY REPAIR SHOPS AND PAINT SHOPS
Organizations: OPERNAME (CONTACT/OPERATOR)
, PATTERSON, BETTY (CONTACT/OWNER)
Alternative names: MT RAINER AUTO BODY, MOUNT RAINIER AUTO BODY
- QUEENS TOWN CLEANERS (3111 CHILLUM ROAD in MOUNT RAINIER, MD)
AIR MINOR (AIRS/AFS)
STATE MASTER (Maryland Air Emissions Database) - AIR MINOR
Conditionally Exempt Small Quantity Generators, less than 100 kg/month of hazardous waste (Resource Conservation and Recovery Act (tracking hazardous waste)) - notification
Business SIC classification: DRYCLEANING PLANTS, EXCEPT RUG CLEANING
Organizations: OPERNAME (CONTACT/OPERATOR)
, PARK, SOO D (CONTACT/OWNER)
Alternative names: QUEENSTOWN CUSTOM CLEANERS
- 27TH STREET 4607 (4607 27TH STREET in MT RAINIER, MD)
AIR MINOR (AIRS/AFS)
STATE MASTER (Maryland Air Emissions Database) - AIR MINOR
Business SIC classification: OPERATORS OF APARTMENT BUILDINGS
- 28TH PLACE 4400 (4400 28TH PLACE in MT RAINIER, MD)
AIR MINOR (AIRS/AFS)
STATE MASTER (Maryland Air Emissions Database) - AIR MINOR
Business SIC classification: OPERATORS OF APARTMENT BUILDINGS
- 28TH STREET 4216 (4216 28TH STREET in MT RAINIER, MD)
AIR MINOR (AIRS/AFS)
STATE MASTER (Maryland Air Emissions Database) - AIR MINOR
Business SIC classification: OPERATORS OF APARTMENT BUILDINGS
- 29TH STREET 4608 (4608 29TH STREET in MT RAINIER, MD)
AIR MINOR (AIRS/AFS)
STATE MASTER (Maryland Air Emissions Database) - AIR MINOR
Business SIC classification: OPERATORS OF APARTMENT BUILDINGS
- 30TH STREET 4700 (4700 30TH STREET in MT RAINIER, MD)
AIR MINOR (AIRS/AFS)
STATE MASTER (Maryland Air Emissions Database) - AIR MINOR
Business SIC classification: OPERATORS OF APARTMENT BUILDINGS
- 36TH STREET 4000 04 (4000 36TH STREET in MT RAINIER, MD)
AIR MINOR (AIRS/AFS)
STATE MASTER (Maryland Air Emissions Database) - AIR MINOR
Business SIC classification: OPERATORS OF APARTMENT BUILDINGS
- ALLISON STREET 2503 (2503 ALLISON STREET in MT RAINIER, MD)
AIR MINOR (AIRS/AFS)
STATE MASTER (Maryland Air Emissions Database) - AIR MINOR
Business SIC classification: OPERATORS OF APARTMENT BUILDINGS
- ALLISON STREET 2905 (2905 ALLISON STREET in MT RAINIER, MD)
AIR MINOR (AIRS/AFS)
STATE MASTER (Maryland Air Emissions Database) - AIR MINOR
Business SIC classification: OPERATORS OF APARTMENT BUILDINGS
- ARUNDEL ROAD 2507 (2507 ARUNDEL ROAD in MT RAINIER, MD)
AIR MINOR (AIRS/AFS)
STATE MASTER (Maryland Air Emissions Database) - AIR MINOR
Business SIC classification: OPERATORS OF APARTMENT BUILDINGS
- ARUNDEL ROAD 2709 (2709 ARUNDEL ROAD in MT RAINIER, MD)
AIR MINOR (AIRS/AFS)
STATE MASTER (Maryland Air Emissions Database) - AIR MINOR
Business SIC classification: OPERATORS OF APARTMENT BUILDINGS
![Zip code 20712 marital status for males]()
![Zip code 20712 marital status for females]()
Housing units lacking complete kitchen facilities: 0.2%

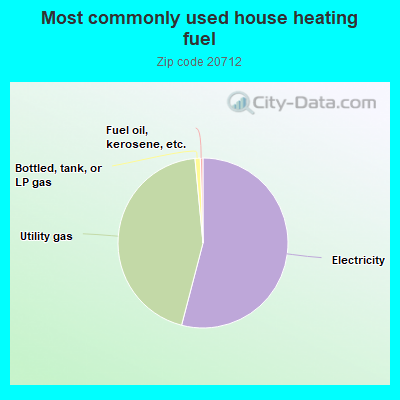
- 53.9%Electricity
- 44.3%Utility gas
- 1.0%Bottled, tank, or LP gas
- 0.5%Fuel oil, kerosene, etc.
Population in 1990: 8,422. Population change in the 1990s: +645 (+7.7%).
Place of birth for U.S.-born residents:
- This state: 1,152
- Northeast: 656
- Midwest: 425
- South: 3,208
- West: 311
49% of the 20712 zip code residents lived in the same house 5 years ago.
Out of people who lived in different houses, 41% lived in this county.
Out of people who lived in different counties, 50% lived in Maryland.
86% of the 20712 zip code residents lived in the same house 1 year ago.
Out of people who lived in different houses, 51% moved from this county.
Out of people who lived in different houses, 9% moved from different county within same state.
Out of people who lived in different houses, 33% moved from different state.
Out of people who lived in different houses, 1% moved from abroad.
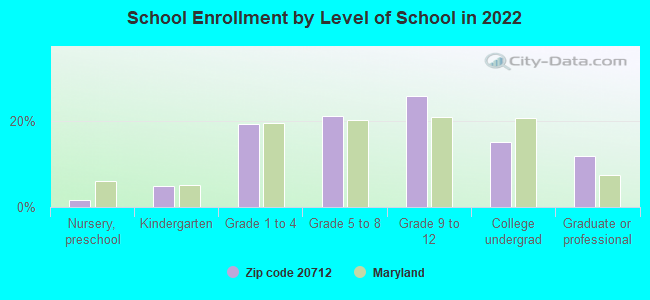
Private vs. public school enrollment:
Students in private schools in grades 1 to 8 (elementary and middle school): 39
Students in private schools in grades 9 to 12 (high school): 159
Students in private undergraduate colleges: 122

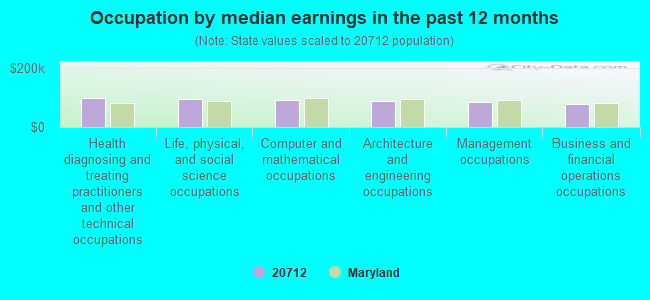
- Occupation by median earnings in the past 12 months ($)
- 98,525Health diagnosing and treating practitioners and other technical occupations
- 93,384Life, physical, and social science occupations
- 90,401Computer and mathematical occupations
- 89,362Architecture and engineering occupations
- 85,955Management occupations
- 76,475Business and financial operations occupations
Top industries in this zip code by the number of employees in 2005:
- Other Services (except Public Administration): Religious Organizations (20-49 employees: 1 establishment, 1-4 employees: 5 establishments)
- Real Estate and Rental and Leasing: Residential Property Managers (20-49: 1, 1-4: 1)
- Construction: Finish Carpentry Contractors (20-49: 1)
- Administrative and Support and Waste Management and Remediation Services: Security Guards and Patrol Services (20-49: 1)
- Construction: Residential Remodelers (10-19: 1, 5-9: 1, 1-4: 1)
- Educational Services: Elementary and Secondary Schools (10-19: 1, 1-4: 2)
- Construction: Electrical Contractors (10-19: 1, 1-4: 1)
People in group quarters in 2010:
- 15 people in other noninstitutional facilities
People in group quarters in 2000:
- 9 people in religious group quarters
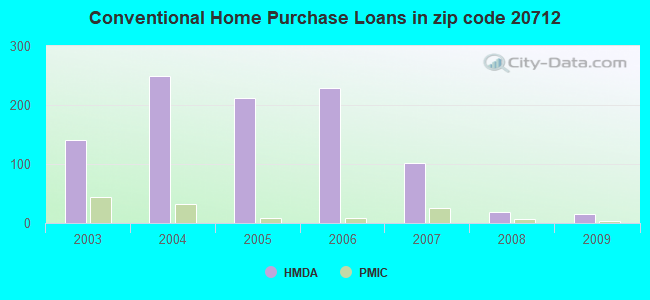
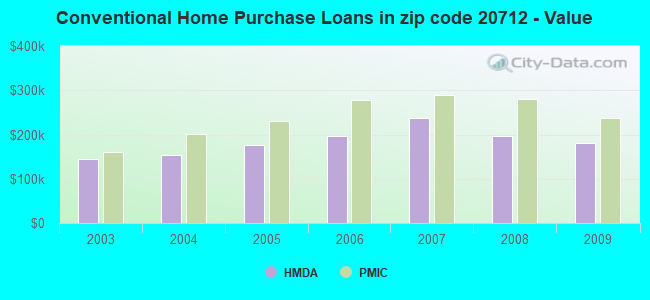
Home Mortgage Disclosure Act Aggregated Statistics For Year 2009
(Based on 2 full and 4 partial tracts)
|
| A) FHA, FSA/RHS & VA
Home Purchase Loans | B) Conventional
Home Purchase Loans | C) Refinancings
| D) Home Improvement Loans
| E) Loans on Dwellings For 5+ Families
| F) Non-occupant Loans on
< 5 Family Dwellings (A B C & D) |
|---|
| Number | Average Value | Number | Average Value | Number | Average Value | Number | Average Value | Number | Average Value | Number | Average Value |
|---|
| LOANS ORIGINATED | 47 | $222,411 | 15 | $181,272 | 113 | $207,784 | 5 | $144,696 | 2 | $10,121,100 | 1 | $113,480 |
| APPLICATIONS APPROVED, NOT ACCEPTED | 3 | $103,840 | 6 | $144,655 | 21 | $181,611 | 0 | $0 | 0 | $0 | 0 | $0 |
| APPLICATIONS DENIED | 1 | $102,970 | 6 | $177,812 | 95 | $222,178 | 9 | $135,994 | 0 | $0 | 6 | $82,572 |
| APPLICATIONS WITHDRAWN | 11 | $234,560 | 8 | $230,865 | 56 | $202,707 | 2 | $174,820 | 0 | $0 | 6 | $202,517 |
| FILES CLOSED FOR INCOMPLETENESS | 0 | $0 | 0 | $0 | 17 | $228,202 | 2 | $52,140 | 0 | $0 | 0 | $0 |
Aggregated Statistics For Year 2008
(Based on 2 full and 4 partial tracts)
|
| A) FHA, FSA/RHS & VA
Home Purchase Loans | B) Conventional
Home Purchase Loans | C) Refinancings
| D) Home Improvement Loans
| E) Loans on Dwellings For 5+ Families
| F) Non-occupant Loans on
< 5 Family Dwellings (A B C & D) |
|---|
| Number | Average Value | Number | Average Value | Number | Average Value | Number | Average Value | Number | Average Value | Number | Average Value |
|---|
| LOANS ORIGINATED | 30 | $277,781 | 19 | $195,846 | 131 | $248,147 | 27 | $92,716 | 2 | $2,242,960 | 15 | $195,999 |
| APPLICATIONS APPROVED, NOT ACCEPTED | 2 | $283,785 | 8 | $240,151 | 22 | $213,875 | 0 | $0 | 0 | $0 | 0 | $0 |
| APPLICATIONS DENIED | 9 | $301,223 | 2 | $217,040 | 101 | $279,914 | 24 | $101,441 | 0 | $0 | 6 | $239,925 |
| APPLICATIONS WITHDRAWN | 5 | $261,068 | 8 | $222,742 | 39 | $261,167 | 5 | $178,044 | 0 | $0 | 8 | $151,779 |
| FILES CLOSED FOR INCOMPLETENESS | 2 | $416,735 | 10 | $284,537 | 10 | $252,402 | 2 | $146,280 | 0 | $0 | 6 | $276,307 |
Aggregated Statistics For Year 2007
(Based on 2 full and 4 partial tracts)
|
| A) FHA, FSA/RHS & VA
Home Purchase Loans | B) Conventional
Home Purchase Loans | C) Refinancings
| D) Home Improvement Loans
| E) Loans on Dwellings For 5+ Families
| F) Non-occupant Loans on
< 5 Family Dwellings (A B C & D) | G) Loans On Manufactured
Home Dwelling (A B C & D) |
|---|
| Number | Average Value | Number | Average Value | Number | Average Value | Number | Average Value | Number | Average Value | Number | Average Value | Number | Average Value |
|---|
| LOANS ORIGINATED | 4 | $296,162 | 102 | $237,773 | 281 | $214,773 | 35 | $143,487 | 4 | $500,838 | 31 | $205,229 | 0 | $0 |
| APPLICATIONS APPROVED, NOT ACCEPTED | 0 | $0 | 6 | $349,402 | 72 | $218,337 | 13 | $67,301 | 0 | $0 | 2 | $140,900 | 0 | $0 |
| APPLICATIONS DENIED | 0 | $0 | 42 | $240,277 | 217 | $226,046 | 40 | $169,978 | 0 | $0 | 29 | $230,959 | 2 | $79,130 |
| APPLICATIONS WITHDRAWN | 2 | $277,930 | 26 | $215,218 | 100 | $224,784 | 12 | $127,772 | 0 | $0 | 18 | $196,152 | 0 | $0 |
| FILES CLOSED FOR INCOMPLETENESS | 0 | $0 | 8 | $206,749 | 37 | $227,252 | 0 | $0 | 0 | $0 | 4 | $275,002 | 0 | $0 |
Aggregated Statistics For Year 2006
(Based on 2 full and 4 partial tracts)
|
| A) FHA, FSA/RHS & VA
Home Purchase Loans | B) Conventional
Home Purchase Loans | C) Refinancings
| D) Home Improvement Loans
| E) Loans on Dwellings For 5+ Families
| F) Non-occupant Loans on
< 5 Family Dwellings (A B C & D) |
|---|
| Number | Average Value | Number | Average Value | Number | Average Value | Number | Average Value | Number | Average Value | Number | Average Value |
|---|
| LOANS ORIGINATED | 2 | $189,190 | 228 | $195,515 | 353 | $215,062 | 68 | $174,151 | 4 | $712,382 | 52 | $220,952 |
| APPLICATIONS APPROVED, NOT ACCEPTED | 0 | $0 | 23 | $144,921 | 45 | $225,713 | 6 | $63,387 | 0 | $0 | 5 | $211,256 |
| APPLICATIONS DENIED | 0 | $0 | 89 | $192,835 | 167 | $219,570 | 35 | $125,851 | 4 | $901,085 | 17 | $201,049 |
| APPLICATIONS WITHDRAWN | 0 | $0 | 39 | $201,189 | 108 | $199,712 | 6 | $154,532 | 0 | $0 | 10 | $260,984 |
| FILES CLOSED FOR INCOMPLETENESS | 0 | $0 | 21 | $239,899 | 59 | $216,179 | 2 | $97,520 | 0 | $0 | 2 | $156,030 |
Aggregated Statistics For Year 2005
(Based on 2 full and 4 partial tracts)
|
| A) FHA, FSA/RHS & VA
Home Purchase Loans | B) Conventional
Home Purchase Loans | C) Refinancings
| D) Home Improvement Loans
| E) Loans on Dwellings For 5+ Families
| F) Non-occupant Loans on
< 5 Family Dwellings (A B C & D) | G) Loans On Manufactured
Home Dwelling (A B C & D) |
|---|
| Number | Average Value | Number | Average Value | Number | Average Value | Number | Average Value | Number | Average Value | Number | Average Value | Number | Average Value |
|---|
| LOANS ORIGINATED | 8 | $276,225 | 212 | $176,512 | 447 | $189,752 | 47 | $154,269 | 2 | $224,295 | 61 | $186,674 | 0 | $0 |
| APPLICATIONS APPROVED, NOT ACCEPTED | 0 | $0 | 23 | $200,558 | 71 | $175,741 | 3 | $83,070 | 0 | $0 | 5 | $112,686 | 0 | $0 |
| APPLICATIONS DENIED | 0 | $0 | 68 | $157,818 | 169 | $189,177 | 49 | $74,913 | 2 | $1,143,910 | 24 | $178,475 | 2 | $125,800 |
| APPLICATIONS WITHDRAWN | 2 | $145,305 | 37 | $133,764 | 163 | $173,380 | 7 | $208,253 | 0 | $0 | 6 | $186,447 | 0 | $0 |
| FILES CLOSED FOR INCOMPLETENESS | 0 | $0 | 2 | $230,910 | 30 | $179,384 | 0 | $0 | 0 | $0 | 8 | $166,515 | 0 | $0 |
Aggregated Statistics For Year 2004
(Based on 2 full and 4 partial tracts)
|
| A) FHA, FSA/RHS & VA
Home Purchase Loans | B) Conventional
Home Purchase Loans | C) Refinancings
| D) Home Improvement Loans
| E) Loans on Dwellings For 5+ Families
| F) Non-occupant Loans on
< 5 Family Dwellings (A B C & D) |
|---|
| Number | Average Value | Number | Average Value | Number | Average Value | Number | Average Value | Number | Average Value | Number | Average Value |
|---|
| LOANS ORIGINATED | 10 | $219,393 | 250 | $153,306 | 366 | $149,055 | 42 | $100,595 | 4 | $945,945 | 55 | $139,081 |
| APPLICATIONS APPROVED, NOT ACCEPTED | 0 | $0 | 42 | $136,843 | 71 | $141,011 | 11 | $63,888 | 0 | $0 | 10 | $110,118 |
| APPLICATIONS DENIED | 0 | $0 | 53 | $193,979 | 192 | $147,937 | 52 | $83,583 | 0 | $0 | 16 | $142,662 |
| APPLICATIONS WITHDRAWN | 0 | $0 | 30 | $156,465 | 188 | $150,532 | 18 | $105,602 | 0 | $0 | 12 | $76,407 |
| FILES CLOSED FOR INCOMPLETENESS | 0 | $0 | 18 | $168,419 | 45 | $151,815 | 6 | $133,277 | 0 | $0 | 2 | $119,950 |
Aggregated Statistics For Year 2003
(Based on 2 full and 4 partial tracts)
|
| A) FHA, FSA/RHS & VA
Home Purchase Loans | B) Conventional
Home Purchase Loans | C) Refinancings
| D) Home Improvement Loans
| E) Loans on Dwellings For 5+ Families
| F) Non-occupant Loans on
< 5 Family Dwellings (A B C & D) |
|---|
| Number | Average Value | Number | Average Value | Number | Average Value | Number | Average Value | Number | Average Value | Number | Average Value |
|---|
| LOANS ORIGINATED | 45 | $163,484 | 141 | $144,076 | 455 | $113,530 | 17 | $12,314 | 2 | $575,065 | 22 | $107,219 |
| APPLICATIONS APPROVED, NOT ACCEPTED | 4 | $142,868 | 18 | $142,749 | 96 | $107,858 | 5 | $9,634 | 0 | $0 | 10 | $109,808 |
| APPLICATIONS DENIED | 4 | $200,890 | 26 | $113,373 | 180 | $108,952 | 28 | $16,644 | 0 | $0 | 10 | $141,284 |
| APPLICATIONS WITHDRAWN | 4 | $169,840 | 28 | $134,794 | 153 | $127,159 | 4 | $10,640 | 2 | $429,090 | 12 | $137,255 |
| FILES CLOSED FOR INCOMPLETENESS | 2 | $189,190 | 2 | $87,770 | 33 | $119,642 | 0 | $0 | 0 | $0 | 0 | $0 |
,
8048.00,
8049.00
Private Mortgage Insurance Companies Aggregated Statistics For Year 2009
(Based on 2 full and 4 partial tracts)
|
| A) Conventional
Home Purchase Loans | B) Refinancings
|
|---|
| Number | Average Value | Number | Average Value |
|---|
| LOANS ORIGINATED | 4 | $236,878 | 3 | $198,367 |
| APPLICATIONS APPROVED, NOT ACCEPTED | 6 | $316,940 | 0 | $0 |
| APPLICATIONS DENIED | 0 | $0 | 0 | $0 |
| APPLICATIONS WITHDRAWN | 0 | $0 | 0 | $0 |
| FILES CLOSED FOR INCOMPLETENESS | 0 | $0 | 0 | $0 |
Aggregated Statistics For Year 2008
(Based on 2 full and 2 partial tracts)
|
| A) Conventional
Home Purchase Loans | B) Refinancings
| C) Non-occupant Loans on
< 5 Family Dwellings (A & B) |
|---|
| Number | Average Value | Number | Average Value | Number | Average Value |
|---|
| LOANS ORIGINATED | 6 | $280,217 | 10 | $316,708 | 0 | $0 |
| APPLICATIONS APPROVED, NOT ACCEPTED | 9 | $307,051 | 3 | $444,350 | 0 | $0 |
| APPLICATIONS DENIED | 0 | $0 | 2 | $402,760 | 2 | $402,760 |
| APPLICATIONS WITHDRAWN | 0 | $0 | 0 | $0 | 0 | $0 |
| FILES CLOSED FOR INCOMPLETENESS | 2 | $272,080 | 0 | $0 | 0 | $0 |
Aggregated Statistics For Year 2007
(Based on 2 full and 4 partial tracts)
|
| A) Conventional
Home Purchase Loans | B) Refinancings
| C) Non-occupant Loans on
< 5 Family Dwellings (A & B) |
|---|
| Number | Average Value | Number | Average Value | Number | Average Value |
|---|
| LOANS ORIGINATED | 26 | $288,940 | 19 | $304,887 | 2 | $224,295 |
| APPLICATIONS APPROVED, NOT ACCEPTED | 2 | $253,030 | 2 | $401,780 | 0 | $0 |
| APPLICATIONS DENIED | 0 | $0 | 0 | $0 | 0 | $0 |
| APPLICATIONS WITHDRAWN | 2 | $346,075 | 4 | $295,972 | 0 | $0 |
| FILES CLOSED FOR INCOMPLETENESS | 0 | $0 | 0 | $0 | 0 | $0 |
Aggregated Statistics For Year 2006
(Based on 2 full and 2 partial tracts)
|
| A) Conventional
Home Purchase Loans | B) Refinancings
|
|---|
| Number | Average Value | Number | Average Value |
|---|
| LOANS ORIGINATED | 8 | $277,689 | 2 | $229,170 |
| APPLICATIONS APPROVED, NOT ACCEPTED | 2 | $291,825 | 2 | $374,350 |
| APPLICATIONS DENIED | 0 | $0 | 0 | $0 |
| APPLICATIONS WITHDRAWN | 2 | $406,660 | 0 | $0 |
| FILES CLOSED FOR INCOMPLETENESS | 0 | $0 | 0 | $0 |
Aggregated Statistics For Year 2005
(Based on 2 full and 4 partial tracts)
|
| A) Conventional
Home Purchase Loans | B) Refinancings
| C) Non-occupant Loans on
< 5 Family Dwellings (A & B) |
|---|
| Number | Average Value | Number | Average Value | Number | Average Value |
|---|
| LOANS ORIGINATED | 8 | $231,051 | 9 | $204,897 | 6 | $192,805 |
| APPLICATIONS APPROVED, NOT ACCEPTED | 2 | $12,680 | 10 | $196,210 | 0 | $0 |
| APPLICATIONS DENIED | 0 | $0 | 0 | $0 | 0 | $0 |
| APPLICATIONS WITHDRAWN | 0 | $0 | 0 | $0 | 0 | $0 |
| FILES CLOSED FOR INCOMPLETENESS | 0 | $0 | 0 | $0 | 0 | $0 |
Aggregated Statistics For Year 2004
(Based on 2 full and 2 partial tracts)
|
| A) Conventional
Home Purchase Loans | B) Refinancings
| C) Non-occupant Loans on
< 5 Family Dwellings (A & B) |
|---|
| Number | Average Value | Number | Average Value | Number | Average Value |
|---|
| LOANS ORIGINATED | 33 | $201,612 | 12 | $176,692 | 2 | $112,150 |
| APPLICATIONS APPROVED, NOT ACCEPTED | 2 | $130,675 | 13 | $146,000 | 0 | $0 |
| APPLICATIONS DENIED | 2 | $265,120 | 0 | $0 | 0 | $0 |
| APPLICATIONS WITHDRAWN | 0 | $0 | 5 | $133,750 | 0 | $0 |
| FILES CLOSED FOR INCOMPLETENESS | 0 | $0 | 0 | $0 | 0 | $0 |
Aggregated Statistics For Year 2003
(Based on 2 full and 4 partial tracts)
|
| A) Conventional
Home Purchase Loans | B) Refinancings
| C) Non-occupant Loans on
< 5 Family Dwellings (A & B) |
|---|
| Number | Average Value | Number | Average Value | Number | Average Value |
|---|
| LOANS ORIGINATED | 44 | $160,309 | 32 | $148,396 | 6 | $118,000 |
| APPLICATIONS APPROVED, NOT ACCEPTED | 10 | $124,045 | 7 | $136,799 | 2 | $115,075 |
| APPLICATIONS DENIED | 0 | $0 | 0 | $0 | 0 | $0 |
| APPLICATIONS WITHDRAWN | 0 | $0 | 0 | $0 | 0 | $0 |
| FILES CLOSED FOR INCOMPLETENESS | 0 | $0 | 0 | $0 | 0 | $0 |
,
8048.00,
8049.00
| Most common first names in zip code 20712 among deceased individuals |
| Name | Count | Lived (average) |
|---|
| James | 33 | 67.6 years |
| William | 31 | 71.4 years |
| Mary | 31 | 78.3 years |
| John | 25 | 74.6 years |
| Charles | 20 | 69.8 years |
| Robert | 15 | 71.3 years |
| Helen | 14 | 78.5 years |
| George | 14 | 69.1 years |
| Thomas | 13 | 76.7 years |
| Mildred | 12 | 77.7 years |
| Most common last names in zip code 20712 among deceased individuals |
| Last name | Count | Lived (average) |
|---|
| Williams | 16 | 78.8 years |
| Smith | 13 | 73.2 years |
| Brown | 12 | 64.7 years |
| Carter | 8 | 73.2 years |
| White | 8 | 74.7 years |
| Thompson | 8 | 71.6 years |
| Jones | 7 | 61.6 years |
| Howard | 7 | 79.7 years |
| Davis | 7 | 57.3 years |
| Bell | 6 | 80.8 years |
| Businesses in zip code 20712 |
| Name | Count | | Name | Count |
| 7-Eleven | 3 | | Penske | 1 |
| Advance Auto Parts | 1 | | U-Haul | 1 |