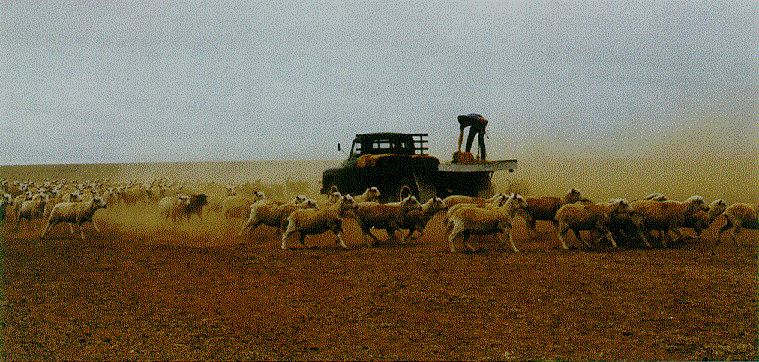
Drought is ... ?
A drought is a prolonged, abnormally dry period when there is not enough
water for users' normal needs. Drought is not simply low rainfall; if
it was, much of inland Australia would be in almost perpetual drought.
Because people use water in so many different ways, there is no universal
definition of drought.
Meteorologists monitor the extent and severity of drought in terms of
rainfall deficiencies. Agriculturalists rate the impact on primary industries,
hydrologists compare ground water levels, and sociologists define it on
social expectations and perceptions.
Drought's impacts
During climate extremes, whether droughts or flooding rains, those on
the land feel it most. Agriculture suffers first and most severely - yet
eventually everyone feels the impact.
Drought disrupts cropping programs, reduces breeding stock, and threatens
permanent erosion of the capital and resource base of farming enterprises.
Declining productivity affects rural Australia and the national economy.
The risk of serious environmental damage, particularly through vegetation
loss and soil erosion, has long term implications for the sustainability
of our agricultural industries. Water quality suffers, and toxic algae
outbreaks may occur; plants and animals are also threatened. Bushfires
and duststorms often increase during dry times.
Its causes?
Australia has one of the most variable rainfall climates in the world.
Over the long term we have about three good years and three bad years
out of ten. These fluctuations have many causes, but the strongest is
the climate phenomenon called the Southern Oscillation. This is a major
air pressure shift between the Asian and east Pacific regions - its best-known
extreme is El Niño.
In recent years, the Bureau of Meteorology's greater understanding of
El Niño has improved its ability to predict seasonal rainfall and
help authorities and individuals with early drought warnings. More information
is in the Bureau's brochure
Climate Variability
and El Niño,
or on the World Wide Web at
http://www.bom.gov.au/ .
 Photograph courtesy of the Department of Foreign Affairs and Trade.
Managing drought
The Bureau's Drought Watch Service has been a key component of national
drought management since 1965. It is based on a nationwide daily rainfall
measuring network and established relationships between rainfall deficiency
and the severity of recorded drought. Its rainfall information assists
government, business and the rural community. It also helps to assess
the current situation, providing early indication of the need for contingency
action or drought relief. Since the implementation of Commonwealth Government
'National Drought Policy' initiatives in 1992, the Bureau has expanded
its rainfall analysis services. Many of the new products are available
through 'Weather by Fax', the World Wide Web or Bureau offices.
Using monthly rainfall analysis, areas suffering from rainfall deficiencies
appear in the Drought Statement as well as the publication Monthly
Drought Review. If the accumulated rainfall over three successive
months was within the lowest 10 per cent on record, a Drought Watch is
commenced and the region is highlighted. This initial dry period stretches
to six months for arid regions. Consideration is also given to whether
an area is usually dry at that time of the year. There are two rainfall
deficiency categories:
A severe rainfall deficiency exists in a district when rainfall
for three months or more is in the lowest 5 per cent of records (see graph
below - orange section).
A serious deficiency lies in the next lowest 5 per cent i.e.
lowest 5 per cent to 10 per cent of historical records for a three month
or longer period (yellow section in graph below).
Allowing for seasonal conditions, the Drought Watch may continue for many
months and ceases when plentiful rainfall returns. 'Plentiful' is defined
as well above average rainfall for one month, or above-average rainfall
over a three-month period.
The Drought Watch Service provides a consistent starting point for national
drought alerts. Drought declarations take account of other factors in
addition to rainfall and are the responsibility of the State Governments.
Types of drought
For Australian conditions, drought frequency is crucial. Research indicates
that severe drought affects some part of Australia about once every 18
years. This does not indicate that severe drought regularly and predictably
recurs every 18 years; intervals between severe droughts have varied from
four to 38 years. We have long historical rainfall records to give a clearer
picture of what is 'normal' for an area, and how much variation might
be expected.
There is little chance that all Australia could be in drought at the same
time. Some droughts are long-lived; some are short and intense, causing
significant damage. Some can be localised while other parts of the country
enjoy bountiful rain. Some regional droughts are not related to El Niño
events, and are therefore harder to forecast. Examples of each of these
types of drought are shown in the large picture below.
Global monitoring
Meteorologists need up-to-date information on global climate patterns
for early warning and monitoring of drought. Under the umbrella of the
World Meteorological Organization (WMO), the Bureau participates in and
contributes to international weather and climate watch programs. The WMO's
new Climate Information and Prediction Services (CLIPS) project is designed
to enable member nations to make the most of new abilities to monitor
and predict seasonal climate variations.
|