Silver Spring, MD (Maryland) Houses and Residents
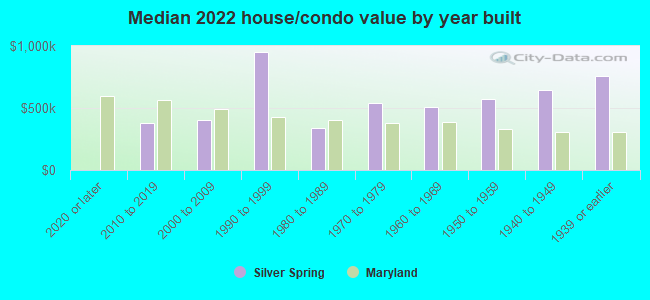
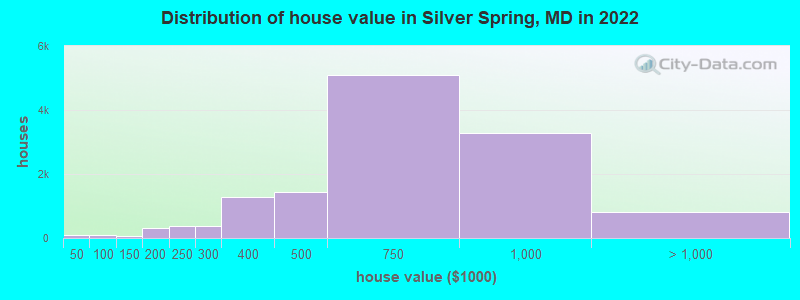
Estimated median house or condo value in 2022: $619,300 (it was $183,300 in 2000 )
Silver Spring:
$619,300Maryland:
$398,100
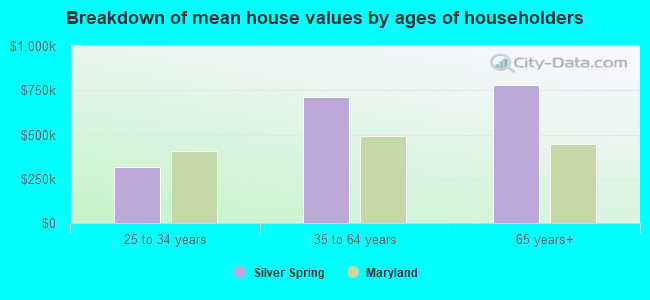
Lower value quartile - upper value quartile: $409,000 - $848,600Mean price in 2022: Detached houses: $797,859 Here:
$797,859State:
$526,819
Townhouses or other attached units: $645,480 Here:
$645,480State:
$328,305
In 3-to-4-unit structures: $226,142 Here:
$226,142State:
$295,378
In 5-or-more-unit structures: $417,883 Here:
$417,883State:
$350,378
Total population: 71,452 (All urban)
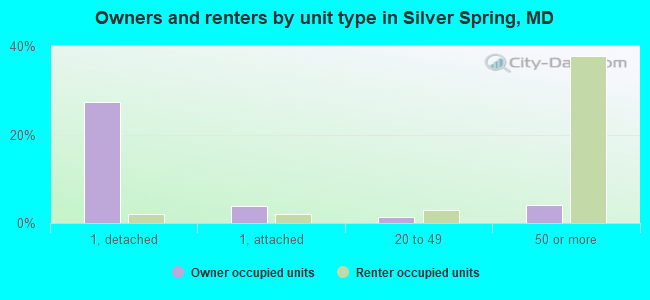
Houses: 35,441 (34,709 occupied: 13,129 owner occupied, 21,580 renter occupied )
% of renters here:
62%State:
32%
Housing density: 3,762 houses/condos per square mile
Median price asked for vacant for-sale houses and condos in 2022 in this county: $868,821.
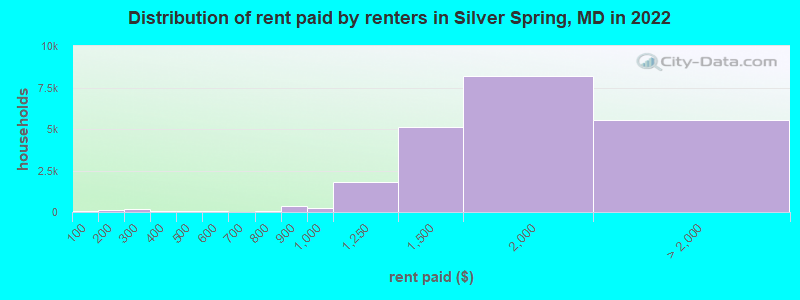
Median contract rent in 2022: $1,620 (lower quartile is $1,343, upper quartile is $1,912)
Median rent asked for vacant for-rent units in 2022: $1,609
Median gross rent in Silver Spring, MD in 2022: $1,667
Housing units in Silver Spring with a mortgage: 10,202 (761 second mortgage, 0 home equity loan, 582 both second mortgage and home equity loan )Houses without a mortgage: 0
Median household income for houses/condos with a mortgage: $178,702
Median household income for apartments without a mortgage: $111,800
Median monthly housing costs: $1,712
Data:
Median house or condo value ($)
Median house or condo value ($ change since 2000)
Median house or condo value ($) - White
Median house or condo value ($) - Black or African American
Median house or condo value ($) - Asian
Median house or condo value ($) - Hispanic or Latino
Median house or condo value ($) - American Indian and Alaska Native
Median house or condo value ($) - Multirace
Median house or condo value ($) - Other Race
Median price asked for mobile homes ($)
Household density (households per square mile)
Mean house or condo value by units in structure - 1, detached ($)
Mean house or condo value by units in structure - 1, attached ($)
Mean house or condo value by units in structure - 2 ($)
Mean house or condo value by units in structure by units in structure - 3 or 4 ($)
Mean house or condo value by units in structure - 5 or more ($)
Mean house or condo value by units in structure - Boat, RV, van, etc. ($)
Mean house or condo value by units in structure - Mobile home ($)
Median contract rent ($)
Median contract rent - Lower quartile ($)
Median contract rent - Upper quartile ($)
Median gross rent ($)
Urban houses (%)
Rural houses (%)
Houses occupied (%)
Houses occupied (% change since 2000)
Houses owner occupied (%)
Houses owner occupied (% change since 2000)
Houses renter occupied (%)
Houses renter occupied (% change since 2000)
Vacant housing units - For rent (%)
Vacant housing units - For rent (% change since 2000)
Vacant housing units - For sale only (%)
Vacant housing units - For sale only (% change since 2000)
Vacant housing units - Rented or sold, not occupied (%)
Vacant housing units - Rented or sold, not occupied (% change since 2000)
Vacant housing units - For seasonal, recreational, or occasional use (%)
Vacant housing units - For seasonal, recreational, or occasional use (% change since 2000)
Vacant housing units - For migrant workers (%)
Vacant housing units - For migrant workers (% change since 2000)
Vacant housing units - Other vacant (%)
Vacant housing units - Other vacant (% change since 2000)
Median monthly housing costs ($)
Median household income for houses/condos with a mortgage ($)
Median household income for houses/condos without a mortgage ($)
Median household income ($)
Median household income ($) - White
Median household income ($) - Black or African American
Median household income ($) - Asian
Median household income ($) - Hispanic or Latino
Median household income ($) - American Indian and Alaska Native
Median household income ($) - Multirace
Median household income ($) - Other Race
Mortgage status - with mortgage (%)
Mortgage status - with second mortgage (%)
Mortgage status - with home equity loan (%)
Mortgage status - with both second mortgage and home equity loan (%)
Mortgage status - without a mortgage (%)
Median year house/condo built
Median year apartment built
Household type by relationship - Male householder living alone (%)
Household type by relationship - Male householder not living alone (%)
Household type by relationship - Female householder living alone (%)
Household type by relationship - Female householder not living alone (%)
Household type by relationship - Opposite-Sex spouse (%)
Household type by relationship - Same-Sex spouse (%)
Household type by relationship - Opposite-Sex unmarried partner (%)
Household type by relationship - Same-Sex unmarried partner (%)
Household type by relationship - In group quarters (%)
Size of family households - 2-person household (%)
Size of family households - 3-person household (%)
Size of family households - 4-person household (%)
Size of family households - 5-person household (%)
Size of family households - 6-person household (%)
Size of family households - 7-or-more-person household (%)
Size of nonfamily households - 1-person household (%)
Size of nonfamily households - 2-person household (%)
Size of nonfamily households - 3-person household (%)
Size of nonfamily households - 4-person household (%)
Size of nonfamily households - 5-person household (%)
Size of nonfamily households - 6-person household (%)
Size of nonfamily households - 7-or-moreperson household (%)
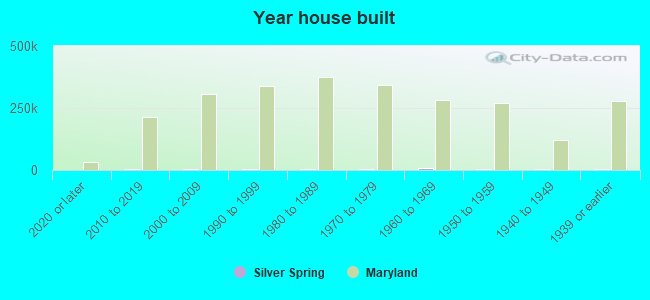
Year house built - Built 2010 or later (%)
Year house built - Built 2000 to 2009 (%)
Year house built - Built 1990 to 1999 (%)
Year house built - Built 1980 to 1989 (%)
Year house built - Built 1970 to 1979 (%)
Year house built - Built 1960 to 1969 (%)
Year house built - Built 1950 to 1959 (%)
Year house built - Built 1940 to 1949 (%)
Year house built - Built 1939 or earlier (%)
Median number of rooms in houses and condos
Median number of rooms in apartments
Median number of bedrooms in owner occupied houses
Mean number of bedrooms in owner occupied houses
Median number of bedrooms in renter occupied houses
Mean number of bedrooms in renter occupied houses
Median number of vehichles in owner occupied houses
Mean number of vehichles in owner occupied houses
Median number of vehichles in renter occupied houses
Mean number of vehichles in renter occupied houses
Rooms in owner-occupied houses - 1 room (%)
Rooms in owner-occupied houses - 2 rooms (%)
Rooms in owner-occupied houses - 3 rooms (%)
Rooms in owner-occupied houses - 4 rooms (%)
Rooms in owner-occupied houses - 5 rooms (%)
Rooms in owner-occupied houses - 6 rooms (%)
Rooms in owner-occupied houses - 7 rooms (%)
Rooms in owner-occupied houses - 8 rooms (%)
Rooms in owner-occupied houses - 9+ rooms (%)
Rooms in renter-occupied houses - 1 room (%)
Rooms in renter-occupied houses - 2 rooms (%)
Rooms in renter-occupied houses - 3 rooms (%)
Rooms in renter-occupied houses - 4 rooms (%)
Rooms in renter-occupied houses - 5 rooms (%)
Rooms in renter-occupied houses - 6 rooms (%)
Rooms in renter-occupied houses - 7 rooms (%)
Rooms in renter-occupied houses - 8 rooms (%)
Rooms in renter-occupied houses - 9+ rooms (%)
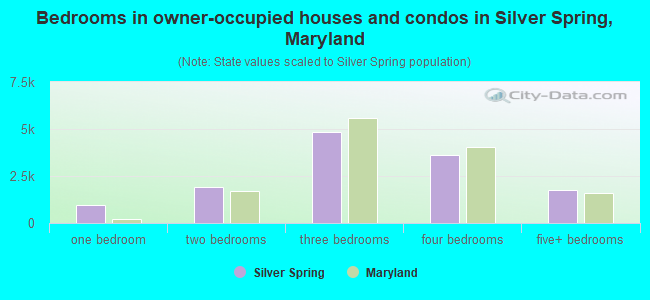
Bedrooms in owner-occupied houses - no bedrooms (%)
Bedrooms in owner-occupied houses - 1 bedroom (%)
Bedrooms in owner-occupied houses - 2 bedrooms (%)
Bedrooms in owner-occupied houses - 3 bedrooms (%)
Bedrooms in owner-occupied houses - 4 bedrooms (%)
Bedrooms in owner-occupied houses - 5+ bedrooms (%)
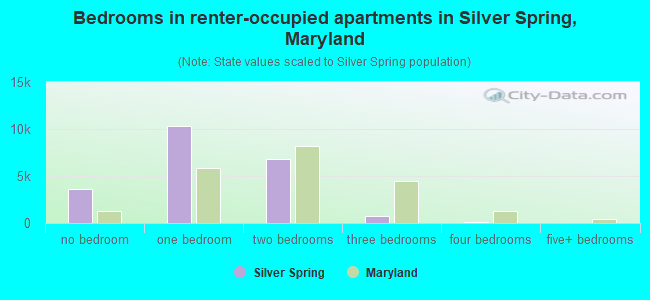
Bedrooms in renter-occupied houses - no bedrooms (%)
Bedrooms in renter-occupied houses - 1 bedroom (%)
Bedrooms in renter-occupied houses - 2 bedrooms (%)
Bedrooms in renter-occupied houses - 3 bedrooms (%)
Bedrooms in renter-occupied houses - 4 bedrooms (%)
Bedrooms in renter-occupied houses - 5+ bedrooms (%)
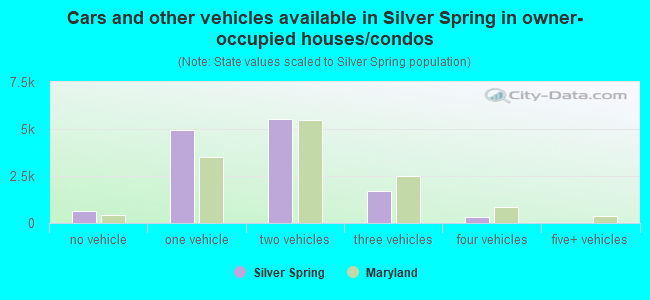
Vehicles available in owner-occupied houses - no vehicle available (%)
Vehicles available in owner-occupied houses - 1 vehicle available(%)
Vehicles available in owner-occupied houses - 2 Vehicles available (%)
Vehicles available in owner-occupied houses - 3 Vehicles available (%)
Vehicles available in owner-occupied houses - 4 Vehicles available (%)
Vehicles available in owner-occupied houses - 5+ Vehicles available (%)
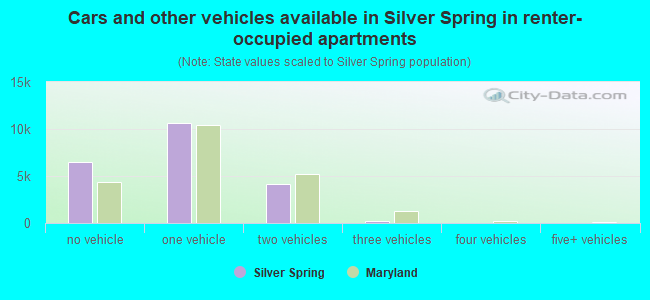
Vehicles available in renter-occupied houses - no vehicle available (%)
Vehicles available in renter-occupied houses - 1 vehicle available (%)
Vehicles available in renter-occupied houses - 2 Vehicles available (%)
Vehicles available in renter-occupied houses - 3 Vehicles available (%)
Vehicles available in renter-occupied houses - 4 Vehicles available (%)
Vehicles available in renter-occupied houses - 5+ Vehicles available (%)
Housing units in structures - 1, detached (%)
Housing units in structures - 1, attached (%)
Housing units in structures - 2 (%)
Housing units in structures - 3 or 4 (%)
Housing units in structures - 5 to 9 (%)
Housing units in structures - 10 to 19 (%)
Housing units in structures - 20 to 49 (%)
Housing units in structures - 50 or more (%)
Housing units in structures - Mobile home (%)
Housing units in structures - Boat, RV, van, etc. (%)
Housing units in structures - Owners - 1, detached (%)
Housing units in structures - Owners - 1, attached (%)
Housing units in structures - Owners - 2 (%)
Housing units in structures - Owners - 3 or 4 (%)
Housing units in structures - Owners - 5 to 9 (%)
Housing units in structures - Owners - 10 to 19 (%)
Housing units in structures - Owners - 20 to 49 (%)
Housing units in structures - Owners - 50 or more (%)
Housing units in structures - Owners - Mobile home (%)
Housing units in structures - Owners - Boat, RV, van, etc. (%)
Housing units in structures - Renters - 1, detached (%)
Housing units in structures - Renters - 1, attached (%)
Housing units in structures - Renters - 2 (%)
Housing units in structures - Renters - 3 or 4 (%)
Housing units in structures - Renters - 5 to 9 (%)
Housing units in structures - Renters - 10 to 19 (%)
Housing units in structures - Renters - 20 to 49 (%)
Housing units in structures - Renters - 50 or more (%)
Housing units in structures - Renters - Mobile home (%)
Housing units in structures - Renters - Boat, RV, van, etc. (%)
House/condo owner moved in on average (years ago)
Renter moved in on average (years ago)
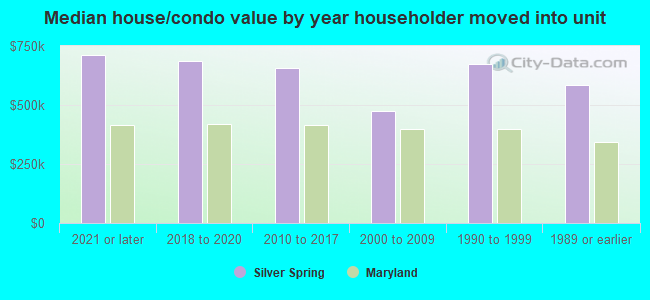
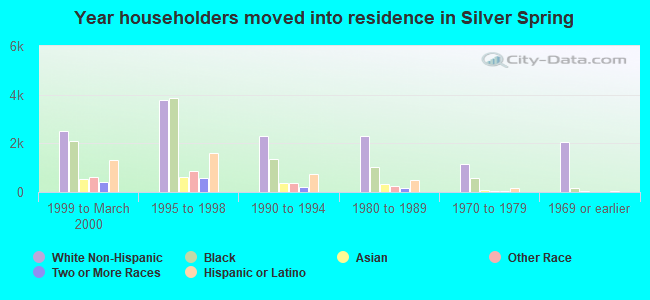
Year householder moved into unit - Moved in 1999 to March 2000 (%)
Year householder moved into unit - Moved in 1999 to March 2000 (%) - White
Year householder moved into unit - Moved in 1999 to March 2000 (%) - Black or African American
Year householder moved into unit - Moved in 1999 to March 2000 (%) - Asian
Year householder moved into unit - Moved in 1999 to March 2000 (%) - Hispanic or Latino
Year householder moved into unit - Moved in 1999 to March 2000 (%) - American Indian and Alaska Native
Year householder moved into unit - Moved in 1999 to March 2000 (%) - Multirace
Year householder moved into unit - Moved in 1999 to March 2000 (%) - Other Race
Year householder moved into unit - Moved in 1995 to 1998 (%)
Year householder moved into unit - Moved in 1995 to 1998 (%) - White
Year householder moved into unit - Moved in 1995 to 1998 (%) - Black or African American
Year householder moved into unit - Moved in 1995 to 1998 (%) - Asian
Year householder moved into unit - Moved in 1995 to 1998 (%) - Hispanic or Latino
Year householder moved into unit - Moved in 1995 to 1998 (%) - American Indian and Alaska Native
Year householder moved into unit - Moved in 1995 to 1998 (%) - Multirace
Year householder moved into unit - Moved in 1995 to 1998 (%) - Other Race
Year householder moved into unit - Moved in 1990 to 1994 (%)
Year householder moved into unit - Moved in 1990 to 1994 (%) - White
Year householder moved into unit - Moved in 1990 to 1994 (%) - Black or African American
Year householder moved into unit - Moved in 1990 to 1994 (%) - Asian
Year householder moved into unit - Moved in 1990 to 1994 (%) - Hispanic or Latino
Year householder moved into unit - Moved in 1990 to 1994 (%) - American Indian and Alaska Native
Year householder moved into unit - Moved in 1990 to 1994 (%) - Multirace
Year householder moved into unit - Moved in 1990 to 1994 (%) - Other Race
Year householder moved into unit - Moved in 1980 to 1989 (%)
Year householder moved into unit - Moved in 1980 to 1989 (%) - White
Year householder moved into unit - Moved in 1980 to 1989 (%) - Black or African American
Year householder moved into unit - Moved in 1980 to 1989 (%) - Asian
Year householder moved into unit - Moved in 1980 to 1989 (%) - Hispanic or Latino
Year householder moved into unit - Moved in 1980 to 1989 (%) - American Indian and Alaska Native
Year householder moved into unit - Moved in 1980 to 1989 (%) - Multirace
Year householder moved into unit - Moved in 1980 to 1989 (%) - Other Race
Year householder moved into unit - Moved in 1970 to 1979 (%)
Year householder moved into unit - Moved in 1970 to 1979 (%) - White
Year householder moved into unit - Moved in 1970 to 1979 (%) - Black or African American
Year householder moved into unit - Moved in 1970 to 1979 (%) - Asian
Year householder moved into unit - Moved in 1970 to 1979 (%) - Hispanic or Latino
Year householder moved into unit - Moved in 1970 to 1979 (%) - American Indian and Alaska Native
Year householder moved into unit - Moved in 1970 to 1979 (%) - Multirace
Year householder moved into unit - Moved in 1970 to 1979 (%) - Other Race
Year householder moved into unit - Moved in 1969 or earlier (%)
Year householder moved into unit - Moved in 1969 or earlier (%) - White
Year householder moved into unit - Moved in 1969 or earlier (%) - Black or African American
Year householder moved into unit - Moved in 1969 or earlier (%) - Asian
Year householder moved into unit - Moved in 1969 or earlier (%) - Hispanic or Latino
Year householder moved into unit - Moved in 1969 or earlier (%) - American Indian and Alaska Native
Year householder moved into unit - Moved in 1969 or earlier (%) - Multirace
Year householder moved into unit - Moved in 1969 or earlier (%) - Other Race
Housing units lacking complete plumbing facilities (%)
Housing units lacking complete kitchen facilities (%)
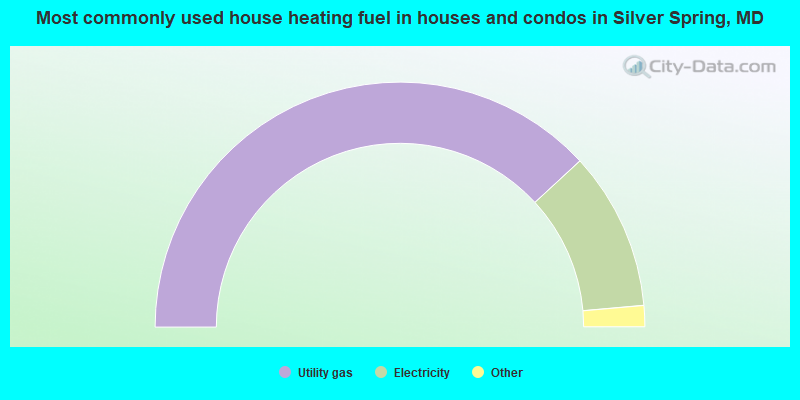
House heating fuel used in houses and condos - Utility gas (%)
House heating fuel used in houses and condos - Bottled, tank, or LP gas (%)
House heating fuel used in houses and condos - Electricity (%)
House heating fuel used in houses and condos - Fuel oil, kerosene, etc. (%)
House heating fuel used in houses and condos - Coal or coke (%)
House heating fuel used in houses and condos - Wood (%)
House heating fuel used in houses and condos - Solar energy (%)
House heating fuel used in houses and condos - Other fuel (%)
House heating fuel used in houses and condos - No fuel used (%)
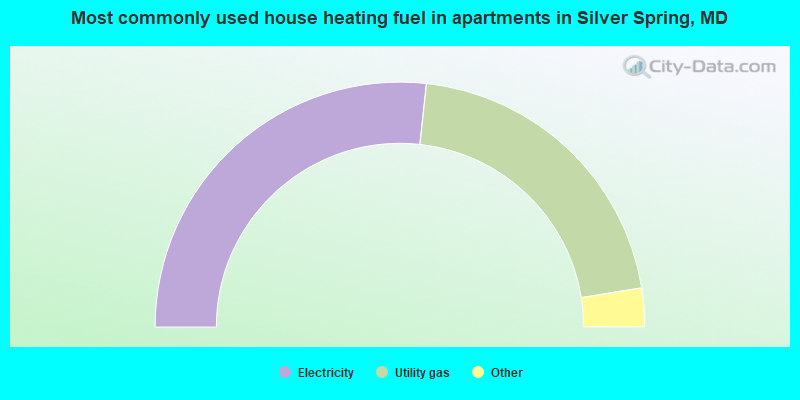
House heating fuel used in apartments - Utility gas (%)
House heating fuel used in apartments - Bottled, tank, or LP gas (%)
House heating fuel used in apartments - Electricity (%)
House heating fuel used in apartments - Fuel oil, kerosene, etc. (%)
House heating fuel used in apartments - Coal or coke (%)
House heating fuel used in apartments - Wood (%)
House heating fuel used in apartments - Solar energy (%)
House heating fuel used in apartments - Other fuel (%)
House heating fuel used in apartments - No fuel used (%)
Median year house/condo built: 1954Median year apartment built: 1977Household type by relationship:
Households: 75,313
Male householders: 16,048 (5,996 living alone ), Female householders: 18,661 (9,410 living alone )11,153 spouses (10,955 opposite-sex spouses ), 2,595 unmarried partners , (2,560 opposite-sex unmarried partners ), 19,545 children (17,574 natural , 214 adopted , 1,757 stepchildren ), 842 grandchildren , 1,280 brothers or sisters , 1,198 parents , 0 foster children , 1,068 other relatives , 2,737 non-relatives In group quarters: 186
Size of family households: 6,514 2-persons , 4,738 3-persons , 2,901 4-persons , 2,001 5-persons , 444 6-persons , 163 7-or-more-persons .
Size of nonfamily households: 15,406 1-person , 2,086 2-persons , 277 3-persons , 179 4-persons .
10,601 married couples with children. single-parent households (1,535 men , 2,028 women ).
55.7% of residents of Silver Spring speak English at home. of residents speak Spanish at home (46% speak English very well , 14% speak English well , 24% speak English not well , 16% don't speak English at all ).of residents speak other Indo-European language at home (68% speak English very well , 19% speak English well , 11% speak English not well , 3% don't speak English at all ).of residents speak Asian or Pacific Island language at home (57% speak English very well , 18% speak English well , 21% speak English not well , 4% don't speak English at all ).of residents speak other language at home (69% speak English very well , 24% speak English well , 4% speak English not well , 3% don't speak English at all ).
Foreign born population: 24,133 (32.0%)of them are naturalized citizens )
Median number of rooms in houses and condos:
Median number of rooms in apartments
Owner-occupied Renter-occupied
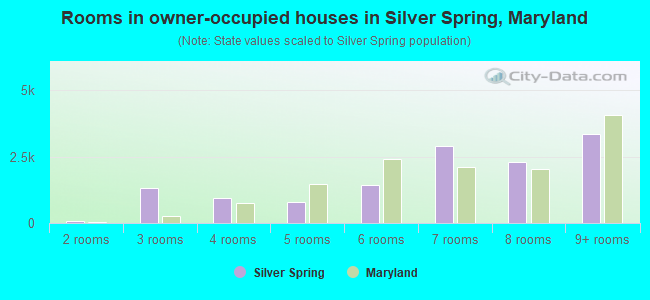
Rooms in owner-occupied houses in Silver Spring, Maryland
0 1 room 75 2 rooms 1,306 3 rooms 950 4 rooms 807 5 rooms 1,437 6 rooms 2,882 7 rooms 2,309 8 rooms 3,363 9+ rooms
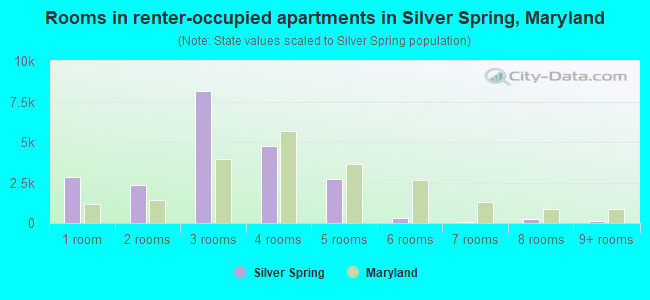
Rooms in renter-occupied apartments in Silver Spring, Maryland
2,868 1 room 2,361 2 rooms 8,150 3 rooms 4,763 4 rooms 2,734 5 rooms 291 6 rooms 77 7 rooms 240 8 rooms 96 9+ rooms
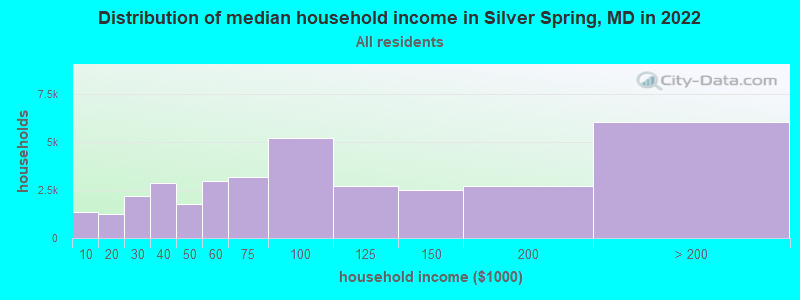
Silver Spring, MD household income distribution 1,362 Less than $10,0001,251 $10,000 to $19,9992,197 $20,000 to $29,9992,853 $30,000 to $39,9991,759 $40,000 to $49,9992,977 $50,000 to $59,9993,168 $60,000 to $74,9995,183 $75,000 to $99,9992,712 $100,000 to $124,9992,513 $125,000 to $149,9992,700 $150,000 to $199,9996,034 $200,000 or more
Home value of owner - occupied houses in 2022 in Silver Spring, MD 69 Less than $10,0006 $30,000 to $34,99912 $40,000 to $49,99931 $50,000 to $59,99918 $60,000 to $69,9995 $80,000 to $89,99911 $90,000 to $99,99932 $100,000 to $124,99934 $125,000 to $149,999179 $150,000 to $174,999118 $175,000 to $199,999390 $200,000 to $249,999368 $250,000 to $299,9991,283 $300,000 to $399,9991,426 $400,000 to $499,9995,100 $500,000 to $749,9993,266 $750,000 to $999,999687 $1,000,000 to $1,499,99954 $1,500,000 to $1,999,99964 $2,000,000 or moreRent paid by renters in 2022 in Silver Spring, MD 78 Less than $1005 $100 to $14998 $150 to $19966 $200 to $249133 $250 to $29912 $300 to $34960 $350 to $39911 $400 to $44950 $450 to $49949 $500 to $54918 $550 to $59926 $600 to $64942 $700 to $749332 $800 to $899221 $900 to $9991,782 $1,000 to $1,2495,125 $1,250 to $1,4998,182 $1,500 to $1,9993,482 $2,000 to $2,4991,298 $2,500 to $2,999301 $3,000 to $3,499172 $3,500 or more261 No cash rent
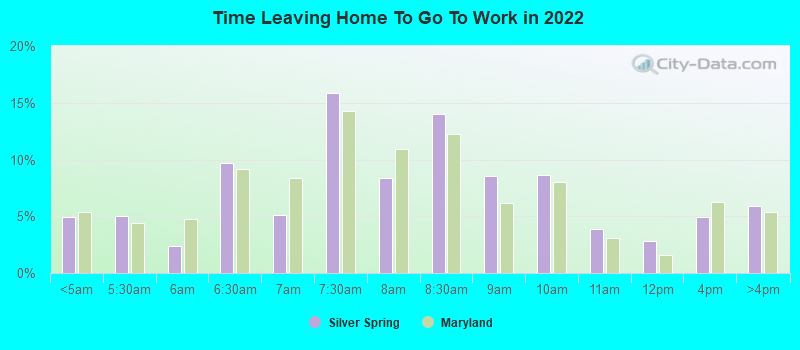
Percentage of workers working in this county: 56.0%Number of people working at home: 12,031 (26.0% of all workers )
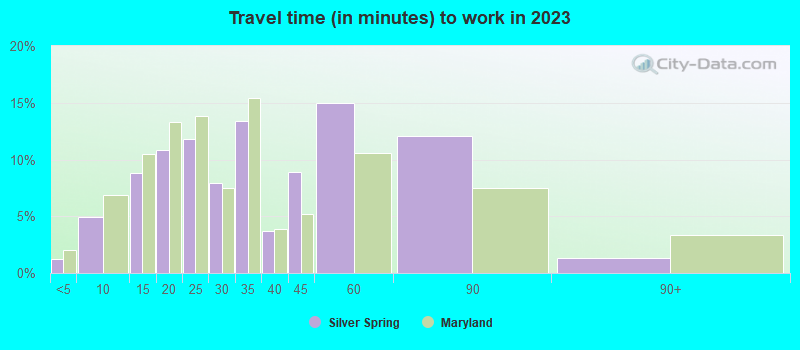
Travel time to work (commute)
Less than 5 minutes: 905 to 9 minutes: 67710 to 14 minutes: 2,54315 to 19 minutes: 4,32520 to 24 minutes: 2,74625 to 29 minutes: 2,77330 to 34 minutes: 6,50435 to 39 minutes: 2,42640 to 44 minutes: 2,59445 to 59 minutes: 4,95160 to 89 minutes: 3,57590 or more minutes: 981
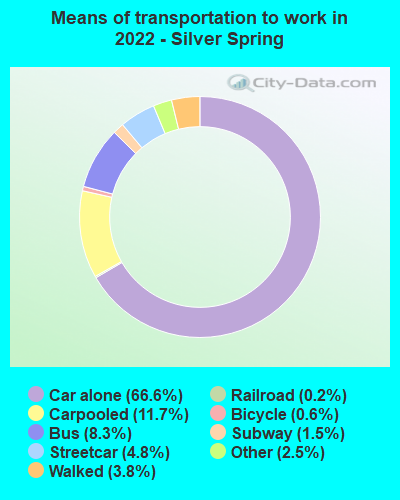
Means of transportation to work:
Drove a car alone: 21,071 (48.3%)Carpooled: 3,936 (9.0%)Bus : 2,251 (5.2%)Subway or elevated rail : 1,267 (2.9%)Long-distance train or commuter rail : 422 (1.0%)Light rail, streetcar or trolley : 54 (0.1%)Taxi: 834 (1.9%)Bicycle: 315 (0.7%)Walked: 1,029 (2.4%)Worked at home: 12,062 (27.7%)
Unemployment by race in 2022
Unemployment rate for White non-Hispanic residents 1.1% Males4.4% FemalesUnemployment rate for Black residents 5.4% Males2.1% FemalesUnemployment rate for American Indian and Alaska Native residents 26.2% FemalesUnemployment rate for Asian residents 3.9% Males4.6% FemalesUnemployment rate for other race residents 1.6% Males10.7% FemalesUnemployment rate for two or more race residents 1.3% Males1.8% FemalesUnemployment rate for Hispanic or Latino residents 2.2% Males7.2% Females
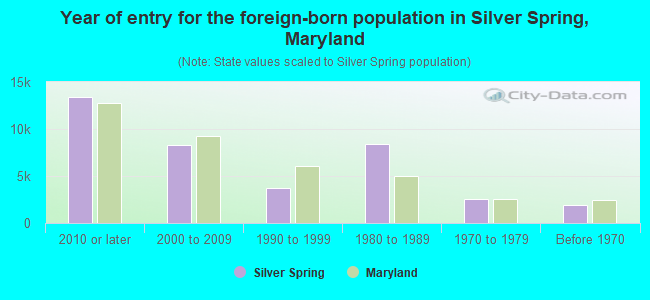
Year of entry for the foreign-born population in Silver Spring, Maryland
13,392 2010 or later 8,259 2000 to 2009 3,672 1990 to 1999 8,392 1980 to 1989 2,557 1970 to 1979 1,920 Before 1970
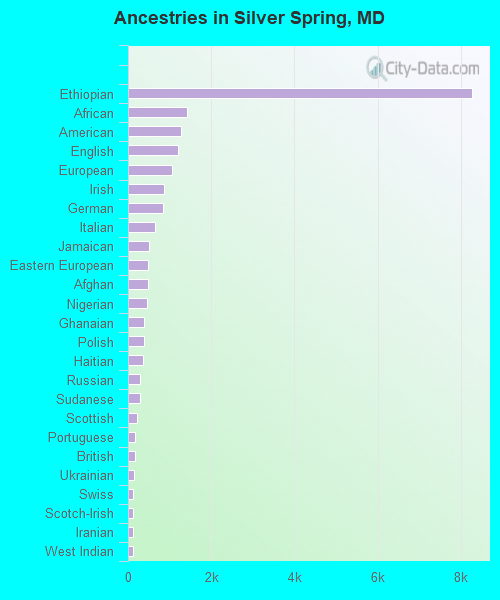
First ancestries reported:
Ethiopian: 8,264 (16.1%)
African: 1,423 (2.8%)
American: 1,270 (2.5%)
English: 1,191 (2.3%)
European: 1,055 (2.1%)
Irish: 869 (1.7%)
German: 837 (1.6%)
Italian: 644 (1.3%)
Jamaican: 504 (1.0%)
Eastern European: 470 (0.9%)
Afghan: 469 (0.9%)
Nigerian: 458 (0.9%)
Ghanaian: 379 (0.7%)
Polish: 376 (0.7%)
Haitian: 364 (0.7%)
Russian: 293 (0.6%)
Sudanese: 284 (0.6%)
Scottish: 227 (0.4%)
Portuguese: 168 (0.3%)
British: 161 (0.3%)
Ukrainian: 147 (0.3%)
Swiss: 127 (0.2%)
Scotch-Irish: 122 (0.2%)
Iranian: 121 (0.2%)
West Indian: 120 (0.2%)
Latvian: 113 (0.2%)
Ugandan: 101 (0.2%)
French: 92 (0.2%)
Romanian: 87 (0.2%)
Greek: 77 (0.1%)
Liberian: 77 (0.1%)
Czech: 70 (0.1%)
Finnish: 67 (0.1%)
Bahamian: 62 (0.1%)
Sierra Leonean: 62 (0.1%)
Guyanese: 60 (0.1%)
Northern European: 58 (0.1%)
Moroccan: 58 (0.1%)
Swedish: 54 (0.1%)
Norwegian: 53 (0.1%)
British West Indian: 47 (0.09%)
Lebanese: 46 (0.09%)
Slovak: 43 (0.08%)
Dutch: 36 (0.07%)
Iraqi: 35 (0.07%)
Jordanian: 30 (0.06%)
French Canadian: 28 (0.05%)
Kenyan: 28 (0.05%)
Turkish: 27 (0.05%)
Slavic: 27 (0.05%)
Serbian: 23 (0.04%)
Austrian: 23 (0.04%)
Canadian: 22 (0.04%)
Bulgarian: 20 (0.04%)
Danish: 18 (0.04%)
Trinidadian and Tobagonian: 18 (0.04%)
Senegalese: 17 (0.03%)
Czechoslovakian: 17 (0.03%)
Lithuanian: 16 (0.03%)
German Russian: 14 (0.03%)
Egyptian: 13 (0.03%)
Welsh: 8 (0.02%)
Brazilian: 7 (0.01%)
Hungarian: 7 (0.01%)
Croatian: 6 (0.01%)
Scandinavian: 6 (0.01%)
Most common places of birth for foreign-born residents (%): Ethiopia Silver Spring:
26.4% (7,618)Maryland:
3.2% (30,870)
El Salvador Silver Spring:
13.6% (3,912)Maryland:
12.0% (115,412)
Guatemala Silver Spring:
8.5% (2,438)Maryland:
4.4% (42,350)
Honduras Silver Spring:
5.2% (1,490)Maryland:
2.5% (24,026)
Bangladesh Silver Spring:
4.5% (1,301)Maryland:
0.7% (7,124)
Vietnam Silver Spring:
2.7% (766)Maryland:
1.9% (18,716)
India Silver Spring:
2.5% (729)Maryland:
6.4% (61,725)
Ghana Silver Spring:
2.4% (706)Maryland:
1.8% (17,774)
Korea Silver Spring:
2.1% (593)Maryland:
3.4% (32,635)
Nicaragua Silver Spring:
1.8% (514)Maryland:
0.6% (5,899)
Cameroon Silver Spring:
1.7% (495)Maryland:
2.5% (23,969)
Afghanistan Silver Spring:
1.6% (464)Maryland:
0.4% (3,905)
Nigeria Silver Spring:
1.6% (455)Maryland:
4.6% (44,825)
Other Western Africa Silver Spring:
1.5% (445)Maryland:
0.7% (6,317)
Mexico Silver Spring:
1.5% (444)Maryland:
3.5% (34,065)
China, excluding Hong Kong and Taiwan Silver Spring:
1.5% (443)Maryland:
4.6% (44,742)
Place of birth for U.S.-born residents:
This state: 14,850Other state: 34,536Northeast: 9,378Midwest: 5,264South: 16,074West: 3,820 86.7% of Silver Spring residents lived in the same house 1 years ago.
Out of people who lived in different houses, 32.2% lived in this county.
Out of people who lived in different counties, 36.9% lived in Maryland.
Silver Spring:
86.7%State average:
88.5%
Education attainment for males 25 years and older:
No schooling: 1,108Nursery to 4th grade: 3845th and 6th grade: 1,1297th and 8th grade: 3569th grade: 37410th grade: 8611th grade: 4012th grade, no diploma: 291High school graduate (or equivalency): 3,419Less than 1 year of college: 618Some college more than 1 year, no degree: 1,982Associate degree: 1,791Bachelor's degree: 5,360Master's degree: 5,016Professional school degree: 1,281Doctorate degree: 2,066
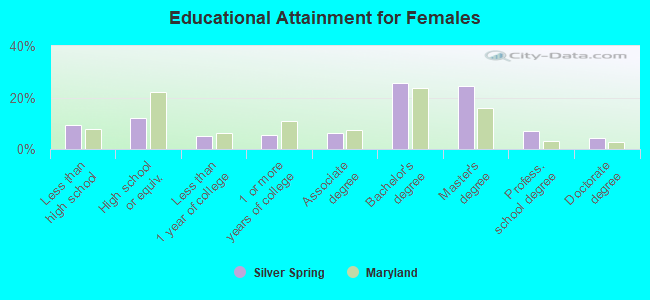
Education attainment for females 25 years and older:
No schooling: 519Nursery to 4th grade: 6805th and 6th grade: 5327th and 8th grade: 1579th grade: 30510th grade: 011th grade: 9112th grade, no diploma: 426High school graduate (or equivalency): 3,474Less than 1 year of college: 1,467Some college more than 1 year, no degree: 1,603Associate degree: 1,791Bachelor's degree: 7,422Master's degree: 7,097Professional school degree: 2,034Doctorate degree: 1,191
Housing units in structures:
One, detached: 9,429One, attached: 2,021Two: 7203 or 4: 1,4365 to 9: 3,53610 to 19: 2,17220 to 49: 72950 or more: 15,228Mobile homes: 170Housing units lacking complete plumbing facilities in 2022: 0.2%House/condo owner moved in on average 11 years ago
Renter moved in on average 2 years ago
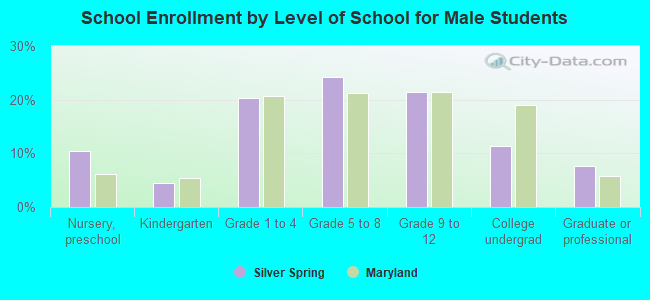
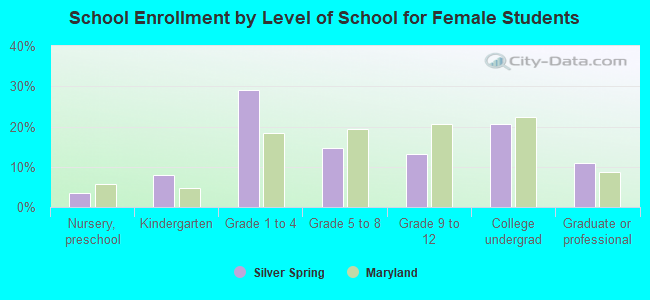
Private vs. public school enrollment:
Students in private schools in grades 1 to 8 (elementary and middle school): 577 Students in private schools in grades 9 to 12 (high school): 262 Students in private undergraduate colleges: 841